Season summary
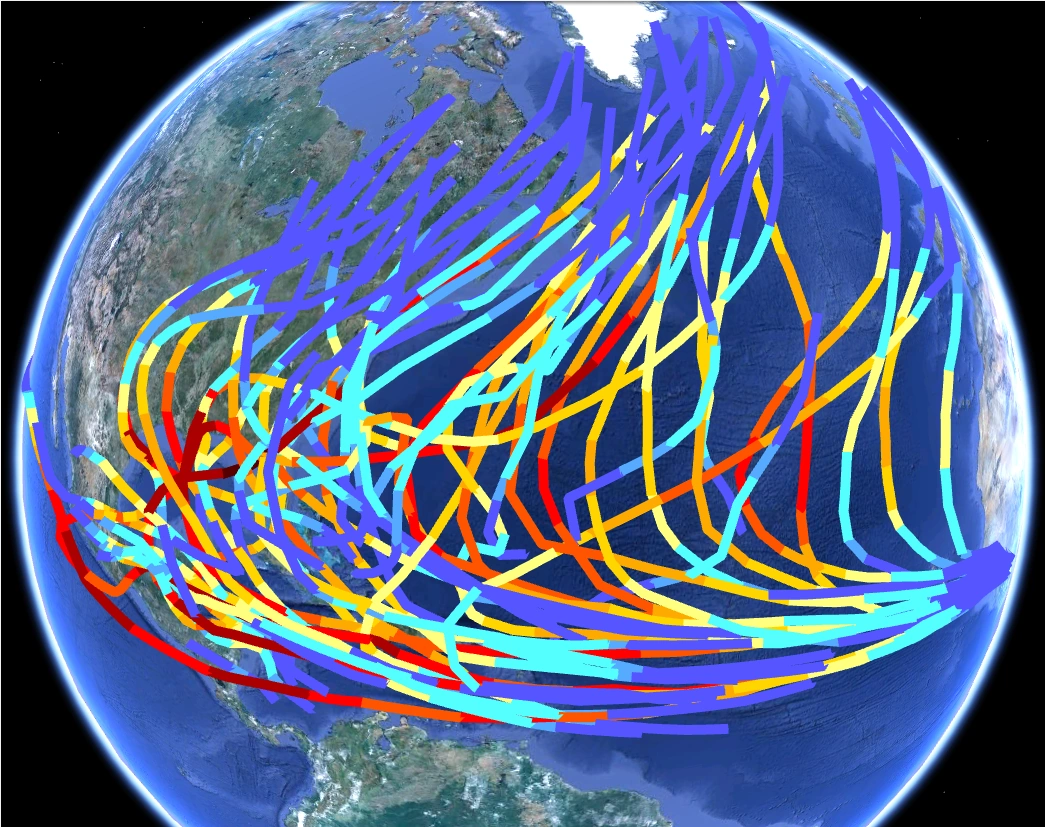
The 2100 Atlantic hurricane season was the most active Atlantic hurricane season in recorded history. Out of the 55 depressions that formed, 53 became tropical storms. 44 became hurricanes, and 29 became major hurricanes; five of these reached Category 6 intensity and higher. Most of the storms affected land. The most destructive hurricane was Hurricane Shary, which caused $420 billion in damage. It was also the deadliest, causing 42,763 deaths. Shary was not just the most destructive of the season, but the most destructive in Atlantic history. The strongest hurricane was Hurricane Mu, which became a Category 7 hurricane.
This season was the most destructive in history, with many areas virtually wiped out by all the hurricanes. It was so destructive it made the 2005 season look like nothing. It was also so active it exhausted the main list as well as the Greek alphabet, and the Hebrew alphabet had to be used for the first time ever. The NHC added Q, U, X, Y, and Z names to the list because of how active this season was becoming. They were Qualia, Unala, Xavier, Yolanda, and Zeke.
By 2100, global warming has made the oceans much warmer. There was also a strong La Nina, which warms the Atlantic and cools the Pacific. Both the global warming and the La Nina has made the environment in the Atlantic extremely favorable for hurricanes. Without global warming, this season would probably be only as active as 2010, which had 19 named storms compared to 2100's 53.
Season summary[]
The first storm, Alan, formed in April, 2 months before the official start of the season. Bernice also formed in April, making a very rare occurrence of 2 storms in April. Clyde, TD 4, and Debra formed in May, while Bernice crossed over to May from April. That makes 5 storms before the official start of the season, another very rare occurrence. In June, the season was showing signs of being hyperactive, as 6 storms existed in June, including Debra which formed in May. 10 storms existed in July, including the Category 6 Hurricane Oliver, which is the most ever for that month. The record active pace continued, as 12 storms existed in August, including the cataclysmic Hurricane Shary. The extreme pace showed no signs of slowing down, and 14 storms existed in September. The pace started to wind down as the calendar turned to October, and 12 storms existed in that month, including Cat 7 Hurricane Mu. There were 5 storms in November, and 3 post-season storms. The last storm of the season, TS Gimel, crossed over to 2101, one of few storms to do so. Over all, there were 55 storms, the most ever recorded.
Timeline[]

List of storms[]
Tropical Storm Alan[]
Main Article: Tropical Storm Alan (2100)
| Tropical storm (SSHWS) | |
  | |
| Duration | April 18 – April 22 |
|---|---|
| Peak intensity | 60 mph (95 km/h) (1-min) 995 mbar (hPa) |
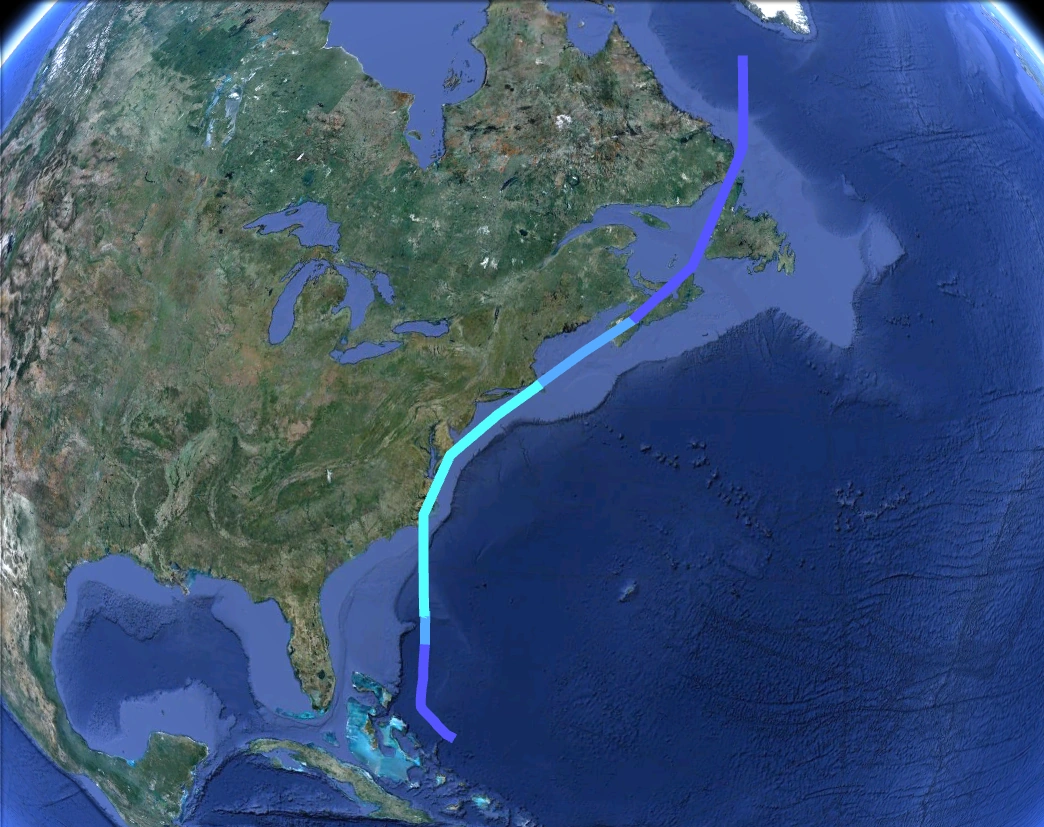
Alan affected the US east coast and Nova Scotia. It caused minimal damage.
Tropical Storm Bernice[]
Main Article: Tropical Storm Bernice (2100)
| Tropical storm (SSHWS) | |
  | |
| Duration | April 30 – May 5 |
|---|---|
| Peak intensity | 70 mph (110 km/h) (1-min) 990 mbar (hPa) |
Bernice didn't affect land, but it did bring some light rainfall to Bermuda when it passed west and north of the island.
Hurricane Clyde[]
Main Article: Hurricane Clyde (2100)
| Category 2 hurricane (SSHWS) | |
  | |
| Duration | May 16 – May 22 |
|---|---|
| Peak intensity | 100 mph (155 km/h) (1-min) 973 mbar (hPa) |
Clyde made landfall on the Yucatán as a Cat 1 and northeastern Mexico as a Cat 2. It caused $57 million in damage and 16 deaths.
Tropical Depression Four[]
Main Article: Tropical Depression Four (2100)
| Tropical depression (SSHWS) | |
  | |
| Duration | May 29 – May 31 |
|---|---|
| Peak intensity | 35 mph (55 km/h) (1-min) 1006 mbar (hPa) |
This depression made landfall on South Carolina. It's only effect was heavy rain.
Tropical Storm Debra[]
Main Article: Tropical Storm Debra (2100)
| Tropical storm (SSHWS) | |
  | |
| Duration | May 30 – June 4 |
|---|---|
| Peak intensity | 70 mph (110 km/h) (1-min) 987 mbar (hPa) |
Debra affected Anguilla, the Virgin Islands, Puerto Rico, Hispaniola, and Cuba. It also affected Florida and the east coast as a remnant low. The storm caused $35 million in damage and 9 deaths.
Hurricane Eddie[]
Main Article: Hurricane Eddie (2100)
| Category 1 hurricane (SSHWS) | |
  | |
| Duration | June 7 – June 16 |
|---|---|
| Peak intensity | 90 mph (150 km/h) (1-min) 979 mbar (hPa) |
Made landfall in Belize as a Category 1 and near Veracruz as a tropical storm. It also passed just south of Jamaica, bringing heavy rain. Eddie's precursor tropical wave affected the Windward Islands. It caused $69 million in damage and 40 deaths.
Hurricane Faye[]
Main Article: Hurricane Faye (2100)
| Category 1 hurricane (SSHWS) | |
  | |
| Duration | June 15 – June 18 |
|---|---|
| Peak intensity | 80 mph (130 km/h) (1-min) 984 mbar (hPa) |
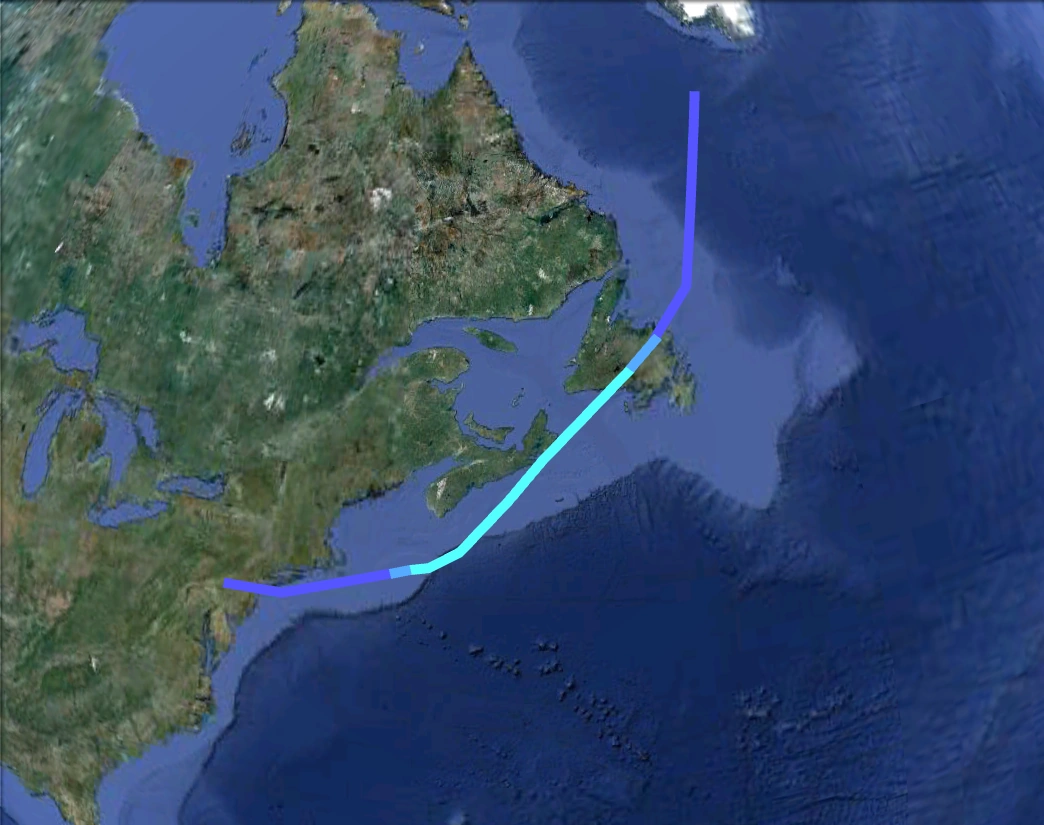
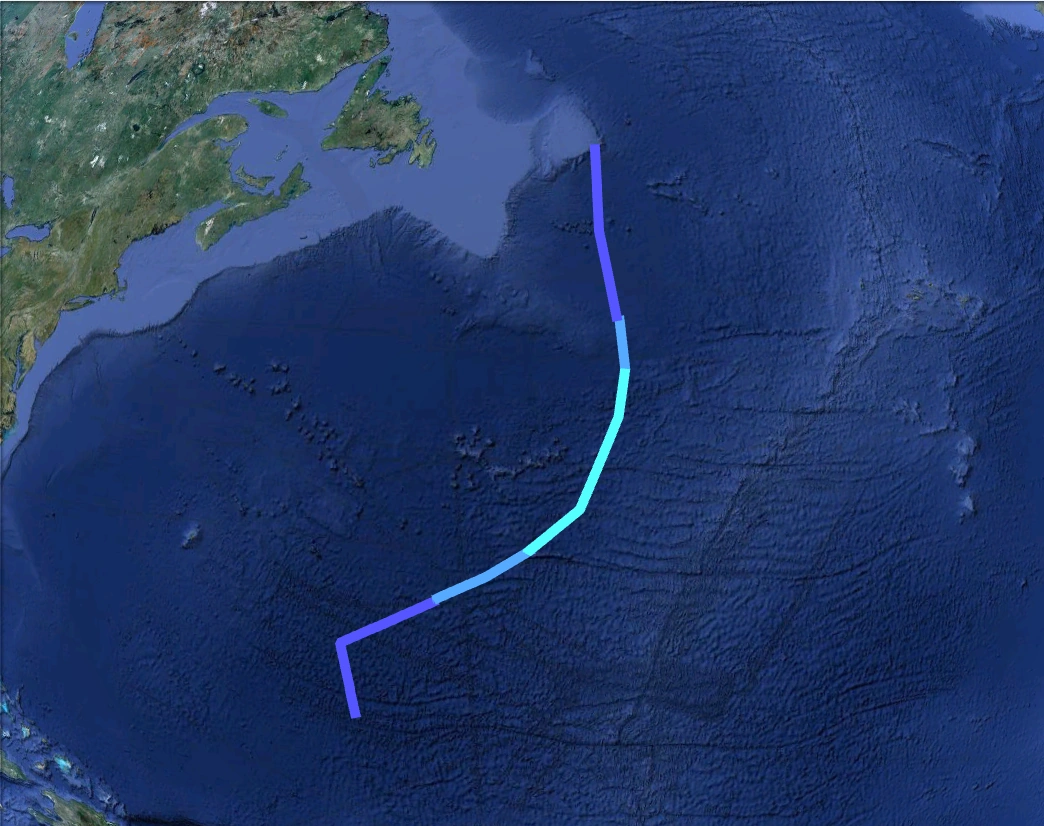
Faye passed near Bermuda and affected Newfoundland as a TS. It peaked as a C1 over open waters. The storm caused minimal damage.
Hurricane Gregory[]
Main Article: Hurricane Gregory (2100)
| Category 3 hurricane (SSHWS) | |
  | |
| Duration | June 18 – June 26 |
|---|---|
| Peak intensity | 125 mph (205 km/h) (1-min) 946 mbar (hPa) |
Gregory affected the Windward Islands as a TS, Jamaica as a C1, the northern tip of the Yucatán as a C2, and Texas as a C3. It dissipated in Indiana. The storm caused $4.1 billion in damage and 43 deaths.
Tropical Storm Hermine[]
Main Article: Tropical Storm Hermine (2100)
| Tropical storm (SSHWS) | |
  | |
| Duration | June 24 – June 29 |
|---|---|
| Peak intensity | 65 mph (100 km/h) (1-min) 990 mbar (hPa) |
Struck Florida as a TS, moved out into the Atlantic and dissipated near Nova Scotia. Hermine caused minimal damage and 1 death.
Hurricane Irving[]
Main Article: Hurricane Irving (2100)
| Category 4 hurricane (SSHWS) | |
  | |
| Duration | June 28 – July 8 |
|---|---|
| Peak intensity | 140 mph (220 km/h) (1-min) 934 mbar (hPa) |
It was a Cape-Verde-type hurricane that affected Bermuda as a Cat 3 and Newfoundland as a Cat 1. The storm caused $215 million in damage and 12 deaths.
Hurricane Jane[]
| Category 3 hurricane (SSHWS) | |
  | |
| Duration | July 2 – July 10 |
|---|---|
| Peak intensity | 115 mph (185 km/h) (1-min) 956 mbar (hPa) |
Another Cape-Verde-type hurricane that luckily stayed out at sea. It peaked as a C3 over open Atlantic waters.
Hurricane Kirt[]
| Category 1 hurricane (SSHWS) | |
  | |
| Duration | July 5 – July 10 |
|---|---|
| Peak intensity | 85 mph (140 km/h) (1-min) 981 mbar (hPa) |
Affected the east coast as a C1 hurricane. Kirt caused $550 million in damage and 5 deaths.
Hurricane Lisa[]
| Category 2 hurricane (SSHWS) | |
  | |
| Duration | July 9 – July 15 |
|---|---|
| Peak intensity | 100 mph (155 km/h) (1-min) 975 mbar (hPa) |
Made landfall in the Louisiana-Mississippi area as a C2 hurricane. Lisa caused $1.6 billion in damage and 14 deaths.
Hurricane Mark[]
| Category 5 hurricane (SSHWS) | |
  | |
| Duration | July 11 – July 22 |
|---|---|
| Peak intensity | 160 mph (260 km/h) (1-min) 916 mbar (hPa) |
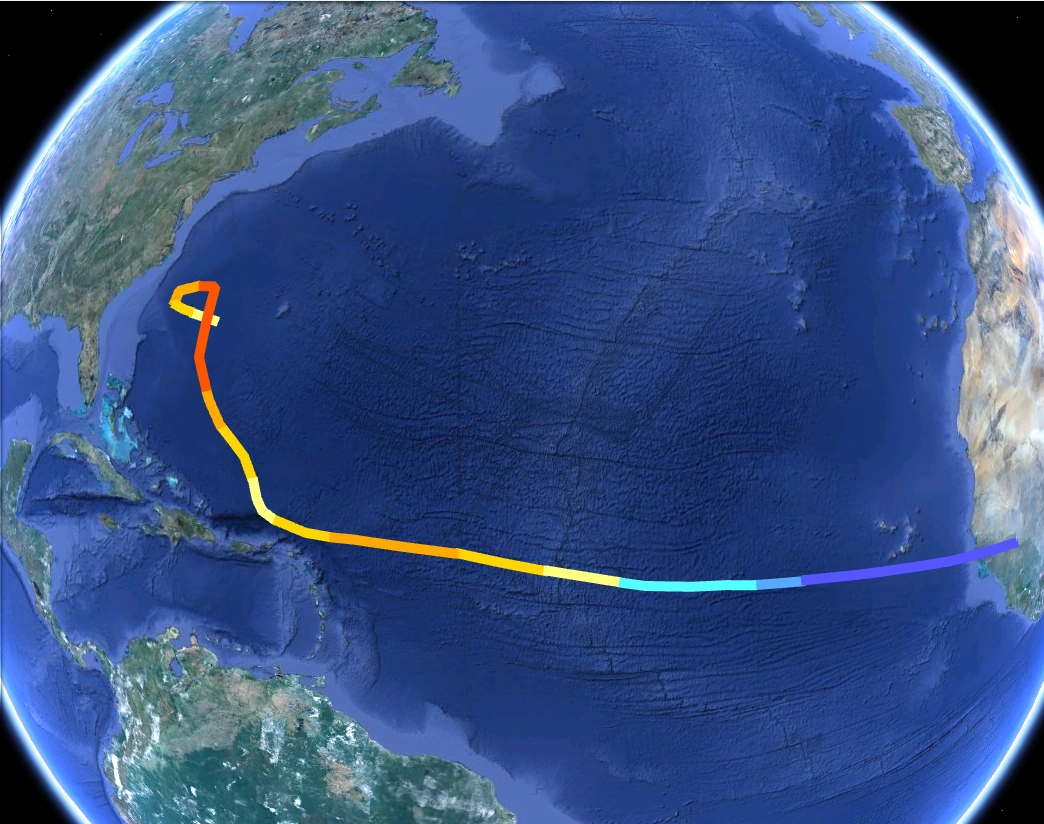
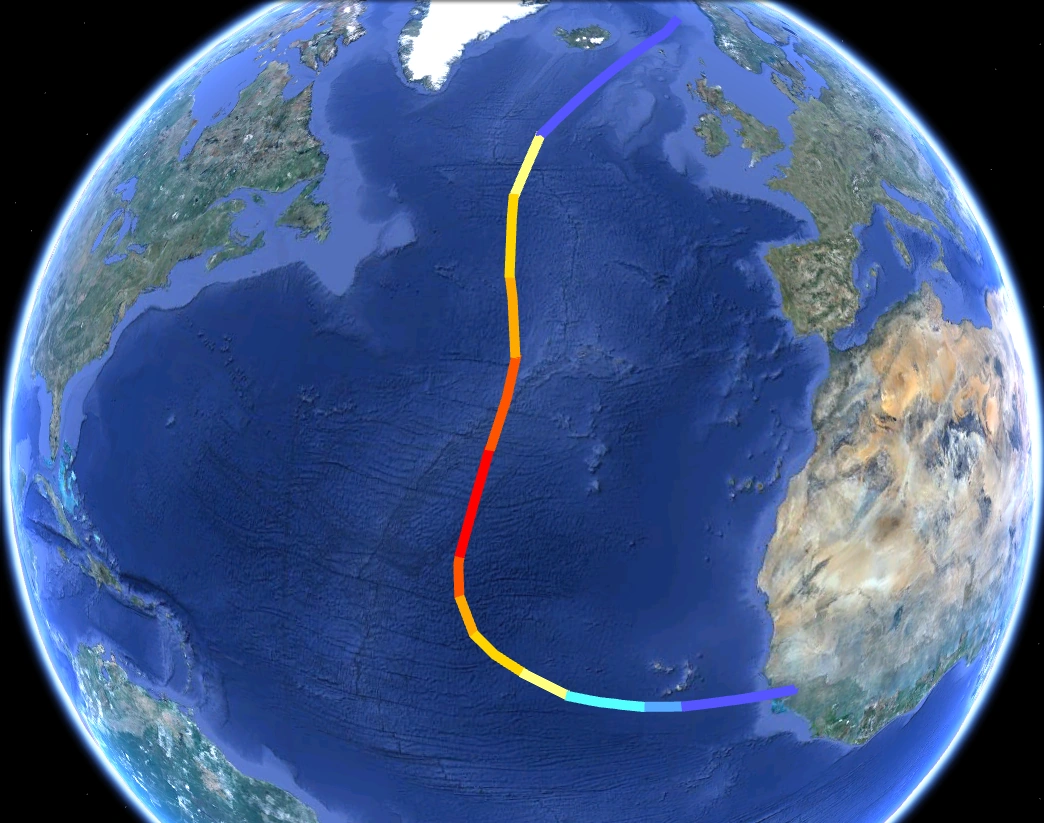
Mark was a Cape-Verde type hurricane that affected the Cape Verde Islands as a TD and the Azores as a Cat 2. It peaked as a C5 over open Atlantic waters. Mark caused $21 million in damage and 2 deaths.
Hurricane Nadia[]
| Category 2 hurricane (SSHWS) | |
  | |
| Duration | July 15 – July 23 |
|---|---|
| Peak intensity | 105 mph (165 km/h) (1-min) 961 mbar (hPa) |
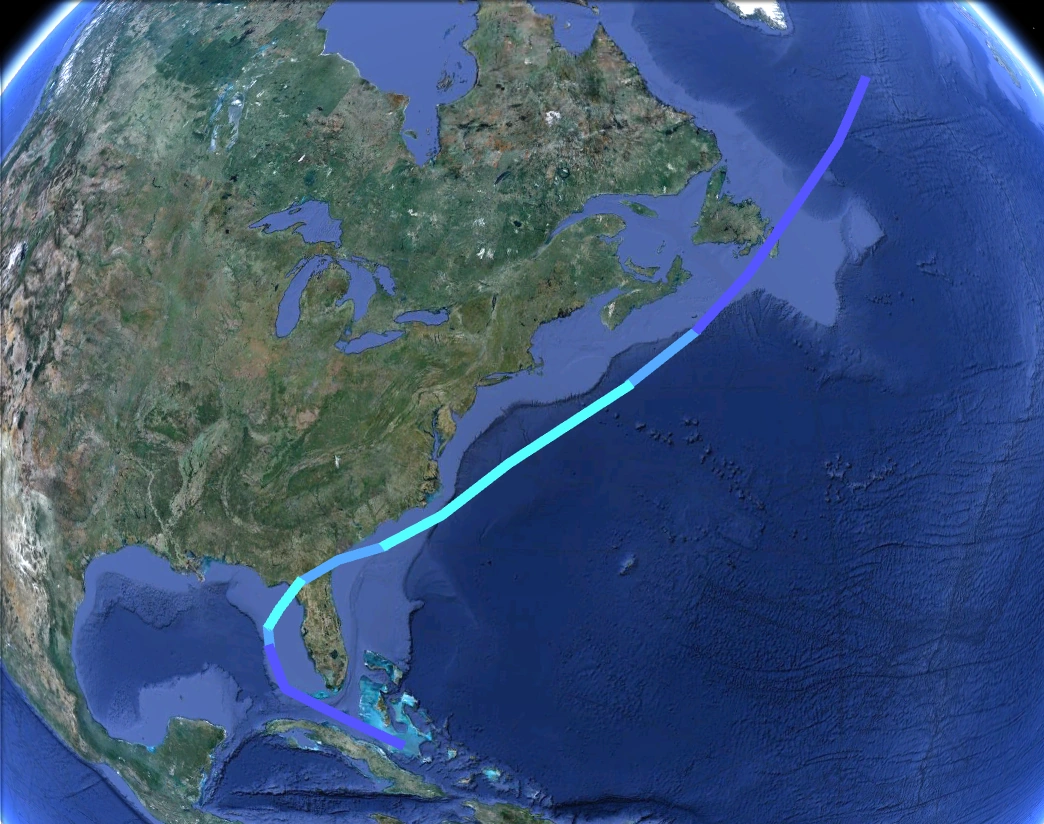
Affected the Virgin Islands, Puerto Rico, and Hispaniola as a Cat 1, and Cuba and Florida as a Cat 2. It dissipated in Virginia. Nadia caused $4.5 billion in damage and 79 deaths throughout its path.
Hurricane Oliver[]
| Category 6 hurricane | |
  | |
| Duration | July 20 – August 10 |
|---|---|
| Peak intensity | 210 mph (340 km/h) (1-min) 866 mbar (hPa) |
It was a Cape-Verde type hurricane that affected the northern Leeward Islands and Puerto Rico as a C5, Hispaniola and Jamaica as a C4, the Yucatán as a C5, the Gulf coast as a C6, and Bermuda as a C1. The storm caused massive devastation along its path, with $248 billion in damage and 7,136 deaths blamed on Oliver.
Hurricane Pamela[]
| Category 4 hurricane (SSHWS) | |
  | |
| Duration | July 23 – July 31 |
|---|---|
| Peak intensity | 145 mph (230 km/h) (1-min) 932 mbar (hPa) |
Affected the Windward Islands as a TS, and Hispaniola, Florida, and the Florida Panhandle as a C4. It dissipated in Michigan. Pamela caused $12 billion in damage and 645 deaths, with most of the deaths in Hispaniola.
Hurricane Qualia[]
| Category 4 hurricane (SSHWS) | |
  | |
| Duration | July 26 – July 31 |
|---|---|
| Peak intensity | 140 mph (220 km/h) (1-min) 936 mbar (hPa) |
Affected Northeast Mexico as a C4. Qualia caused $550 million in damage and 41 deaths.
Hurricane Roy[]
| Category 3 hurricane (SSHWS) | |
  | |
| Duration | July 28 – August 4 |
|---|---|
| Peak intensity | 125 mph (205 km/h) (1-min) 946 mbar (hPa) |
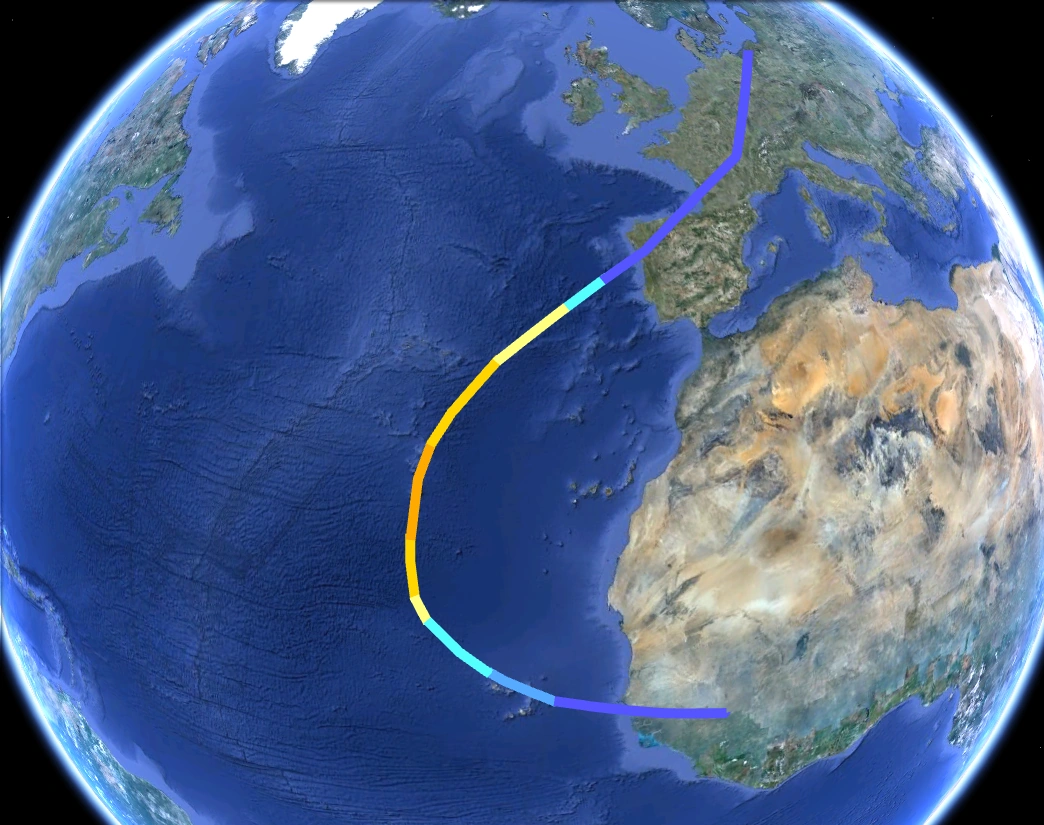
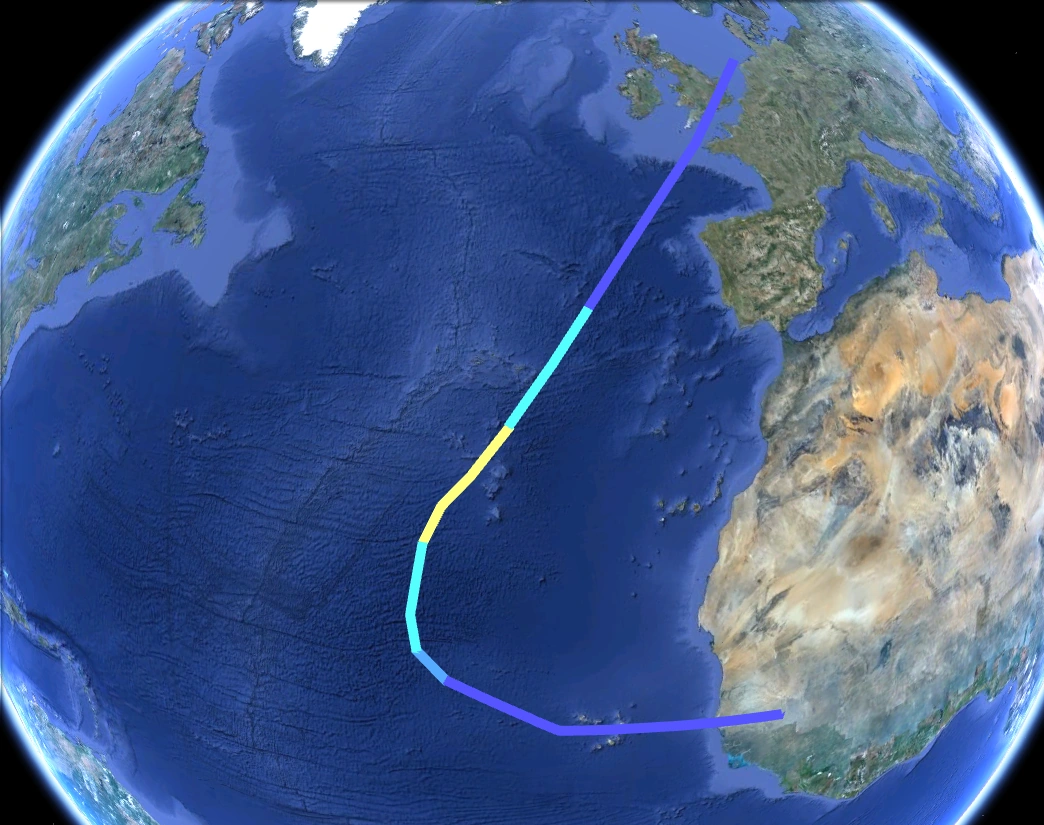
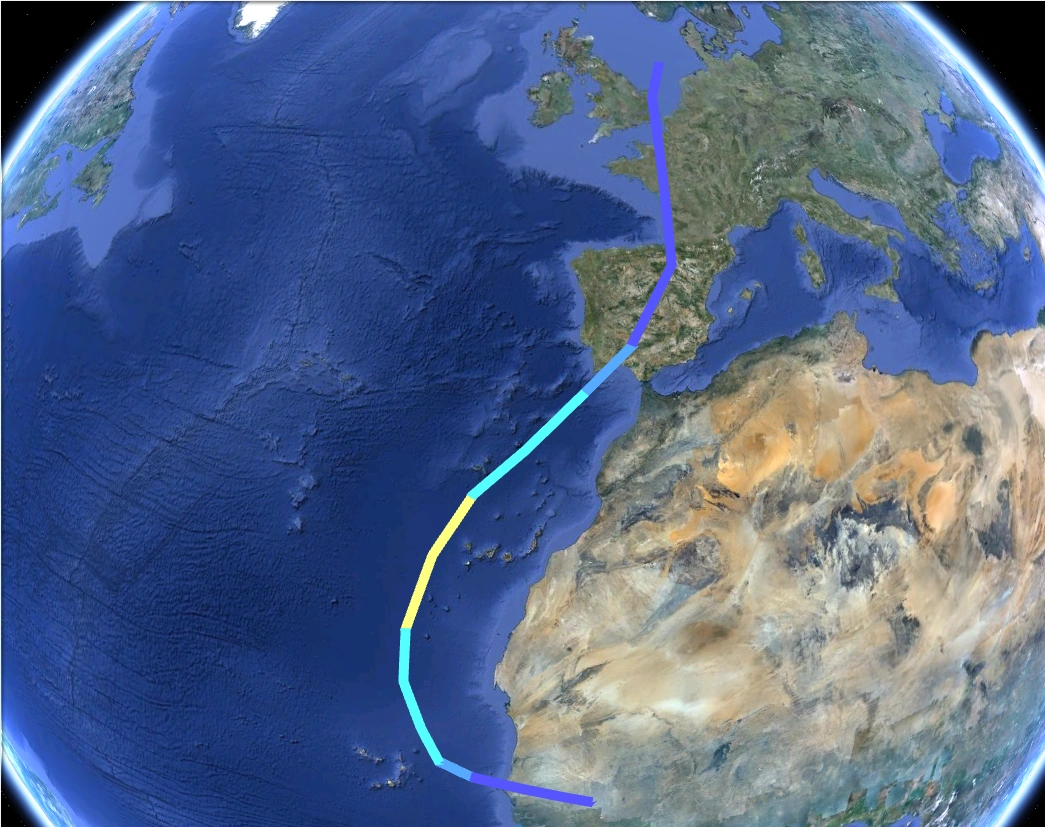
Affected the Cape Verde Islands as a TD and Europe as an extratropical storm. It peaked as a C3 over open Atlantic waters.
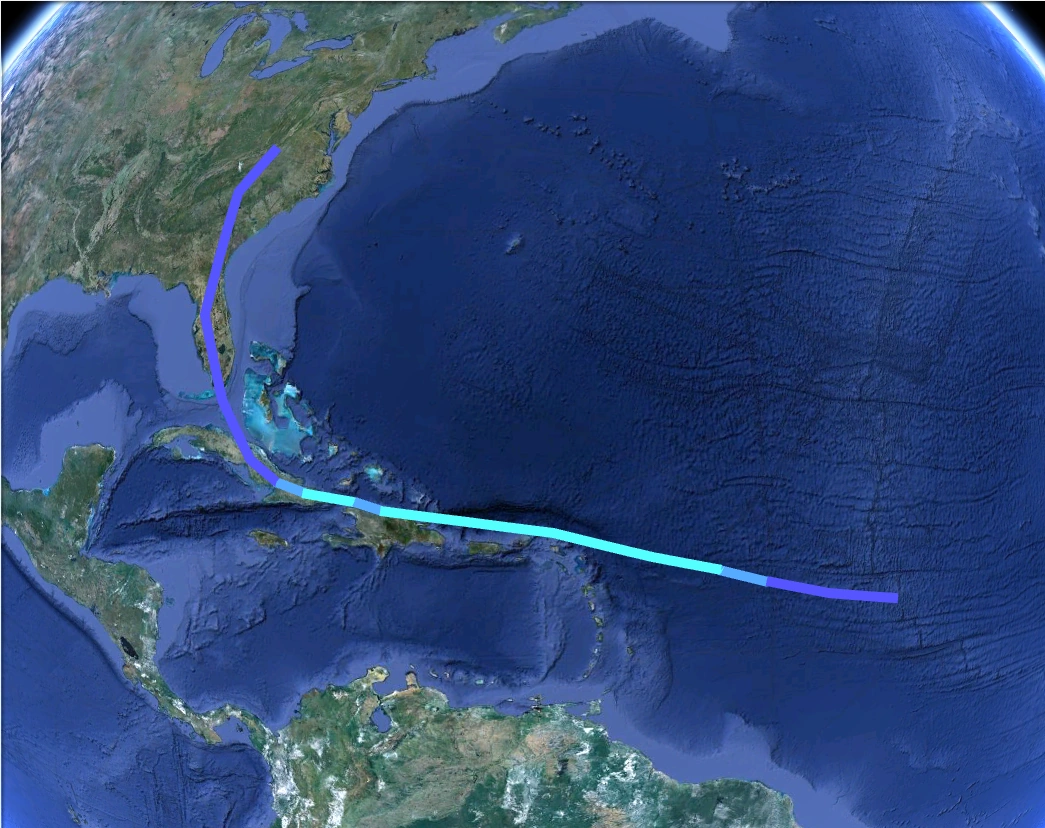
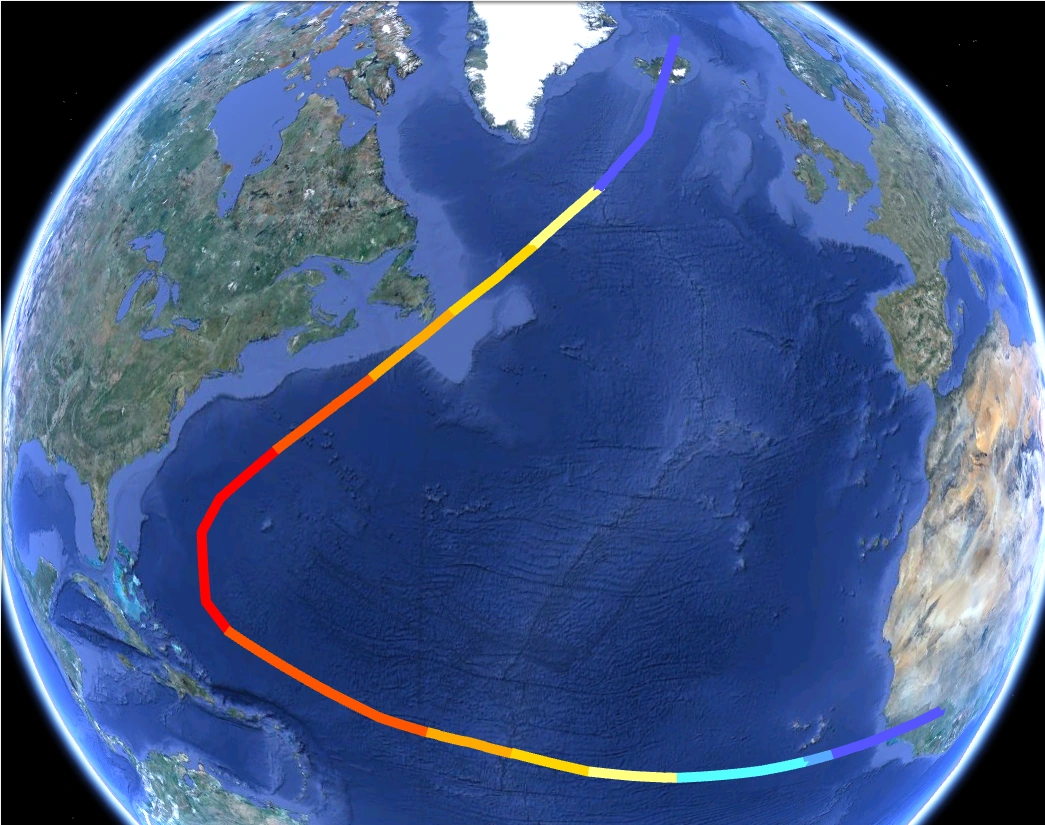
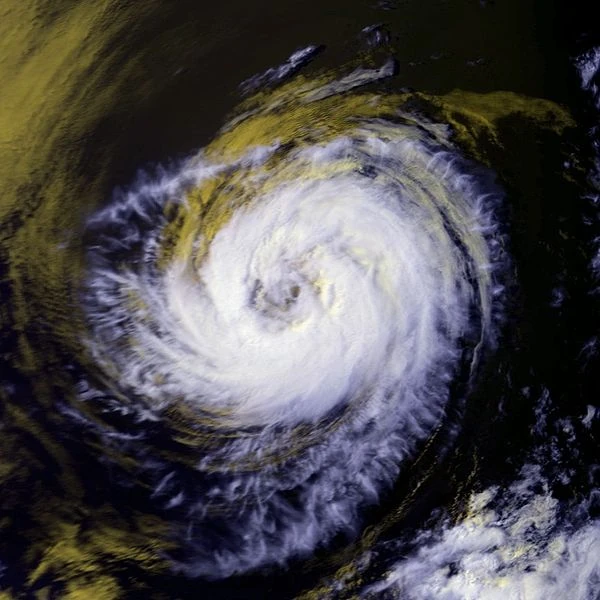
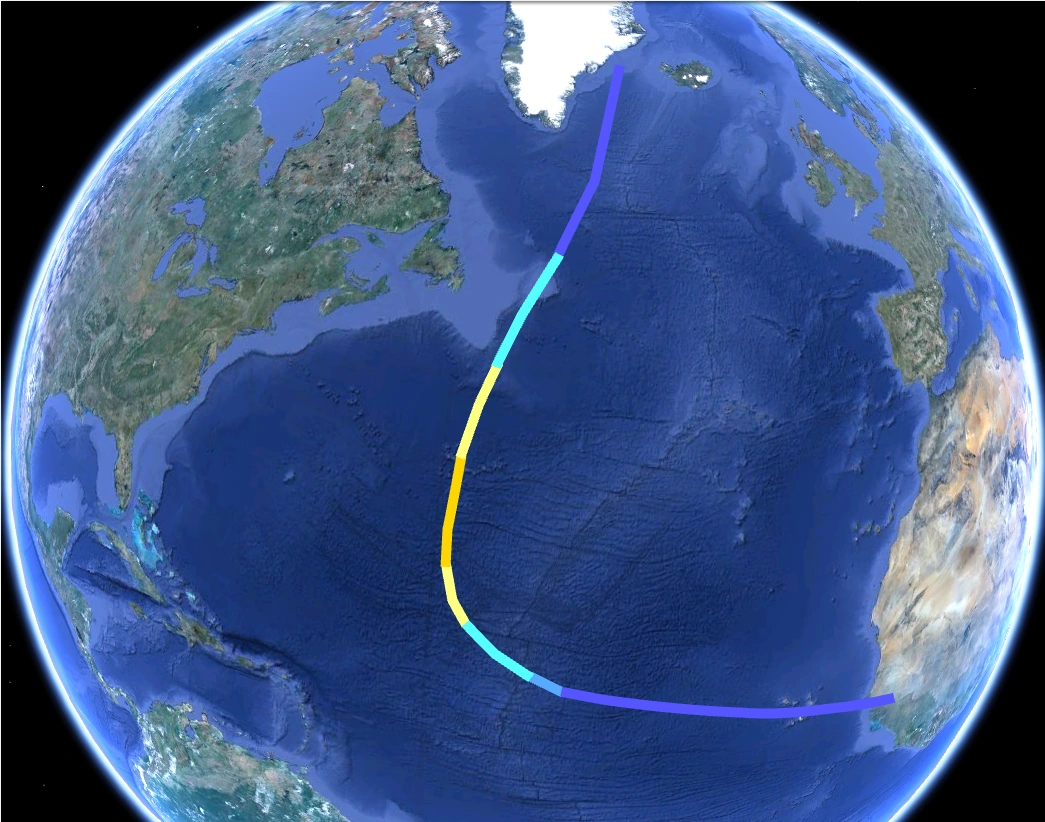
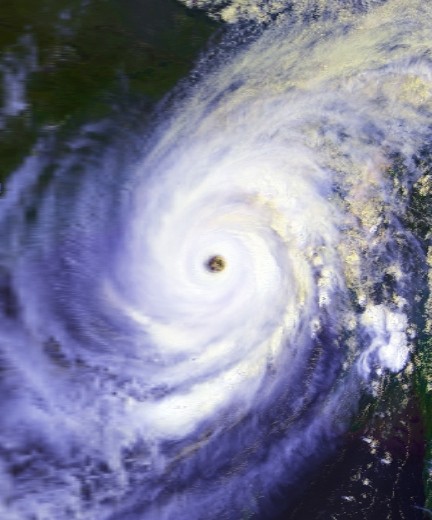
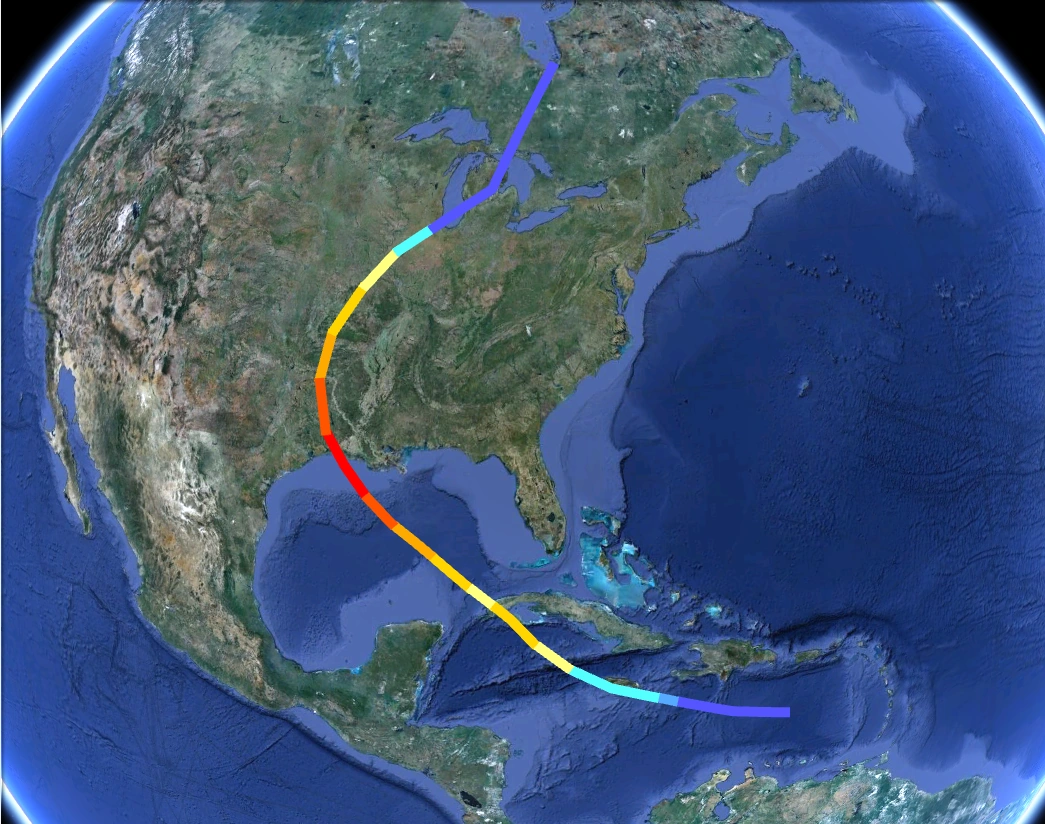
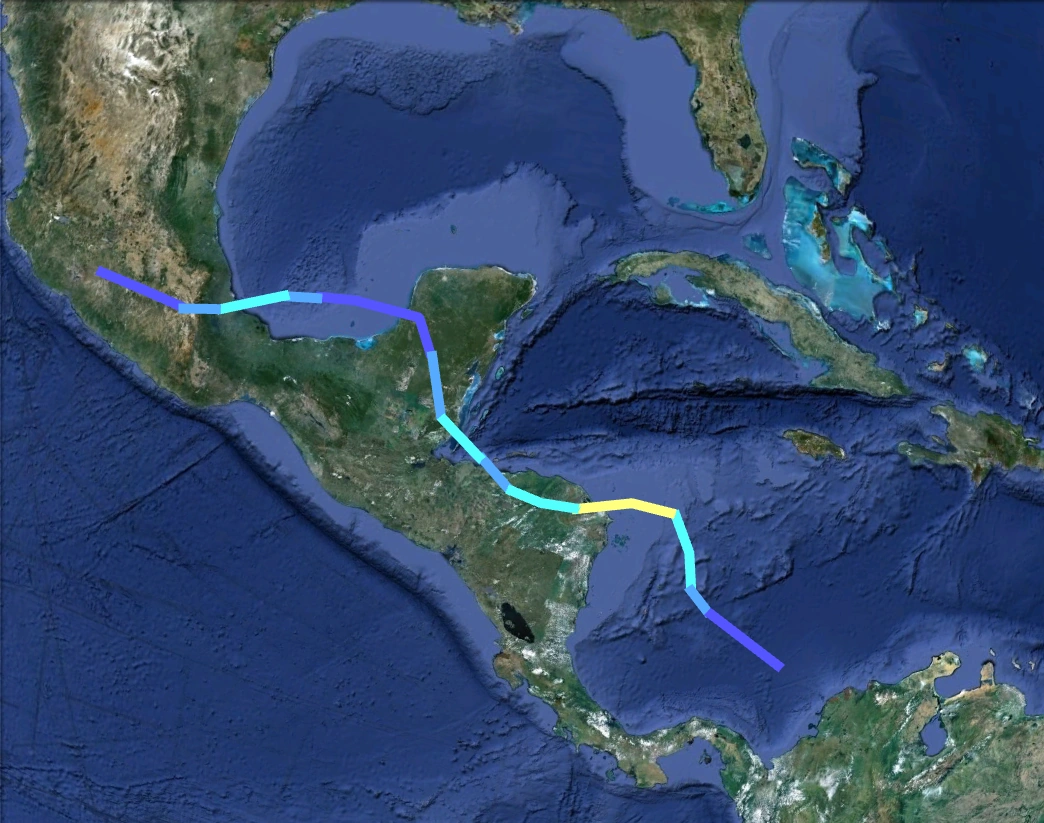
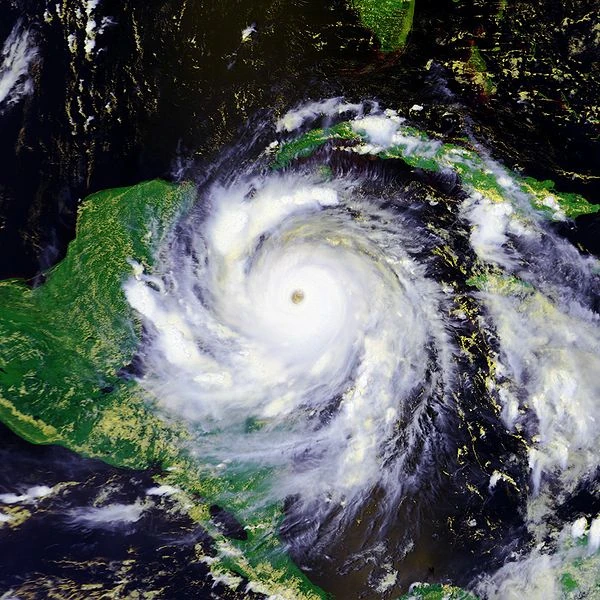
Hurricane Shary[]
- Main article: Hurricane Shary (2100)
| Category 6 hurricane | |
  | |
| Duration | August 3 – September 4 |
|---|---|
| Peak intensity | 230 mph (370 km/h) (1-min) 842 mbar (hPa) |
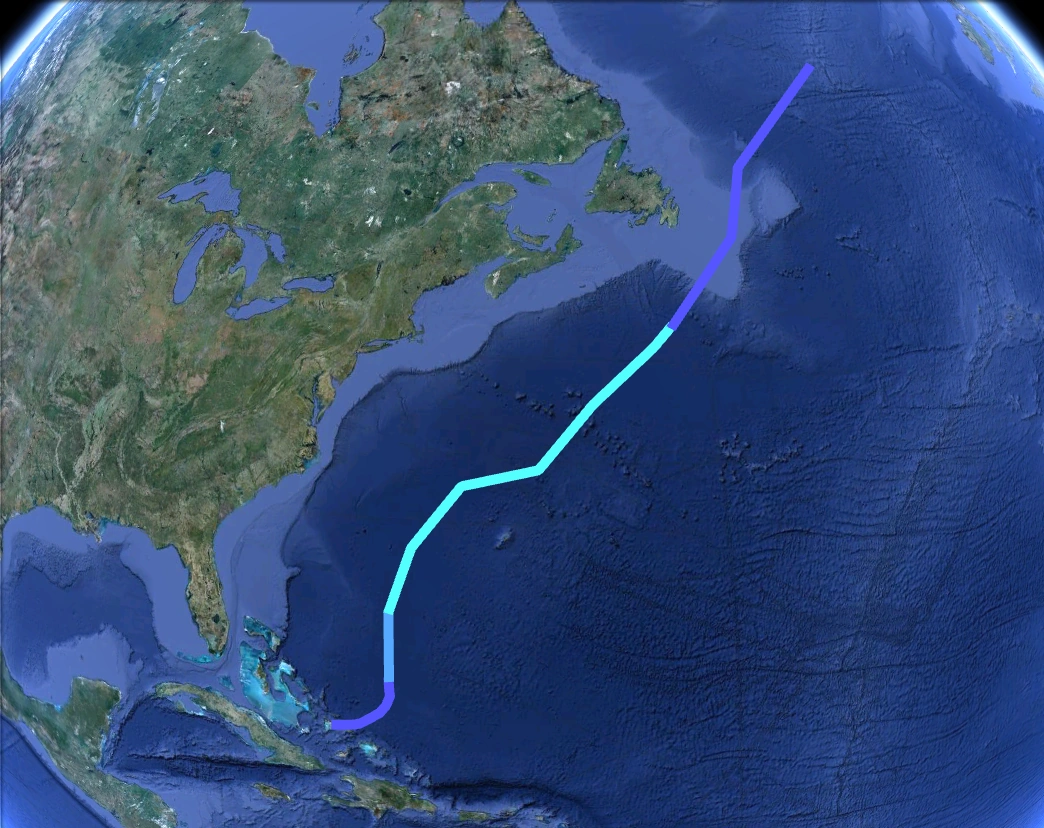
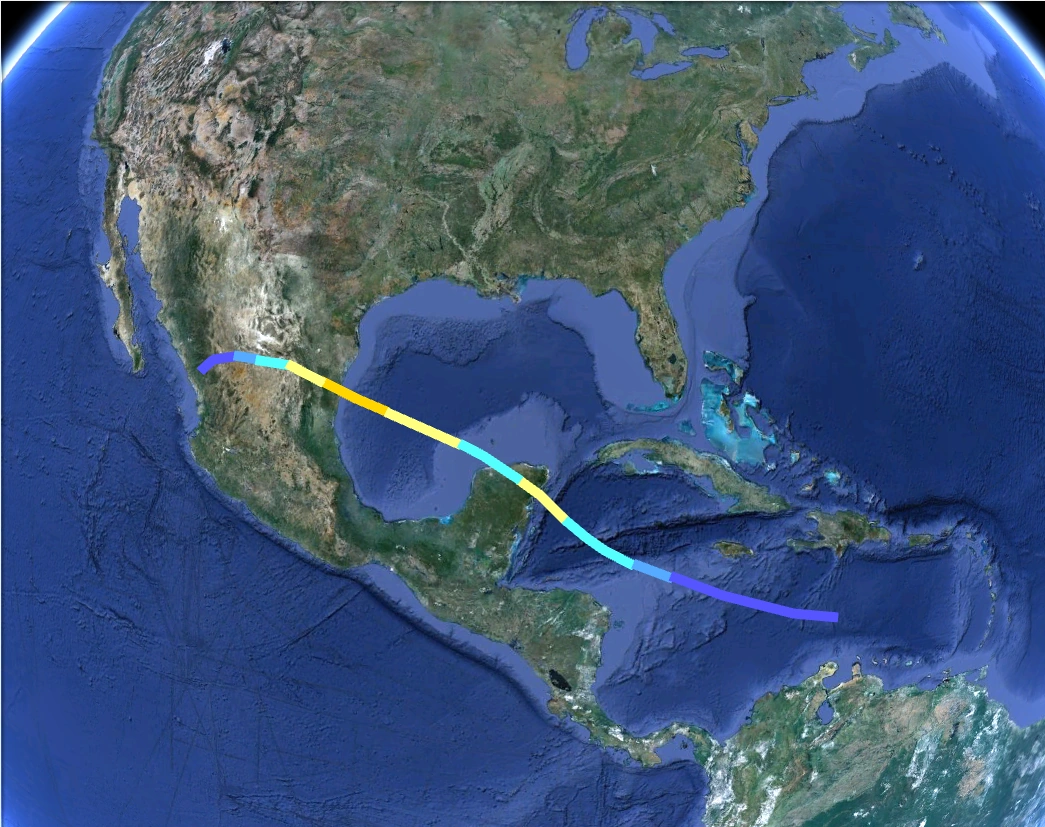
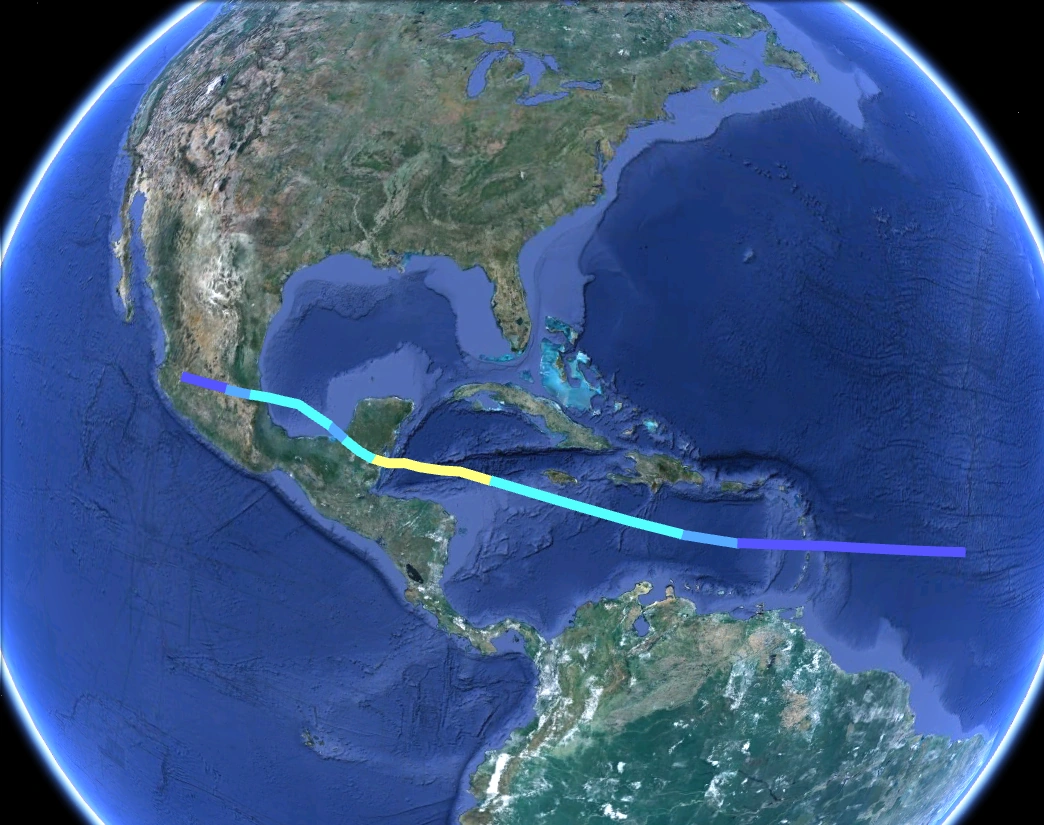
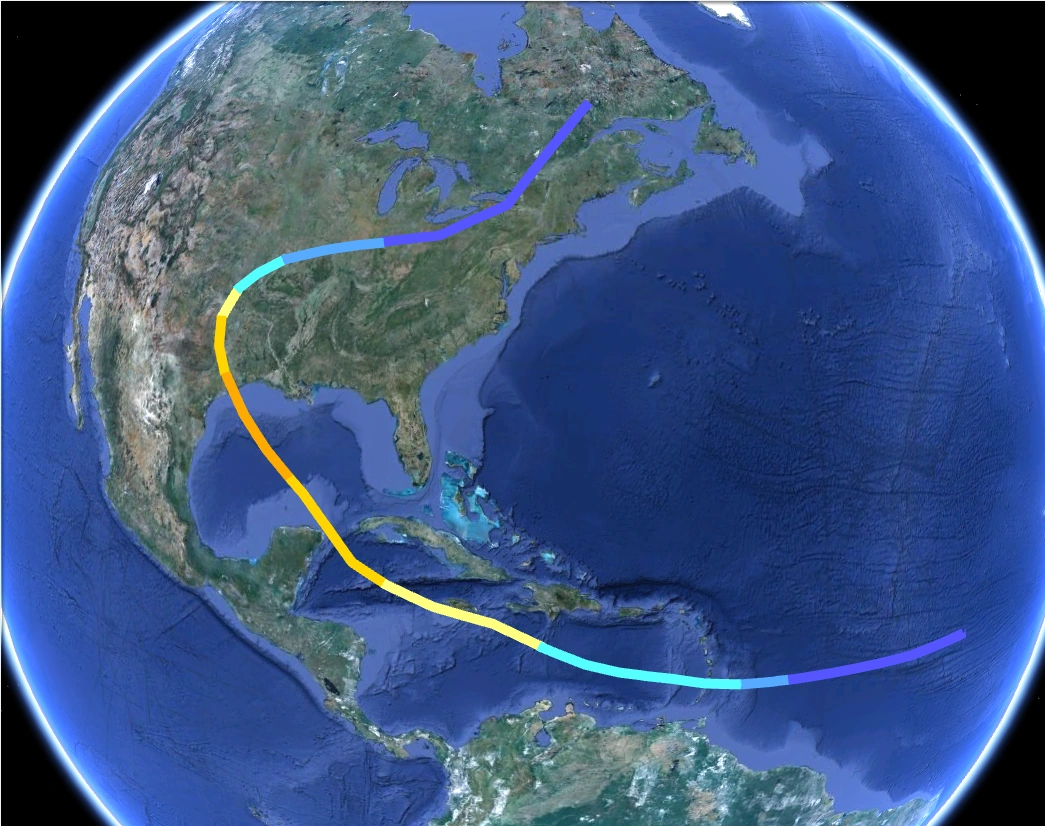
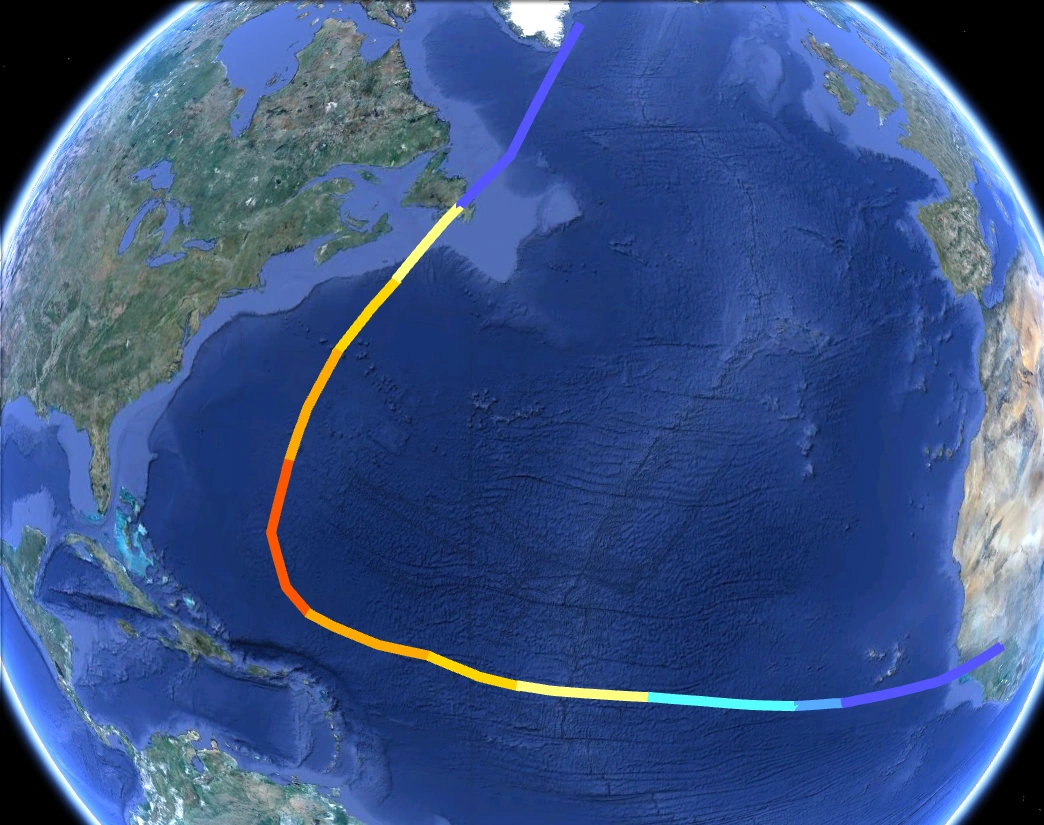
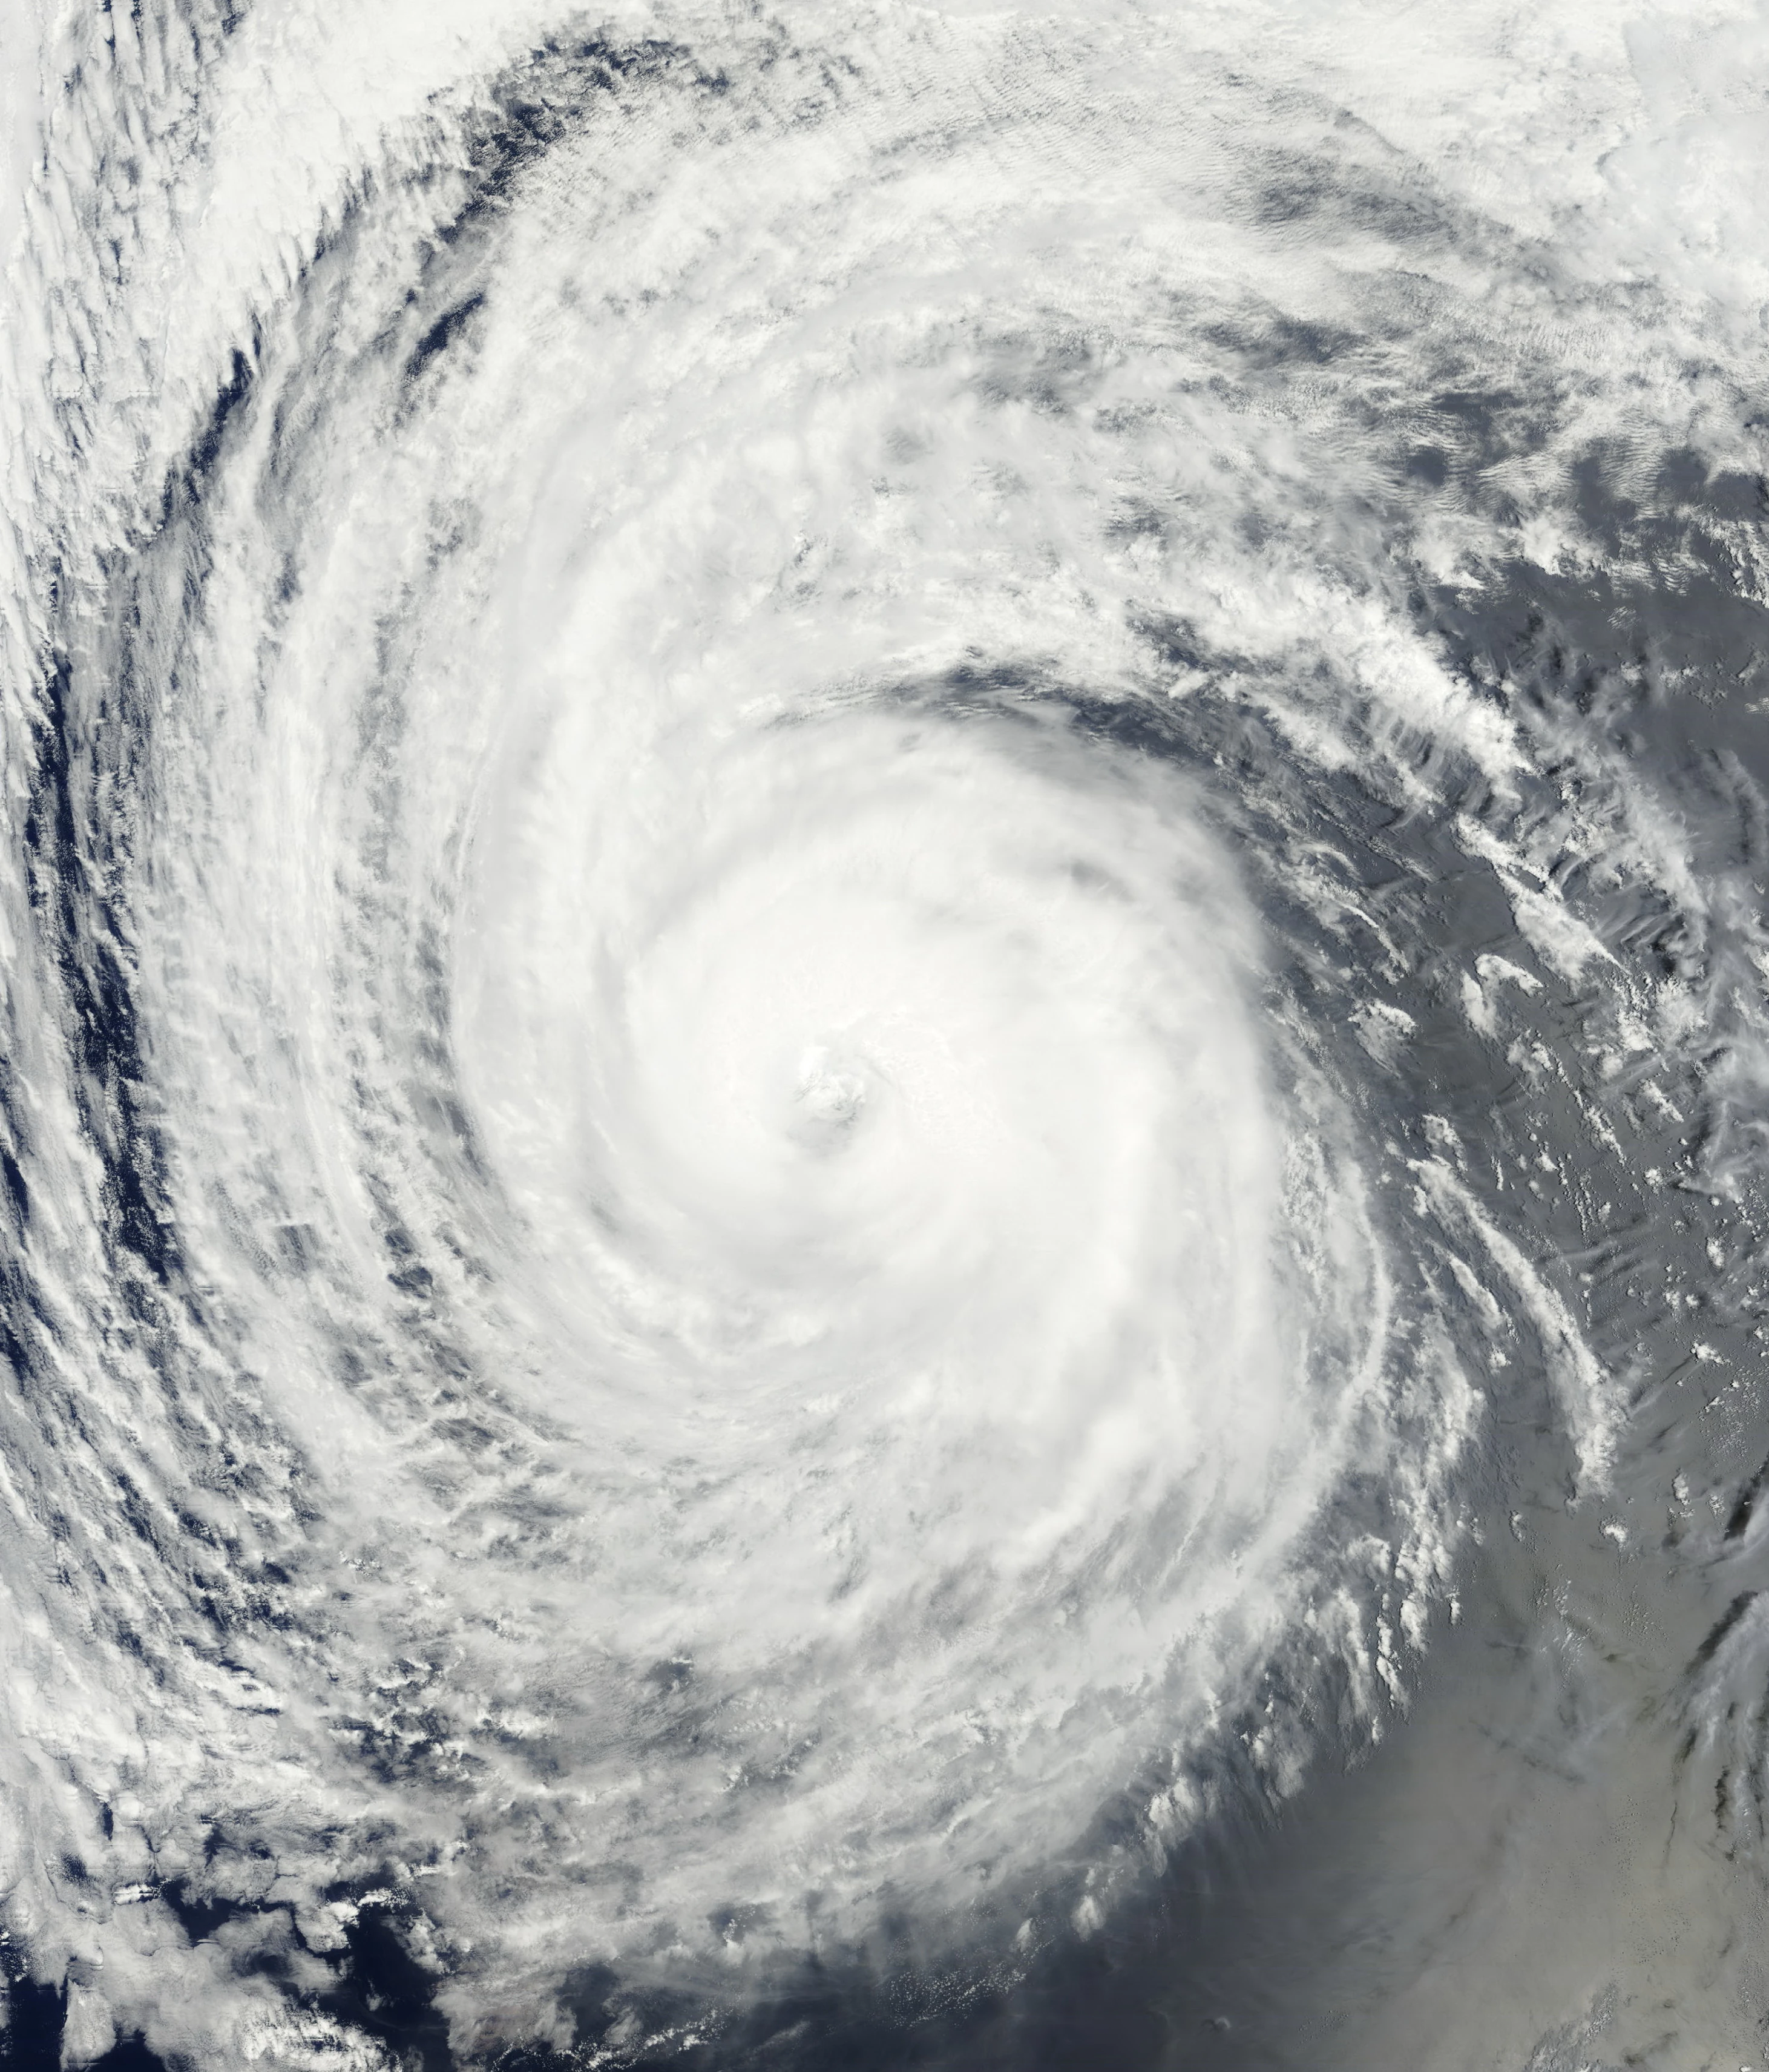
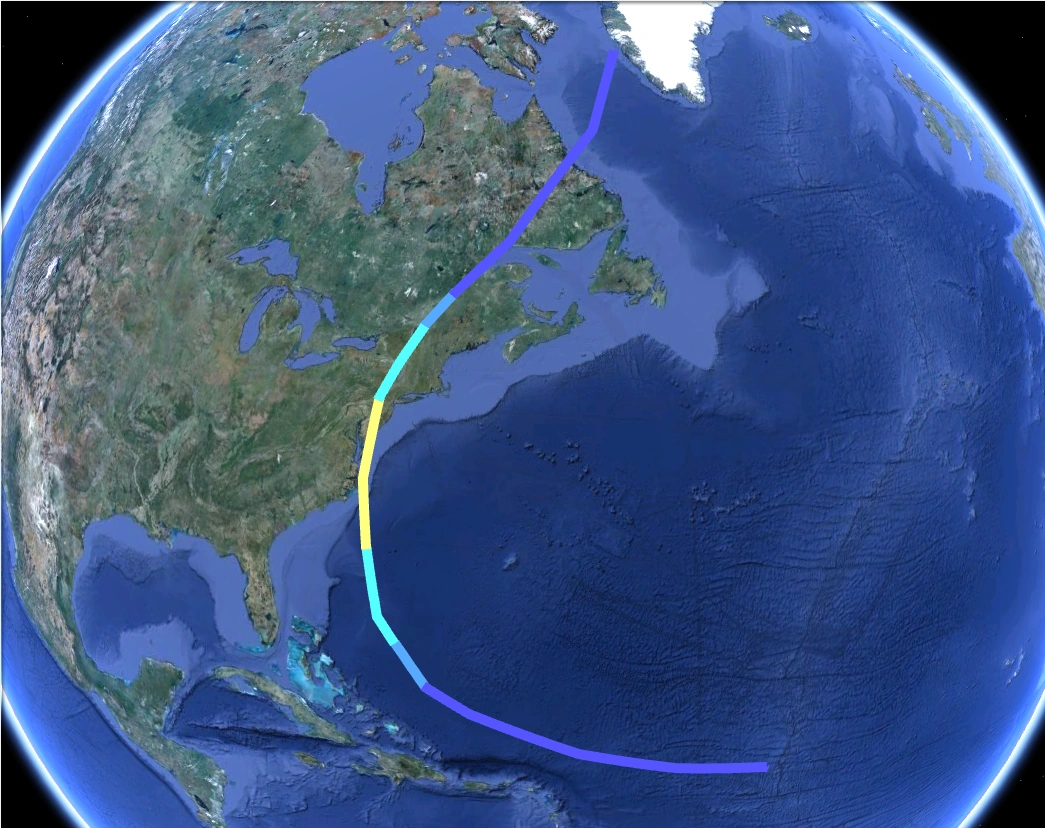
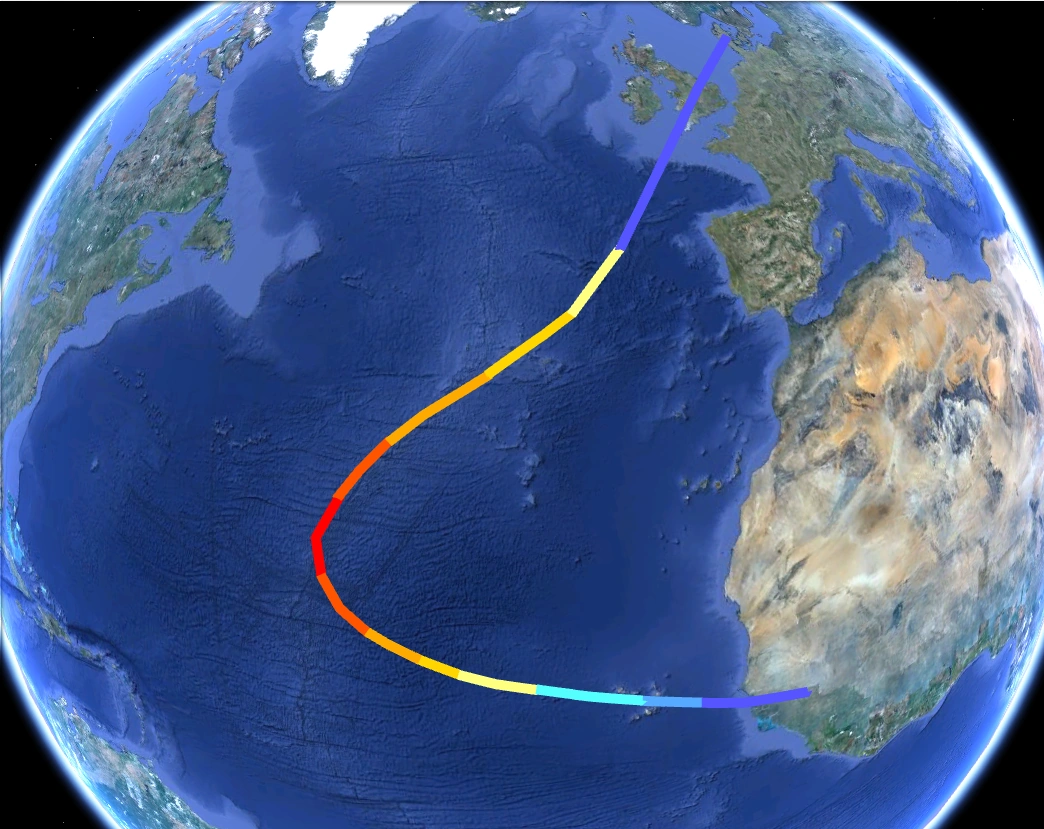
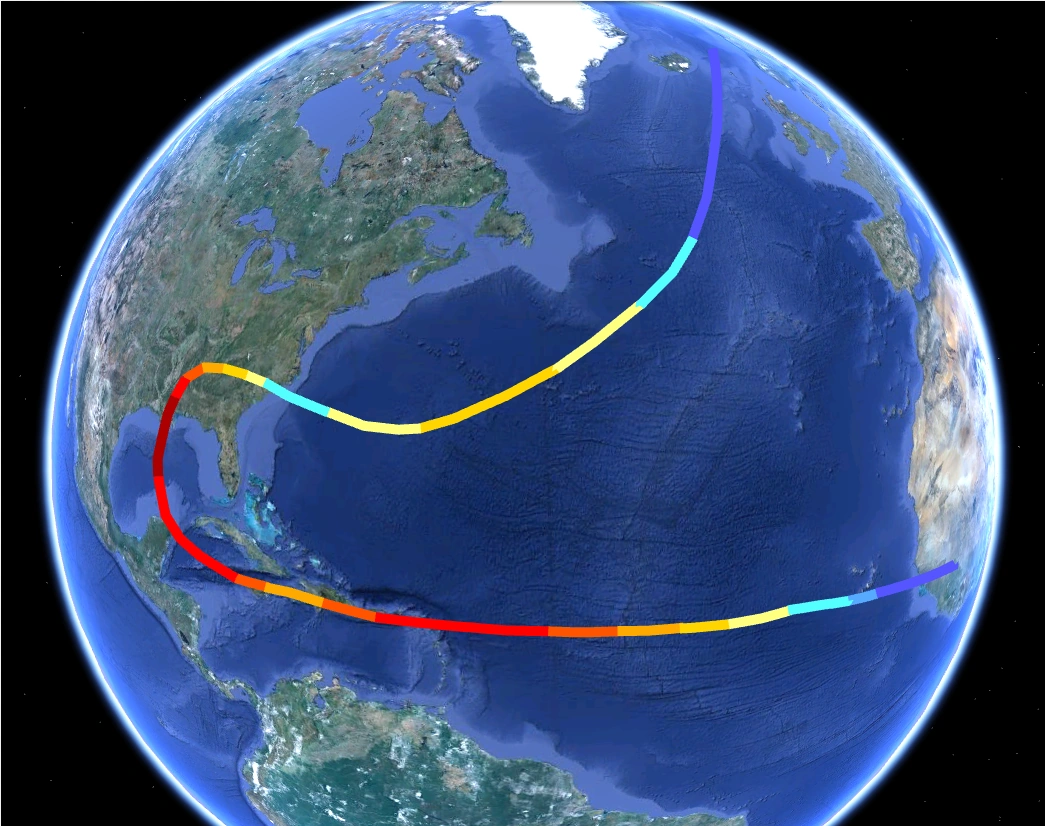
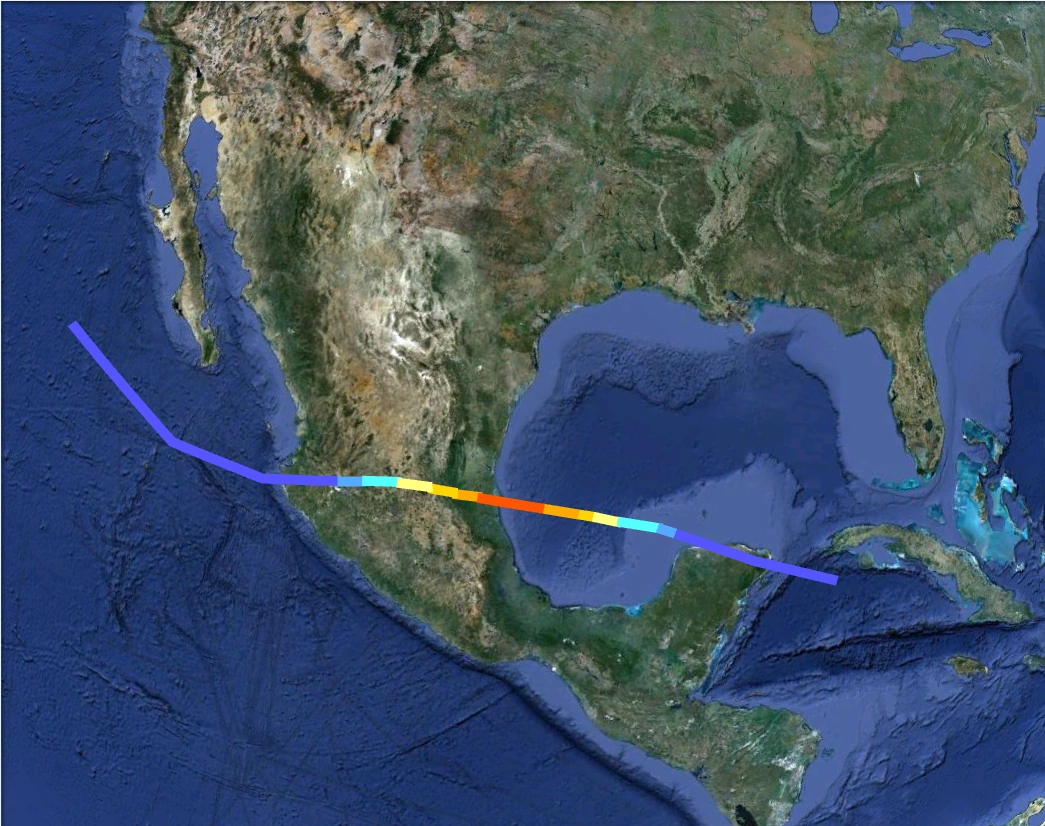
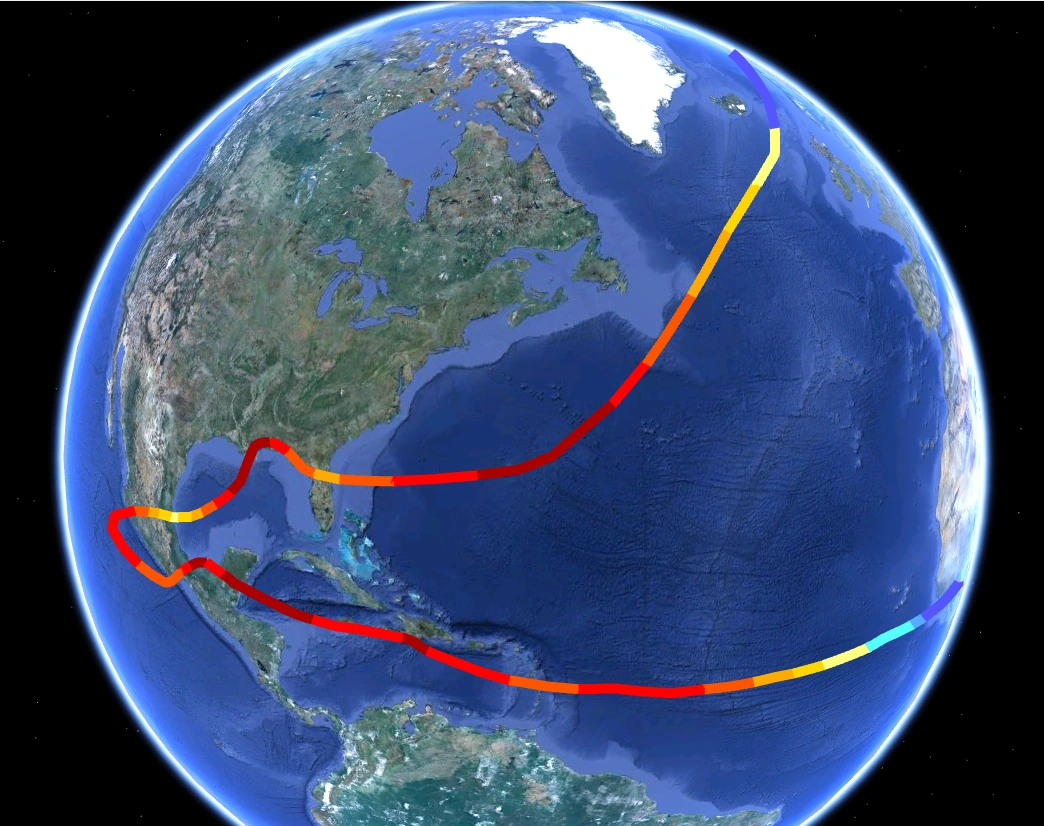
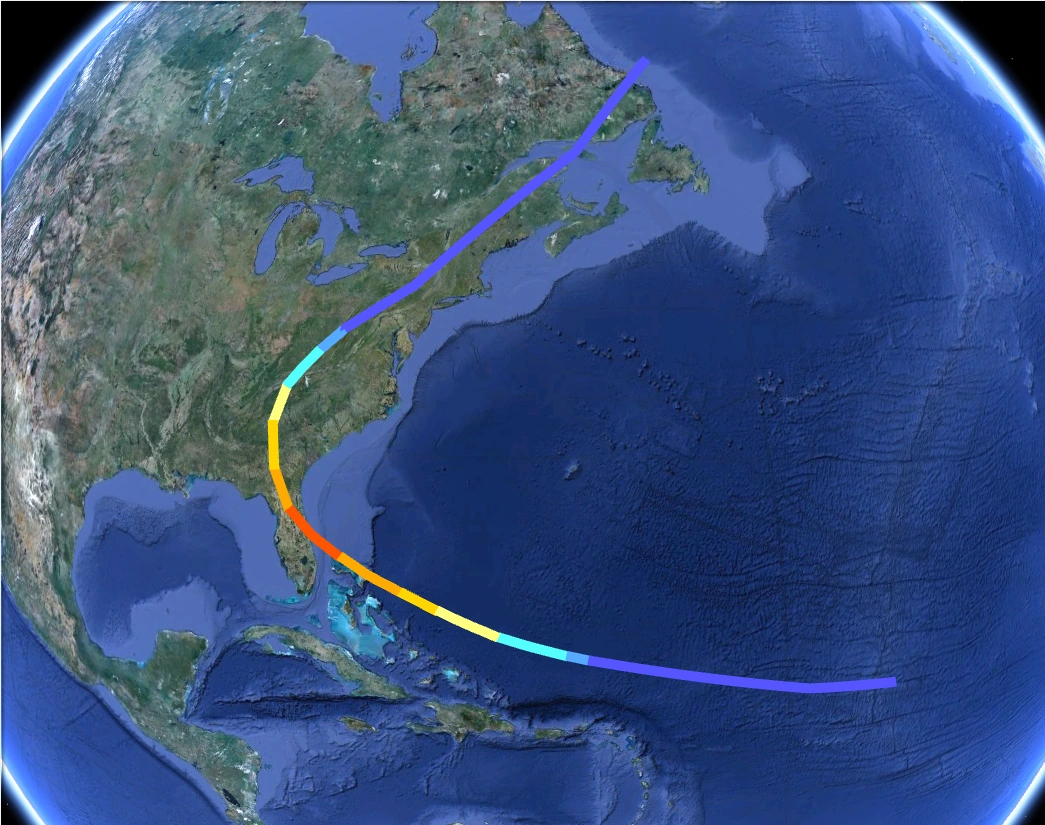
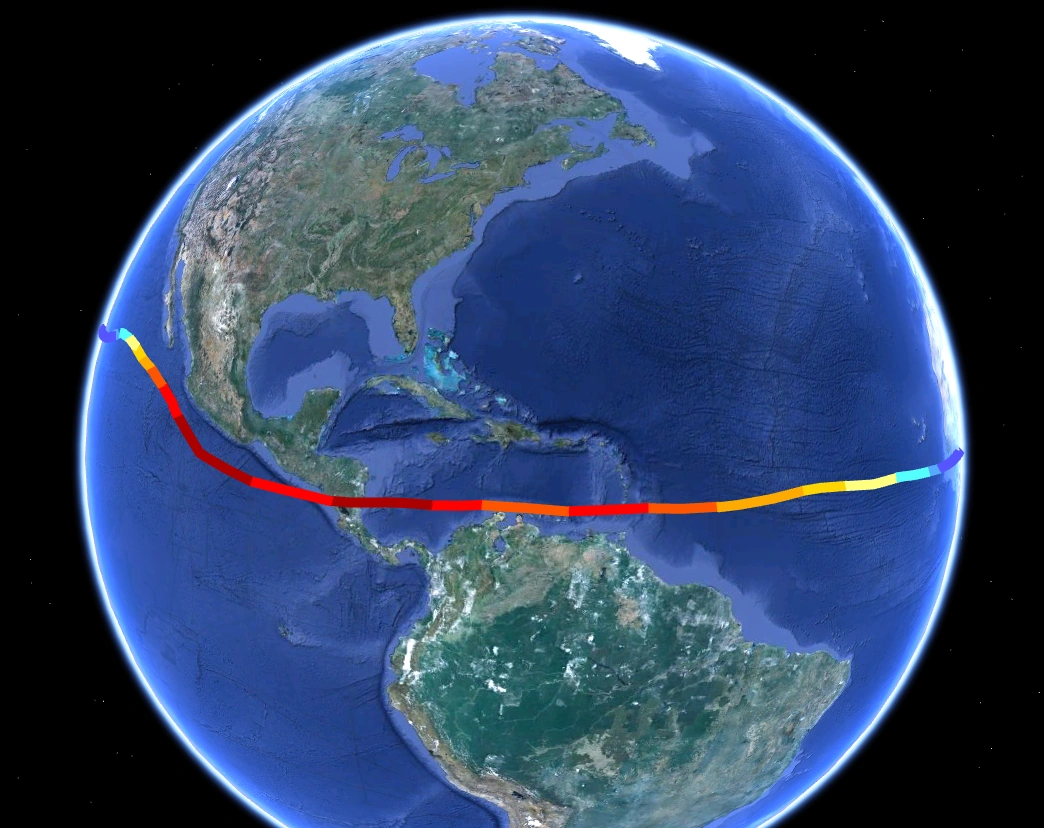
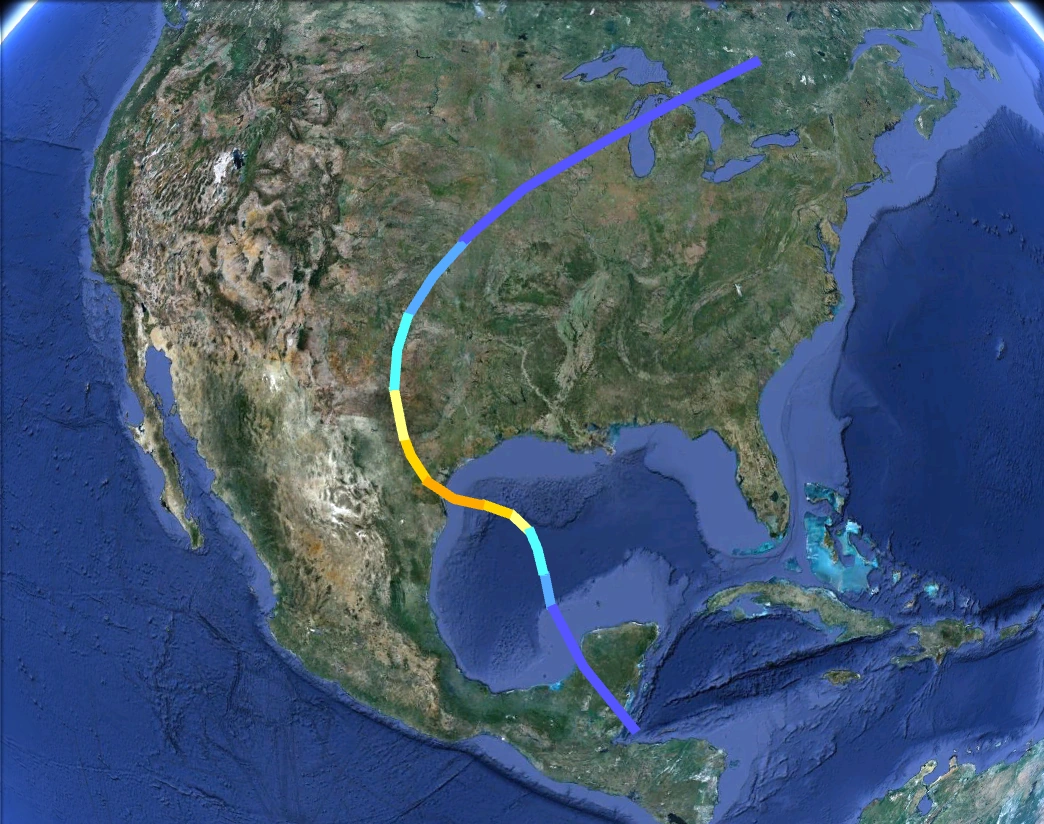
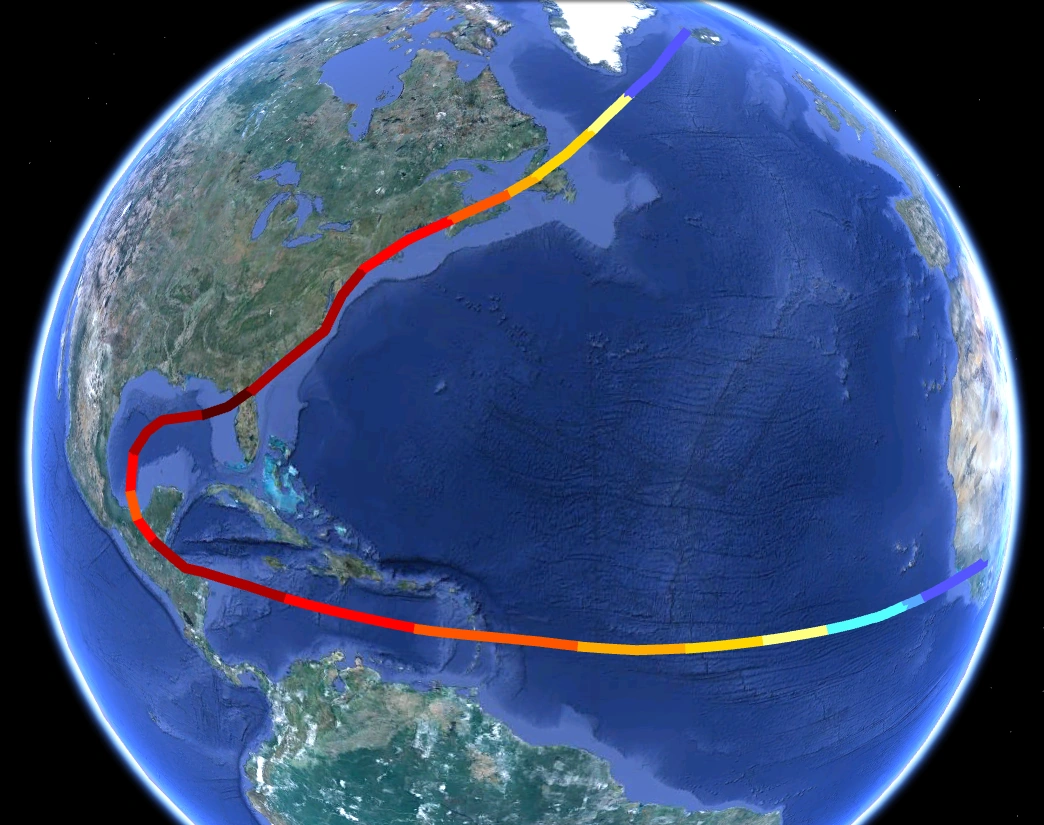
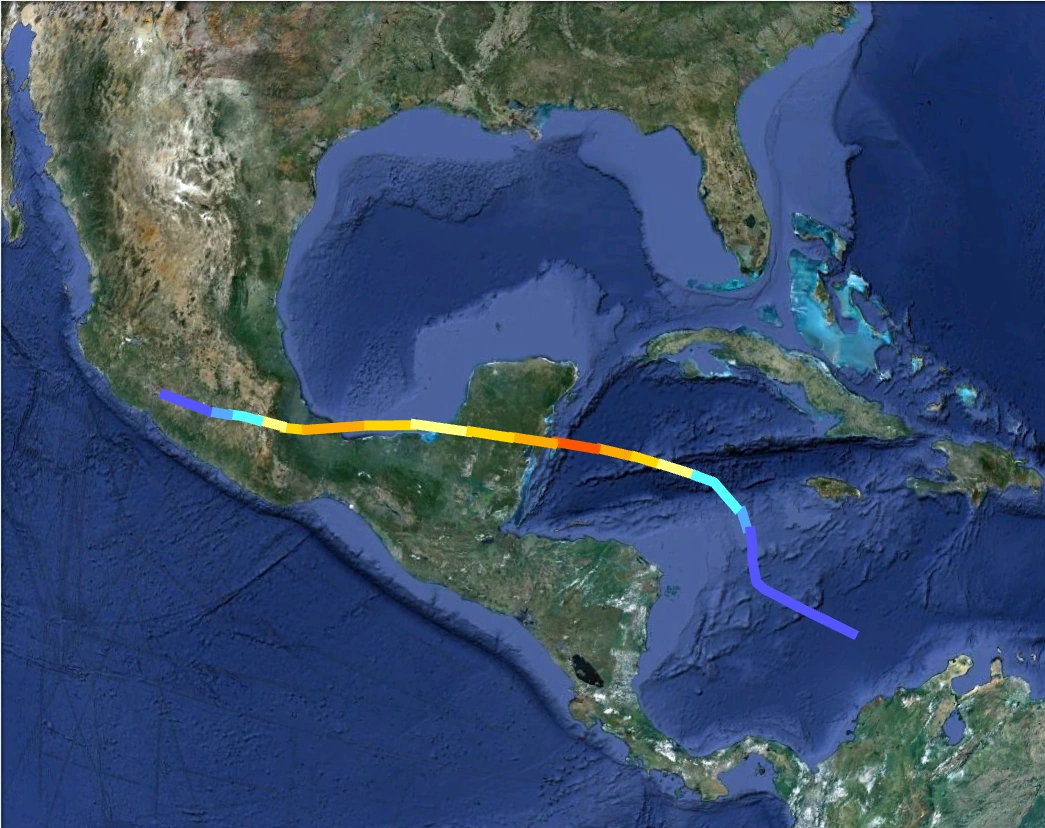
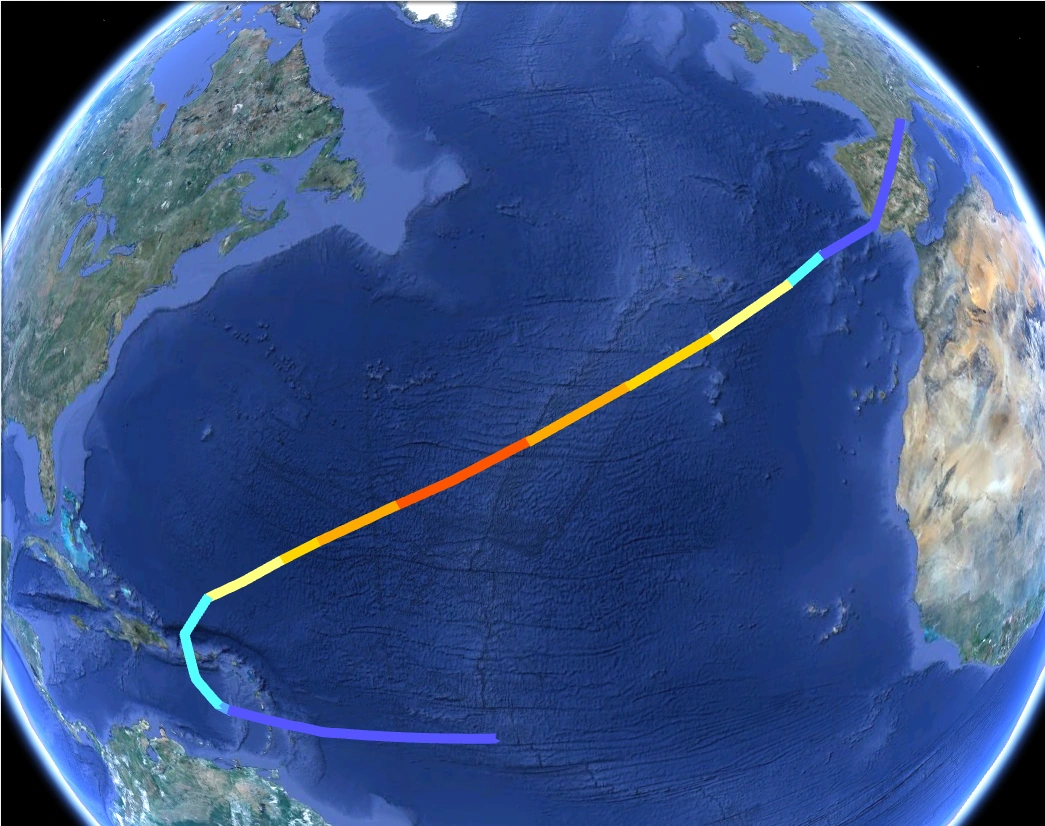
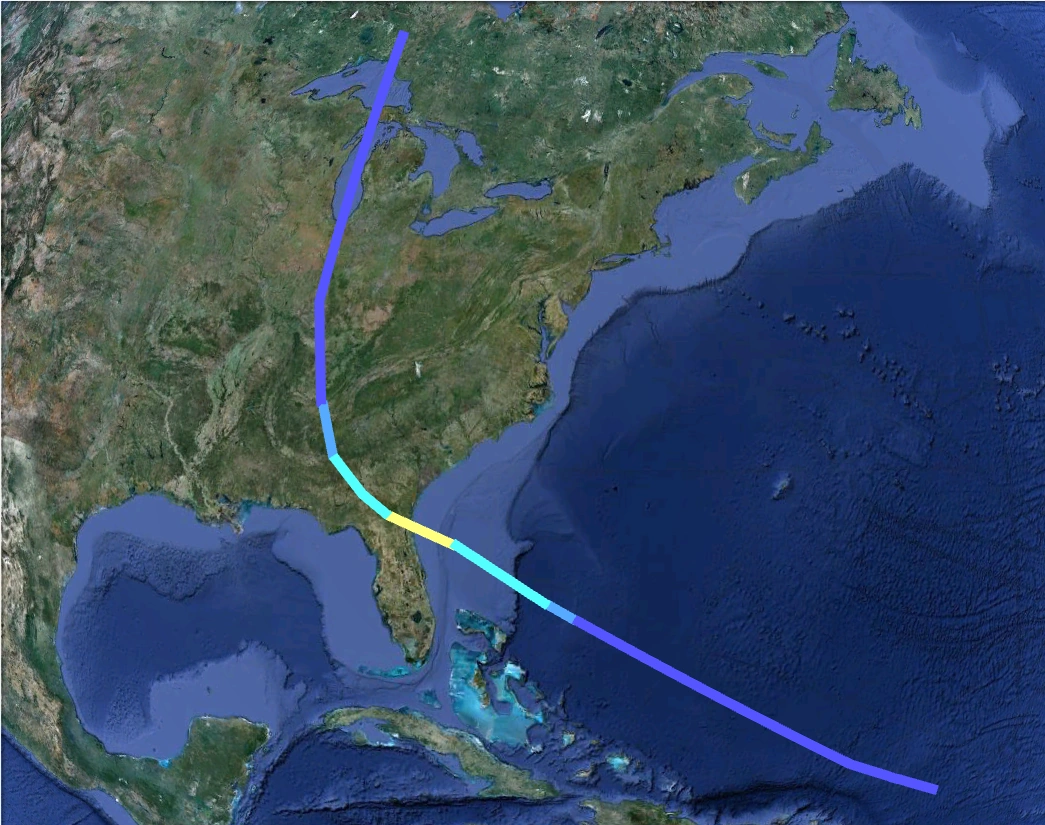
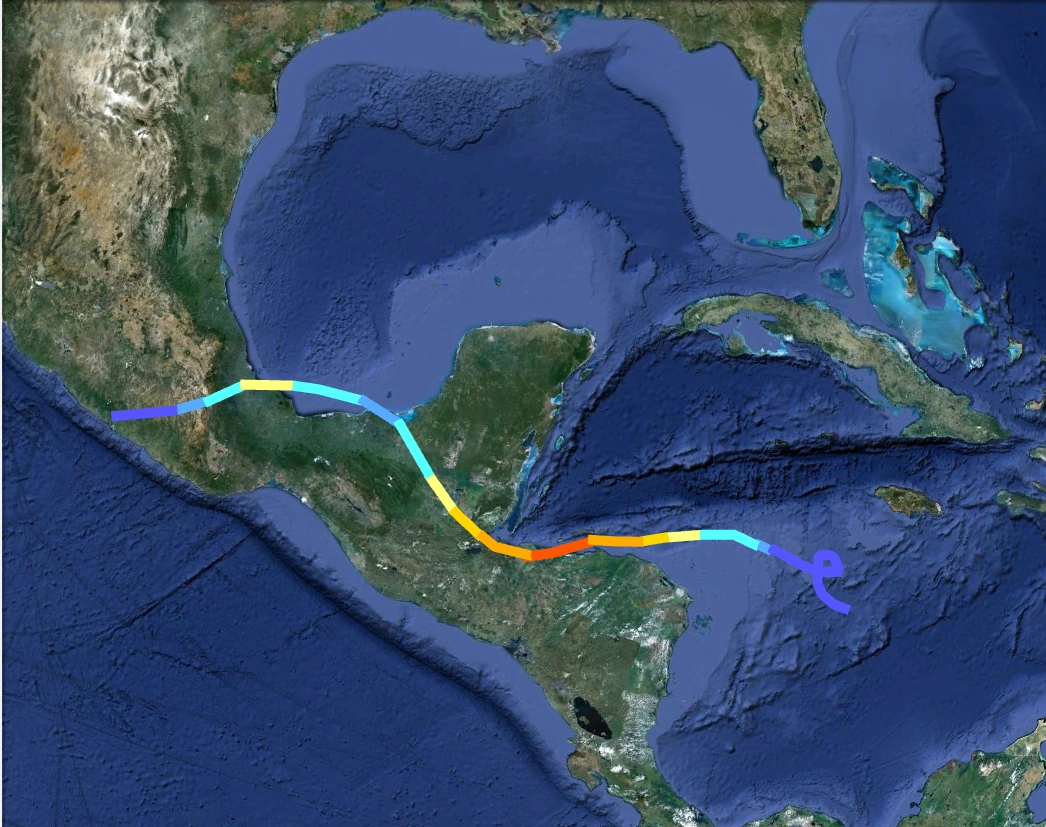
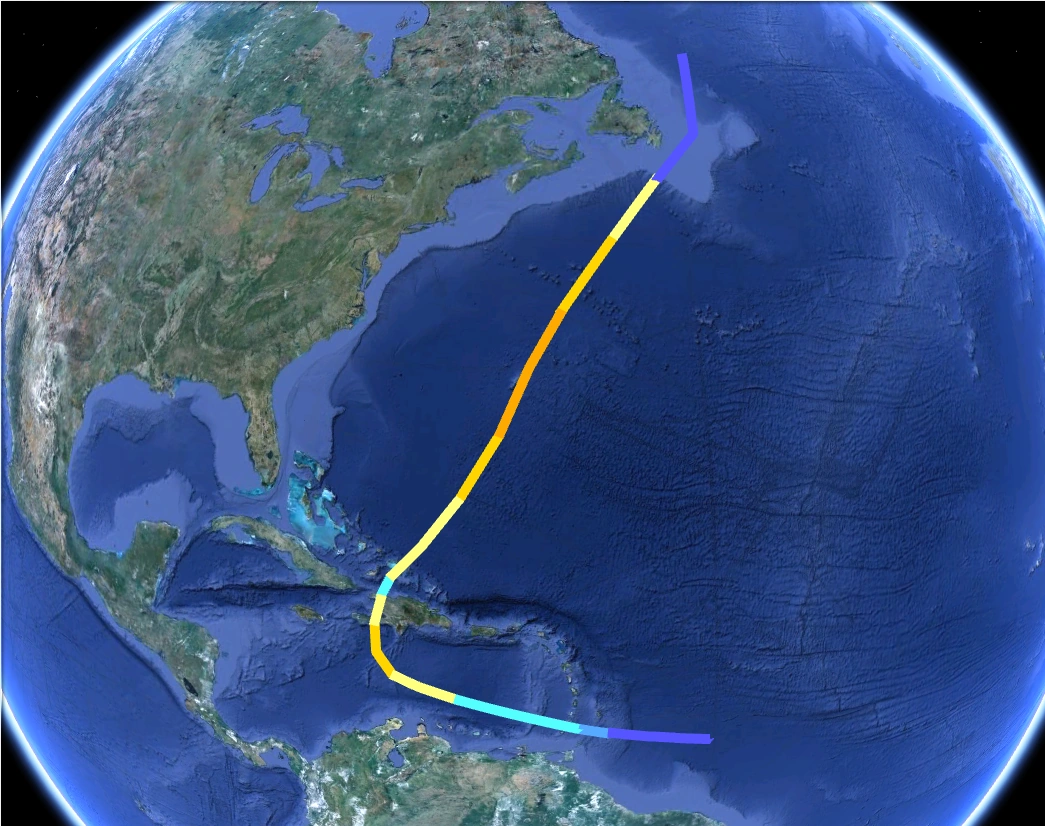
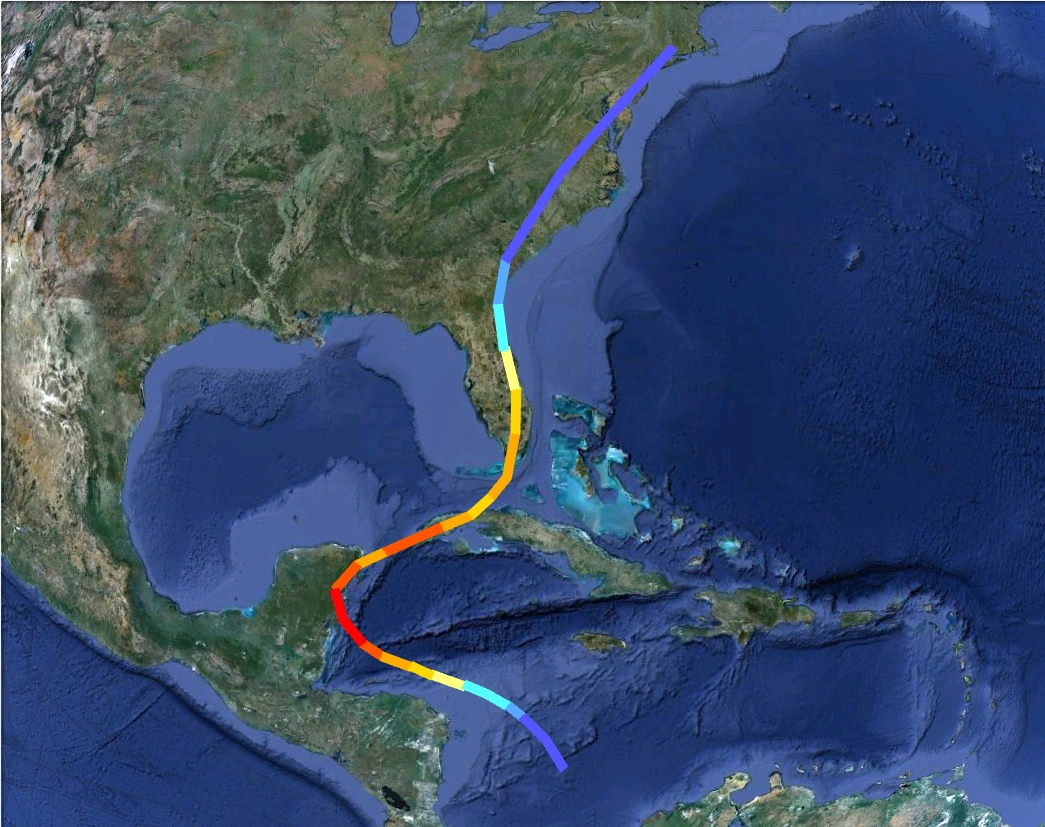
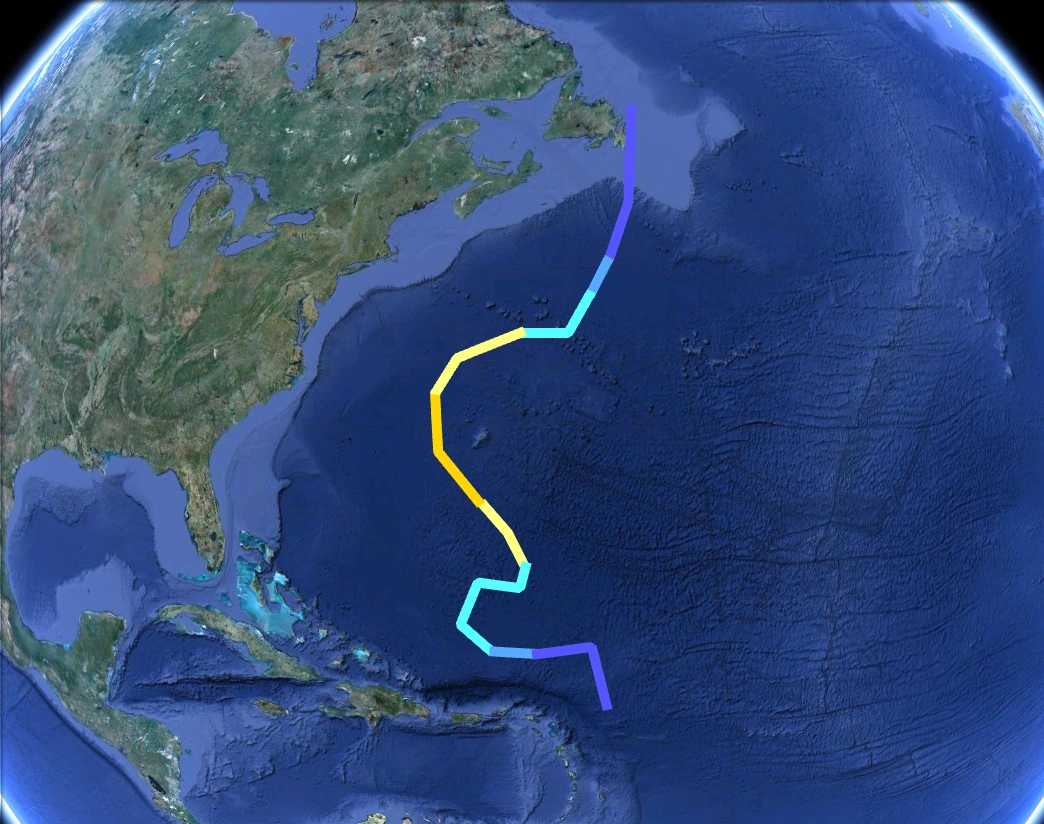
Struck the Windward Islands as a C4, Hispaniola, the Yucatán, and Southern Mexico as a C6, Central Mexico as a C5 from the Pacific side, the Gulf Coast as a C6, Florida as a C4, and Bermuda as a C6. It also absorbed Hurricane Walter while approaching Bermuda. Shary caused catastrophic devastation along its path, amounting to $420 billion in damage and 42,763 deaths. It was the most destructive and deadly storm in recorded history.
Hurricane Tom[]
| Category 3 hurricane (SSHWS) | |
  | |
| Duration | August 8 – August 13 |
|---|---|
| Peak intensity | 115 mph (185 km/h) (1-min) 966 mbar (hPa) |
Struck the Alabama/Florida Panhandle area as a C3. Tom caused $4.5 billion in damage and 32 deaths.
Hurricane Unala[]
| Category 4 hurricane (SSHWS) | |
  | |
| Duration | August 10 – August 17 |
|---|---|
| Peak intensity | 140 mph (220 km/h) (1-min) 942 mbar (hPa) |
Struck Florida as a C4. It dissipated in West Virginia. Unala caused $9.2 billion in damage and 39 deaths.
Hurricane Virginie[]
| Category 3 hurricane (SSHWS) | |
  | |
| Duration | August 14 – August 20 |
|---|---|
| Peak intensity | 125 mph (205 km/h) (1-min) 949 mbar (hPa) |
Affected the Yucatán as a C2 and Veracruz, Mexico as a C3. Virginie caused $305 million in damage and 253 deaths. Most of the deaths were caused by landslides and flooding.
Hurricane Walter[]
| Category 4 hurricane (SSHWS) | |
  | |
| Duration | August 15 – August 26 |
|---|---|
| Peak intensity | 145 mph (230 km/h) (1-min) 938 mbar (hPa) |
Passed close to the northern Lesser Antilles, peaked as a C4 over open waters, and was absorbed by Hurricane Shary between the east coast and Bermuda. It caused $53 million in damage and 14 deaths while going just north of the Lesser Antilles.
Hurricane Xavier[]
| Category 1 hurricane (SSHWS) | |
  | |
| Duration | August 19 – August 23 |
|---|---|
| Peak intensity | 90 mph (150 km/h) (1-min) 980 mbar (hPa) |
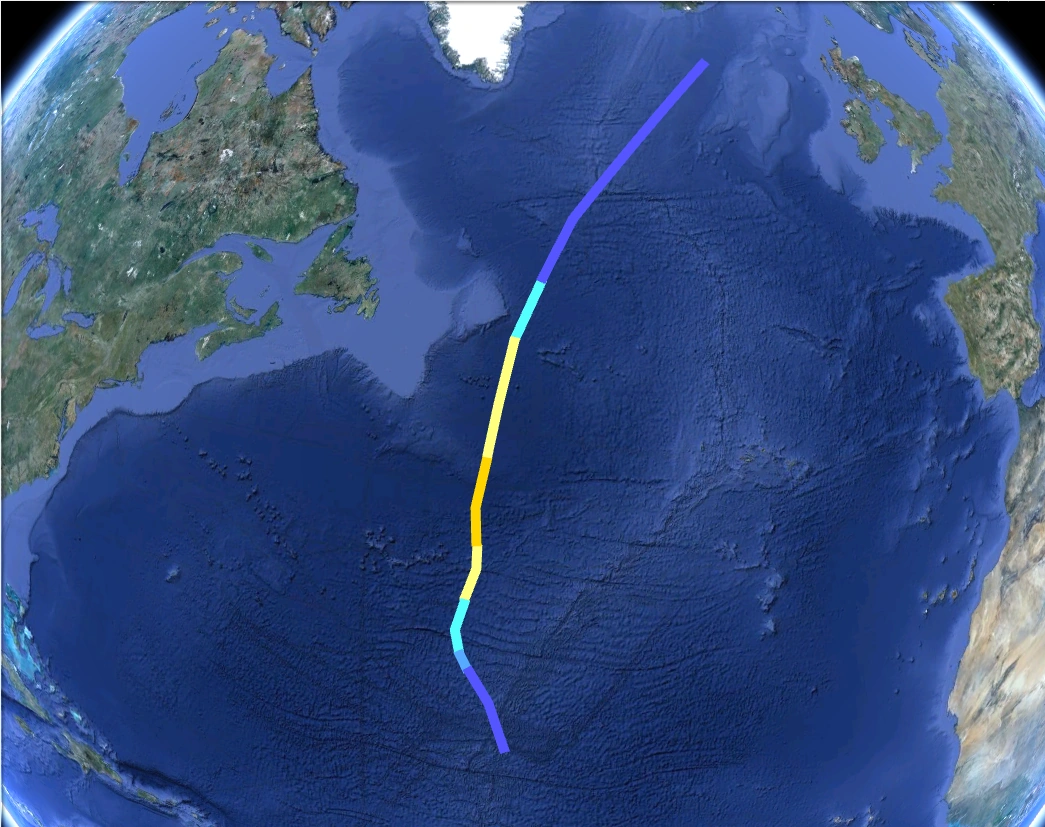
Peaked as a C1 over open waters and passed by the Azores as a TS. Its extratropical remnants eventually impacted the UK. Xavier caused minimal damage.
Hurricane Yolanda[]
| Category 2 hurricane (SSHWS) | |
  | |
| Duration | August 22 – August 27 |
|---|---|
| Peak intensity | 100 mph (155 km/h) (1-min) 974 mbar (hPa) |
Didn't affect land, and peaked as a C2 in open Atlantic waters.
Hurricane Zeke[]
| Category 5 hurricane (SSHWS) | |
  | |
| Duration | August 24 – September 1 |
|---|---|
| Peak intensity | 165 mph (270 km/h) (1-min) 916 mbar (hPa) |
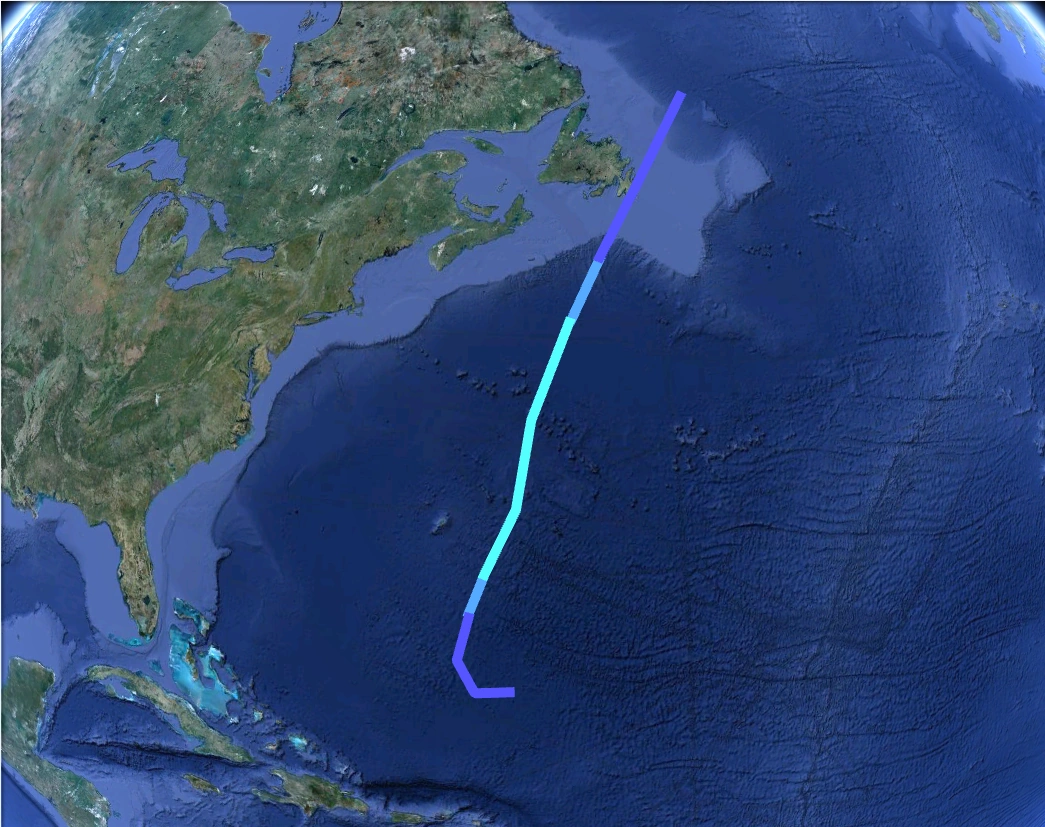
A Cape-Verde type hurricane that peaked as a C5 between Bermuda and the east coast. It also passed close to Newfoundland as a weakening C3. Zeke caused $75 million in damage and 21 deaths. Half of these deaths were due to high surf and rip currents.
Tropical Storm Alpha[]
| Tropical storm (SSHWS) | |
  | |
| Duration | August 27 – September 6 |
|---|---|
| Peak intensity | 70 mph (110 km/h) (1-min) 987 mbar (hPa) |
Impacted the northern Lesser Antilles, but dissipated due to wind shear. It later regenerated, and impacted the east coast. Alpha caused $24 million in damage and 3 deaths.
Hurricane Beta[]
| Category 3 hurricane (SSHWS) | |
  | |
| Duration | August 31 – September 7 |
|---|---|
| Peak intensity | 125 mph (205 km/h) (1-min) 948 mbar (hPa) |
Another Cape-Verde type hurricane that impacted the Cape Verde Islands as a TS and peaked as a C3 over open waters. It caused minimal damage.
Hurricane Gamma[]
| Category 6 hurricane | |
  | |
| Duration | September 3 – September 12 |
|---|---|
| Peak intensity | 210 mph (340 km/h) (1-min) 868 mbar (hPa) |
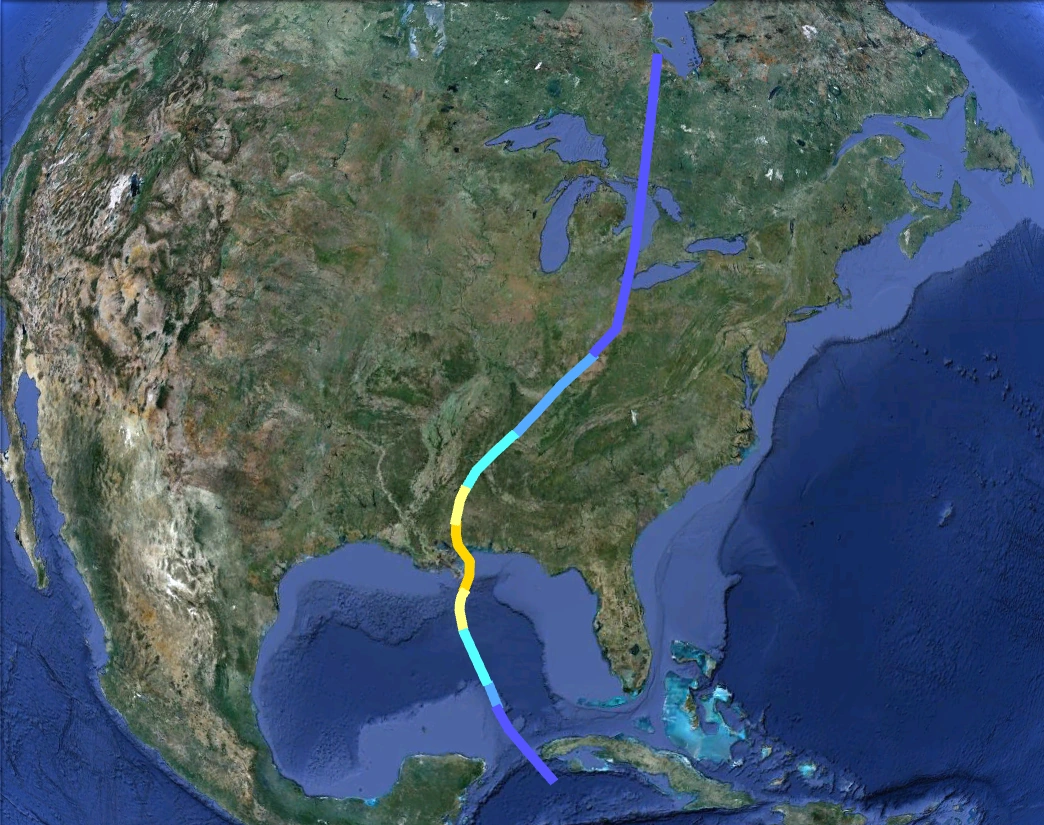
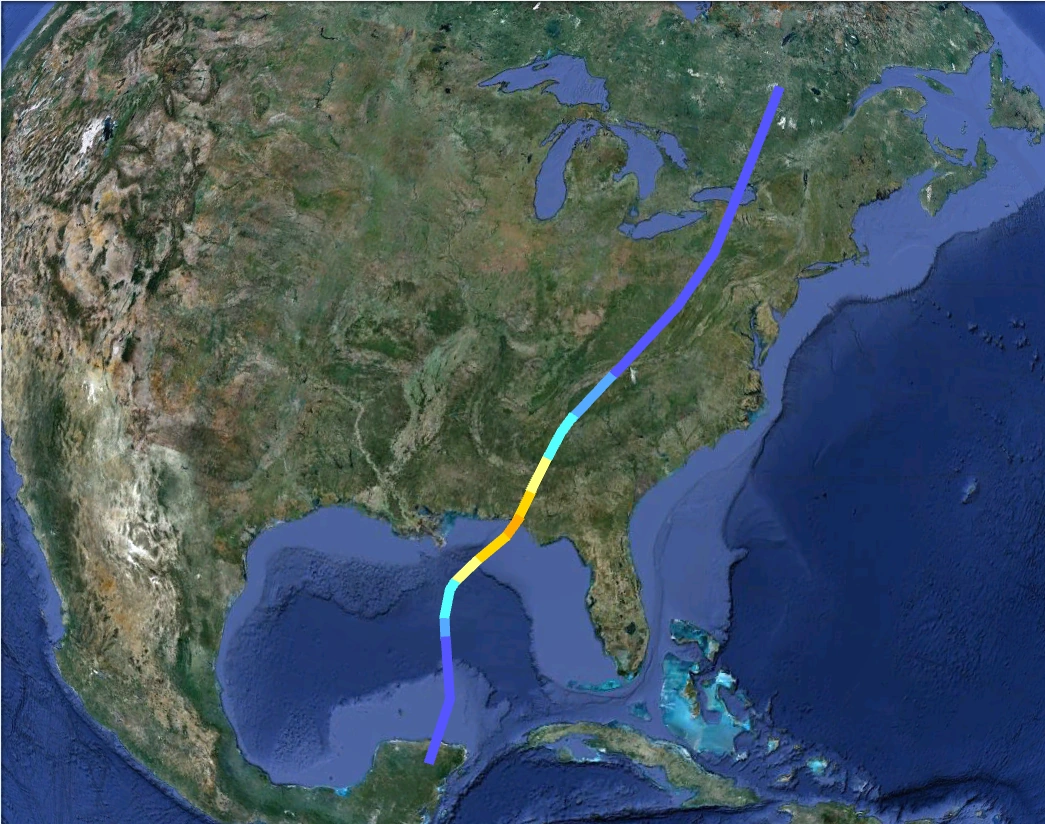
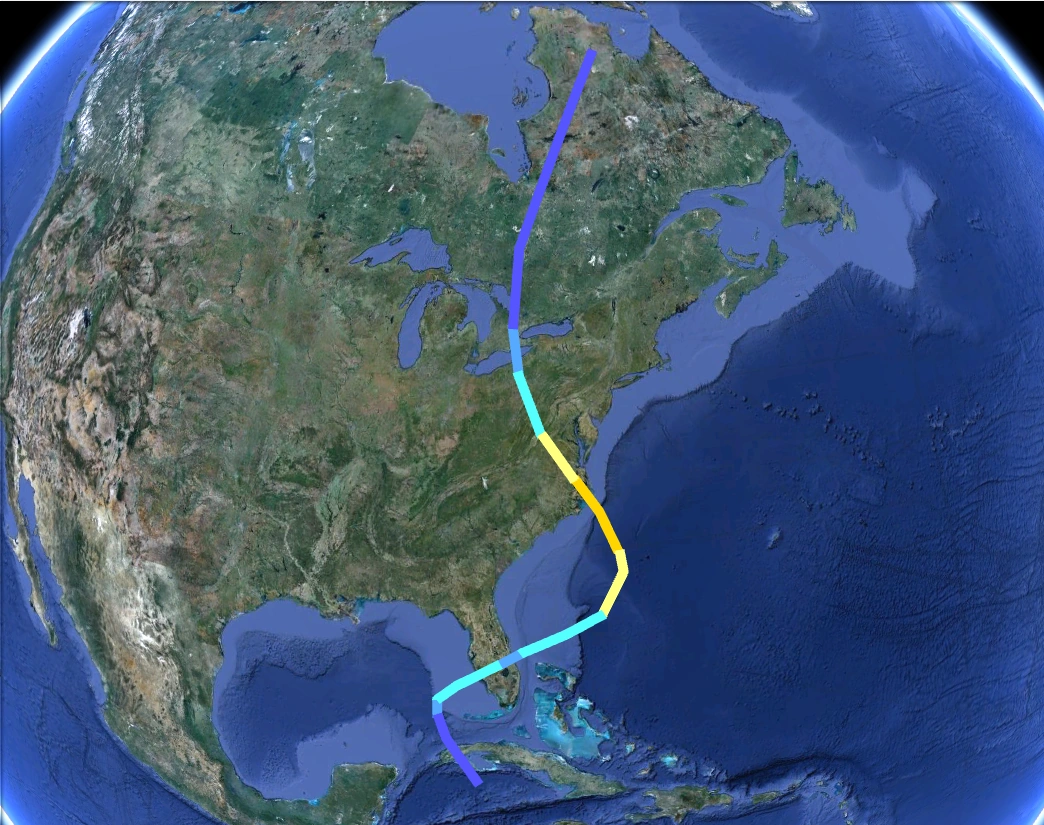
Formed in the Bahamas and impacted Florida as a TS. It later strengthened rapidly over the Gulf of Mexico and made landfall on Texas as a C6. It slowly weakened over land and dissipated while approaching Lake Michigan. Gamma caused massive devastation amounting to $195 billion in damage and 1,235 deaths.
Hurricane Delta[]
| Category 6 hurricane | |
  | |
| Duration | September 5 – September 16 (moved out of basin) |
|---|---|
| Peak intensity | 225 mph (360 km/h) (1-min) 850 mbar (hPa) |
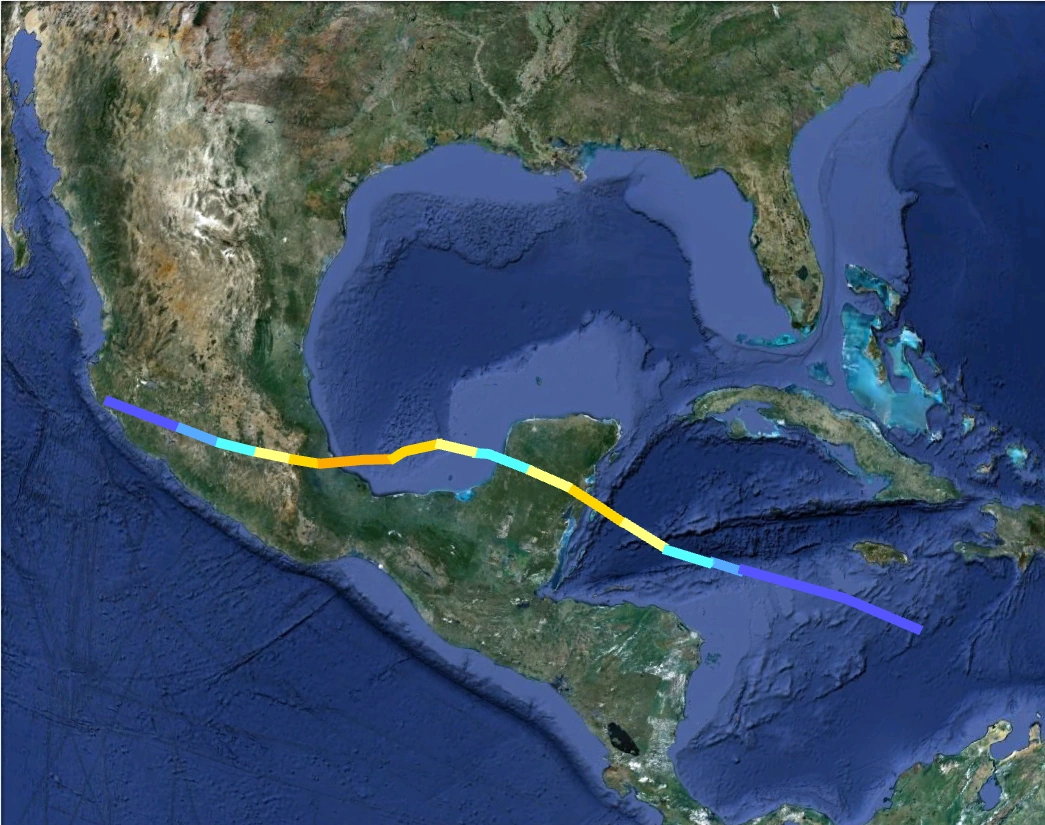
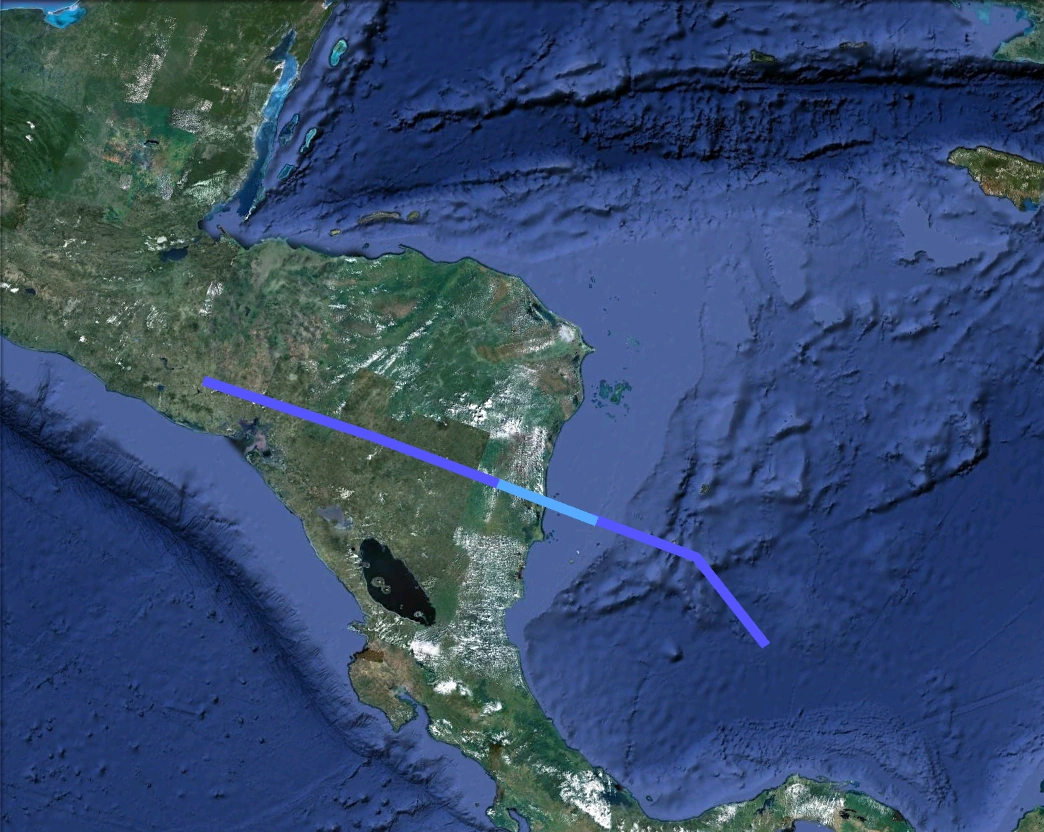
Affected the Windward Islands as a C5, Venezuela and Colombia as a C4, and Nicaragua as a C6. It later moved out into the Pacific. Delta caused $14 billion in damage. It also caused 27,628 deaths, mainly because of massive landslides and flash floods.
Hurricane Epsilon[]
| Category 5 hurricane (SSHWS) | |
  | |
| Duration | September 8 – September 17 |
|---|---|
| Peak intensity | 165 mph (270 km/h) (1-min) 916 mbar (hPa) |
A Cape-Verde type hurricane that didn't make landfall in any areas, but brought heavy rainfall to the Cape-Verde islands as a developing depression. It peaked as a C5 over open Atlantic waters.
Hurricane Zeta[]
| Category 2 hurricane (SSHWS) | |
  | |
| Duration | September 13 – September 19 |
|---|---|
| Peak intensity | 110 mph (175 km/h) (1-min) 965 mbar (hPa) |
Didn't made a landfall, and peaked as a C2 over open Atlantic waters. It did, however, affect the Cape Verdes as a tropical wave.
Hurricane Eta[]
| Category 4 hurricane (SSHWS) | |
  | |
| Duration | September 16 – September 25 |
|---|---|
| Peak intensity | 155 mph (250 km/h) (1-min) 930 mbar (hPa) |
Affected the Lesser Antilles as a TS, Puerto Rico and Hispaniola as a C1, the Bahamas as a C2/C3, and made a landfall in the Carolinas as a C4. It moved along the east coast before dissipating in Atlantic Canada. Eta caused $14 billion in damage and 153 deaths.
Hurricane Theta[]
| Category 5 hurricane (SSHWS) | |
  | |
| Duration | September 20 – September 28 |
|---|---|
| Peak intensity | 170 mph (275 km/h) (1-min) 912 mbar (hPa) |
Affected Jamaica as a TS, western Cuba as a C2, and the Texas-Louisiana area as a C5. Theta caused $41 billion in damage and 637 deaths.
Hurricane Iota[]
| Category 5 hurricane (SSHWS) | |
  | |
| Duration | September 21 – October 2 |
|---|---|
| Peak intensity | 160 mph (260 km/h) (1-min) 921 mbar (hPa) |
A Cape-Verde type hurricane that peaked as a C5 southeast of Bermuda. It passed near Bermuda as a C5/C4 and Newfoundland as a C1. Iota caused minimal damage.
Hurricane Kappa[]
| Category 3 hurricane (SSHWS) | |
  | |
| Duration | September 24 – September 30 |
|---|---|
| Peak intensity | 120 mph (195 km/h) (1-min) 956 mbar (hPa) |
Formed in the Gulf of Mexico and impacted Texas as a C3. It dissipated in Kansas. It affected areas still recovering from Hurricane Gamma when it hit in early September. Kappa caused $6.1 billion in damage and 32 deaths.
Hurricane Lambda[]
| Category 1 hurricane (SSHWS) | |
  | |
| Duration | September 27 – October 1 |
|---|---|
| Peak intensity | 85 mph (140 km/h) (1-min) 979 mbar (hPa) |
Peaked as a C1 in the far eastern Atlantic. It passed just west of the Canary Islands as a C1 and made landfall on Spain as a TD. It caused minimal damage. Lambda was one of the easternmost hurricanes on record.
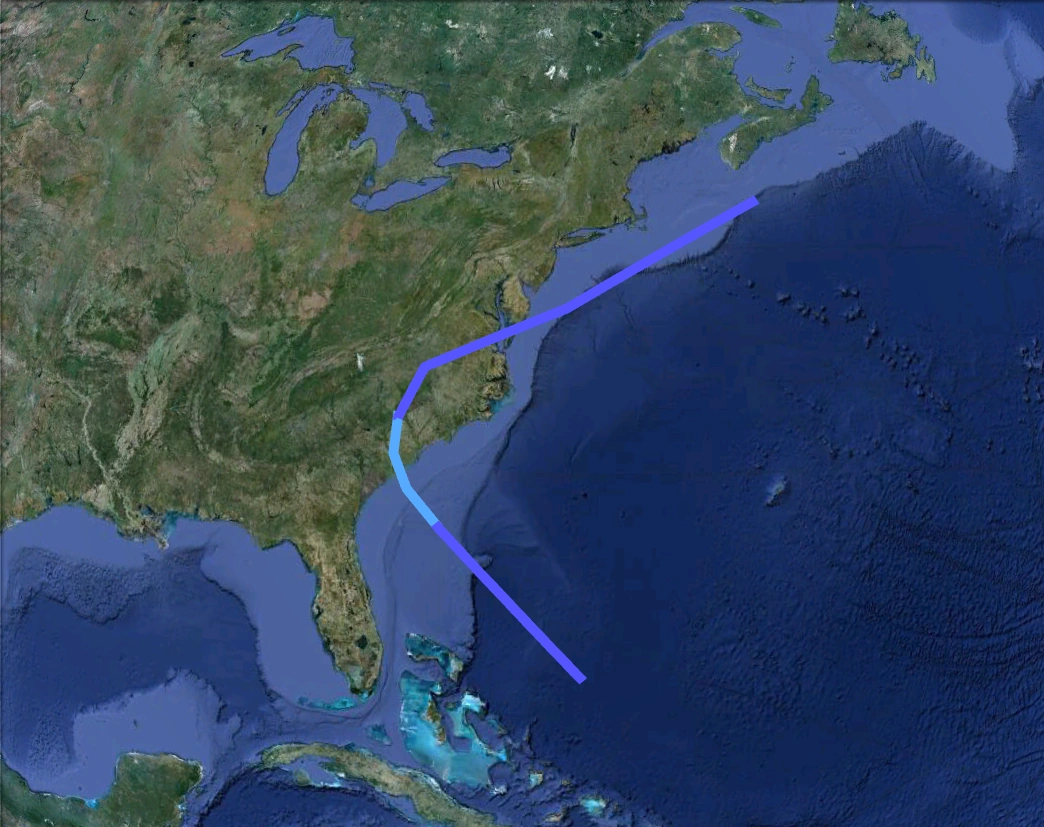
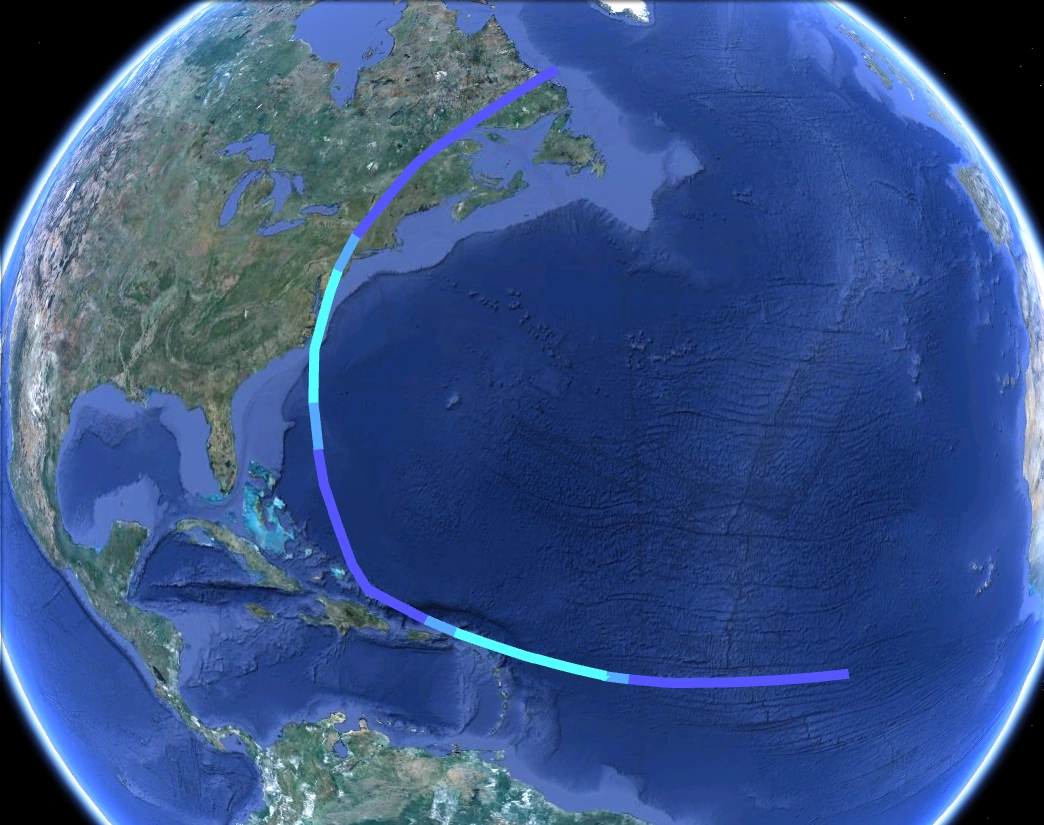
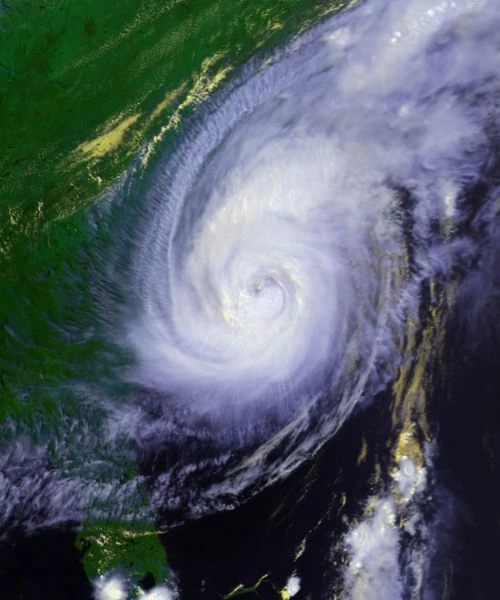
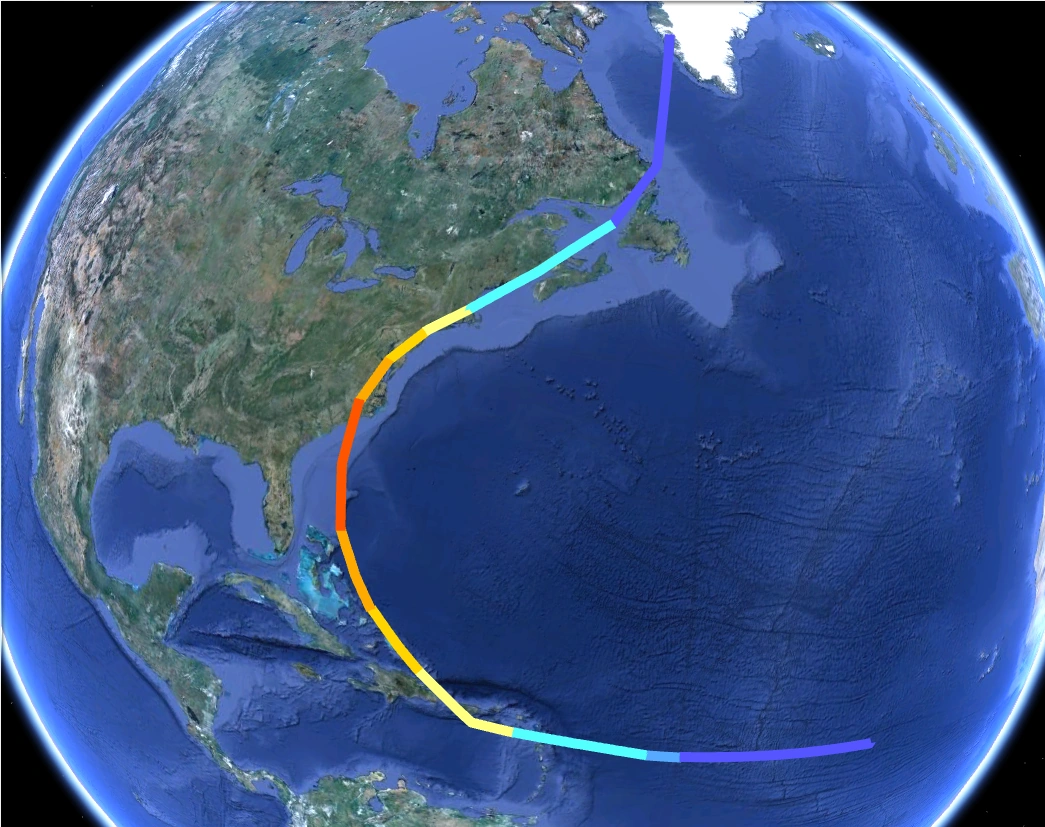
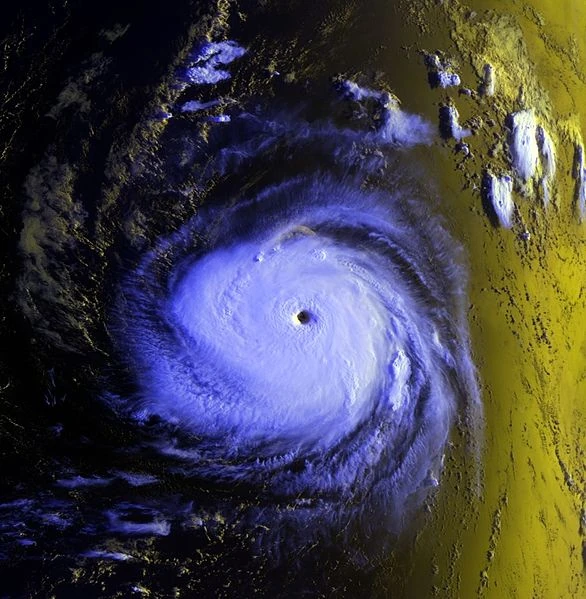
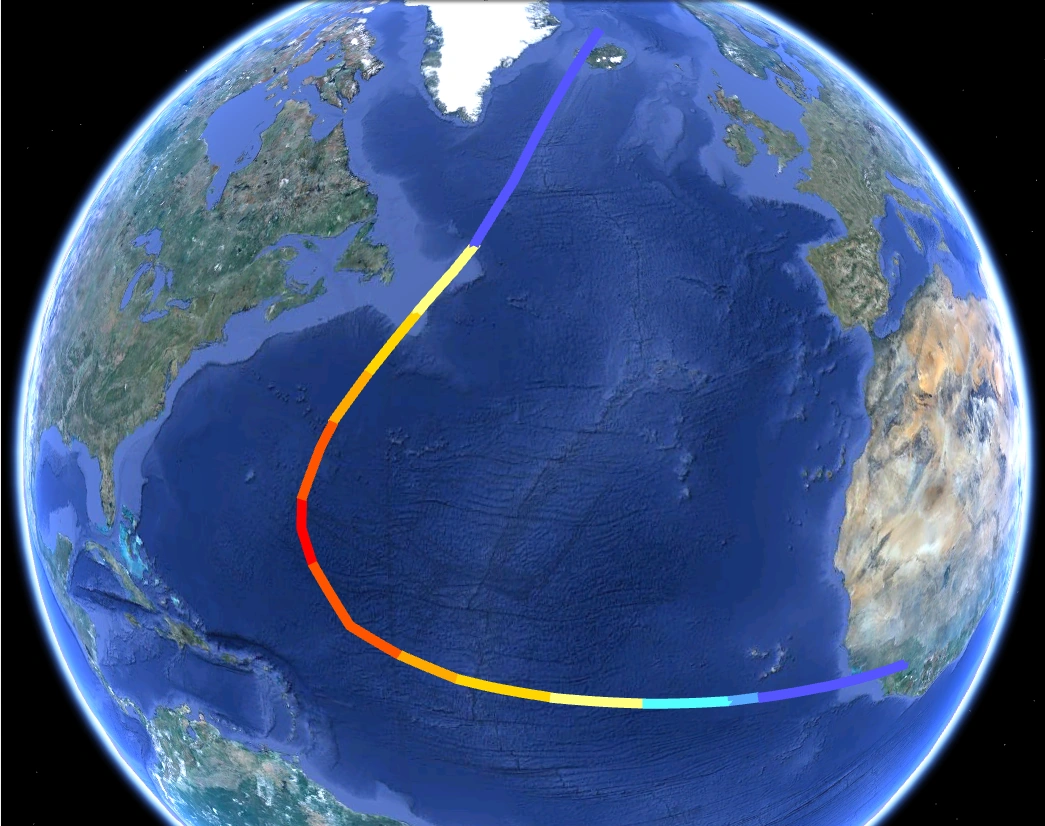
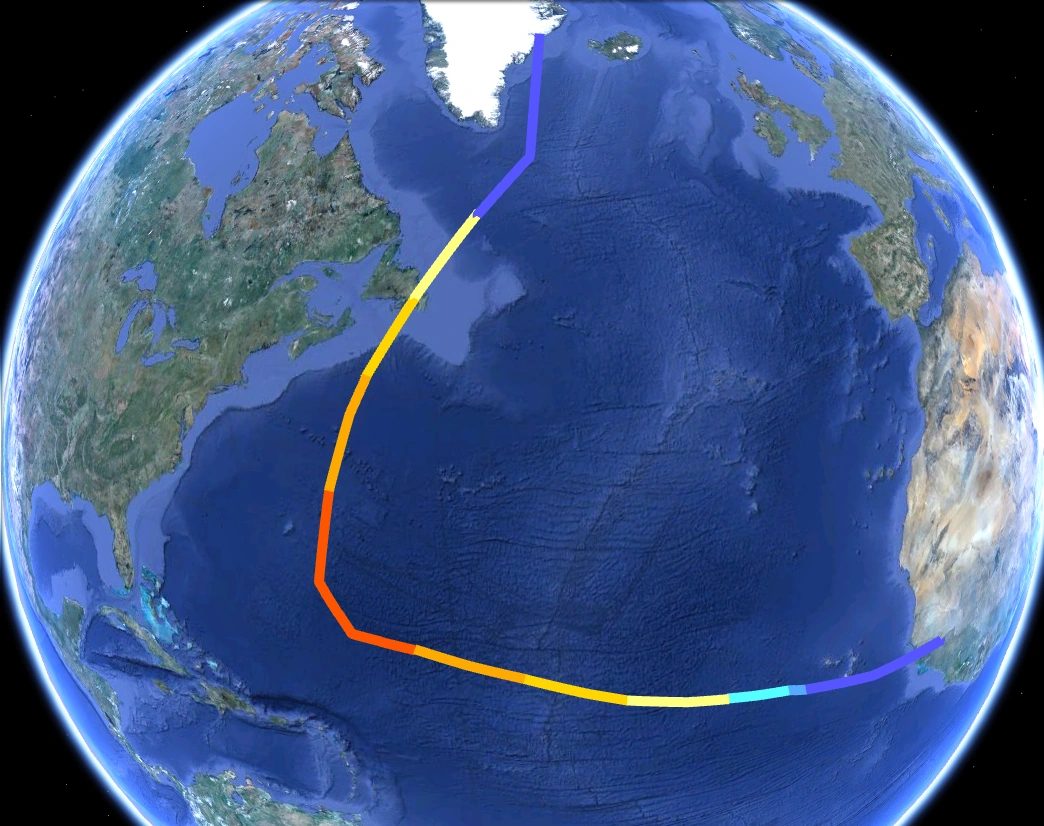
Hurricane Mu[]
| Category 7 hurricane | |
  | |
| Duration | September 30 – October 16 |
|---|---|
| Peak intensity | 245 mph (400 km/h) (1-min) 826 mbar (hPa) |
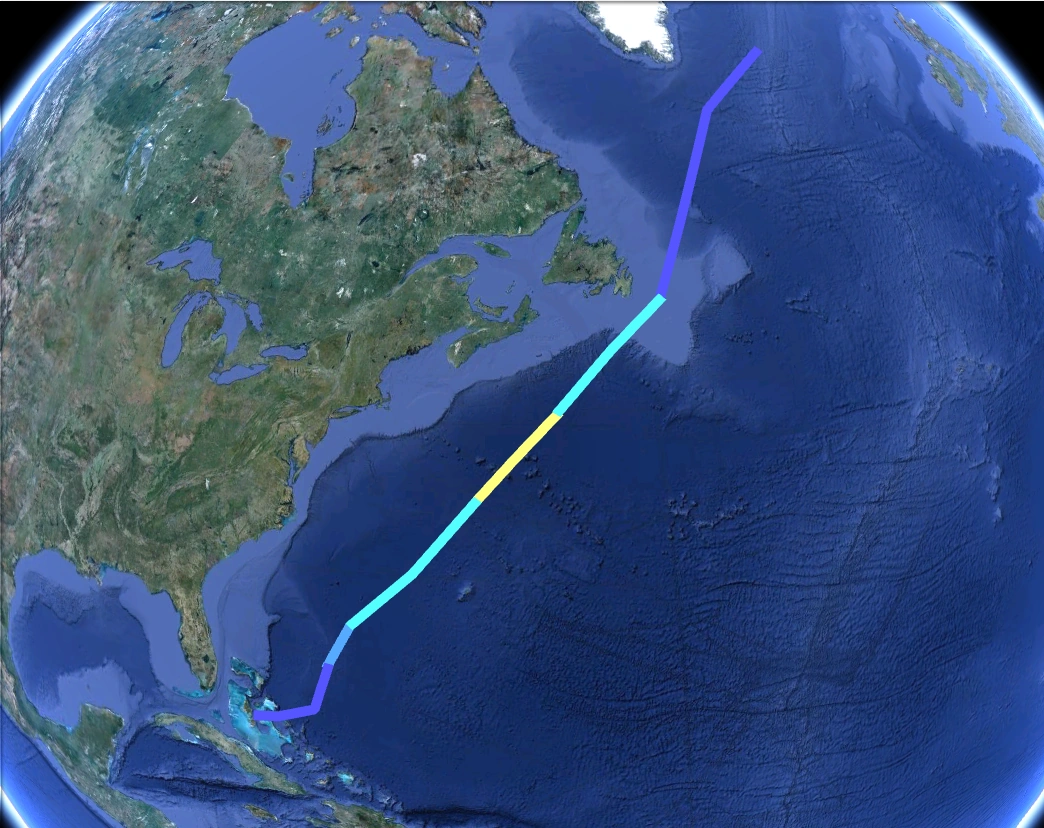
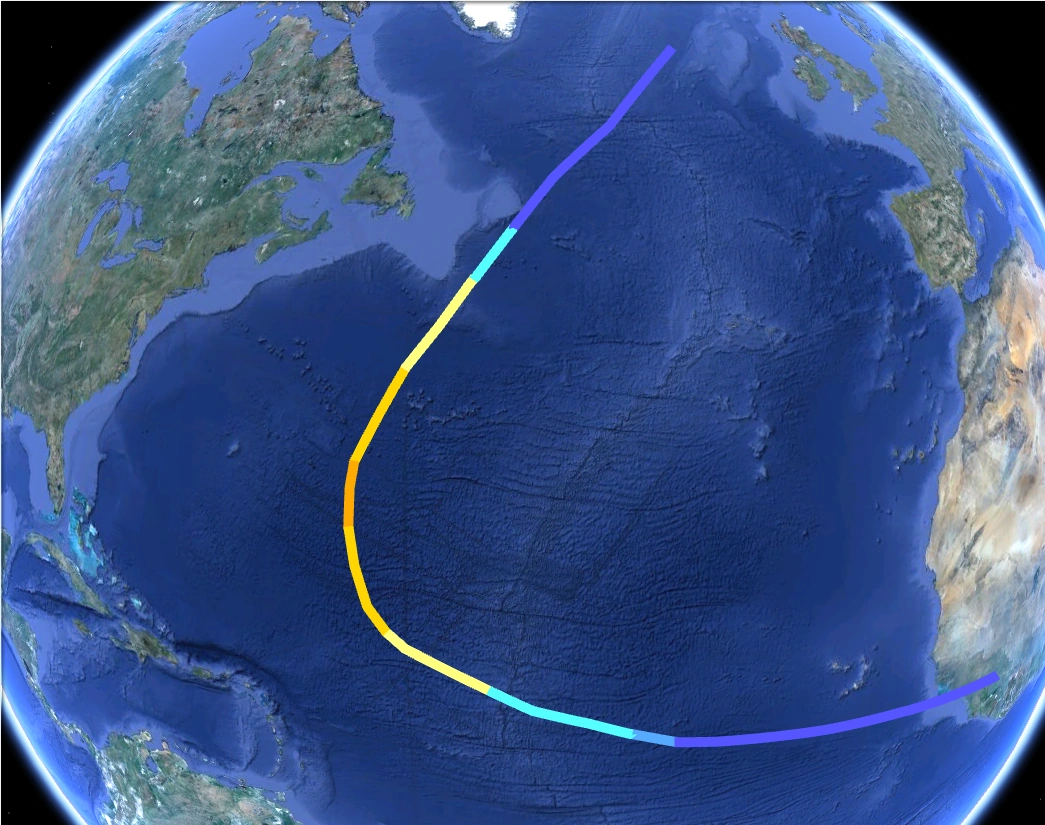
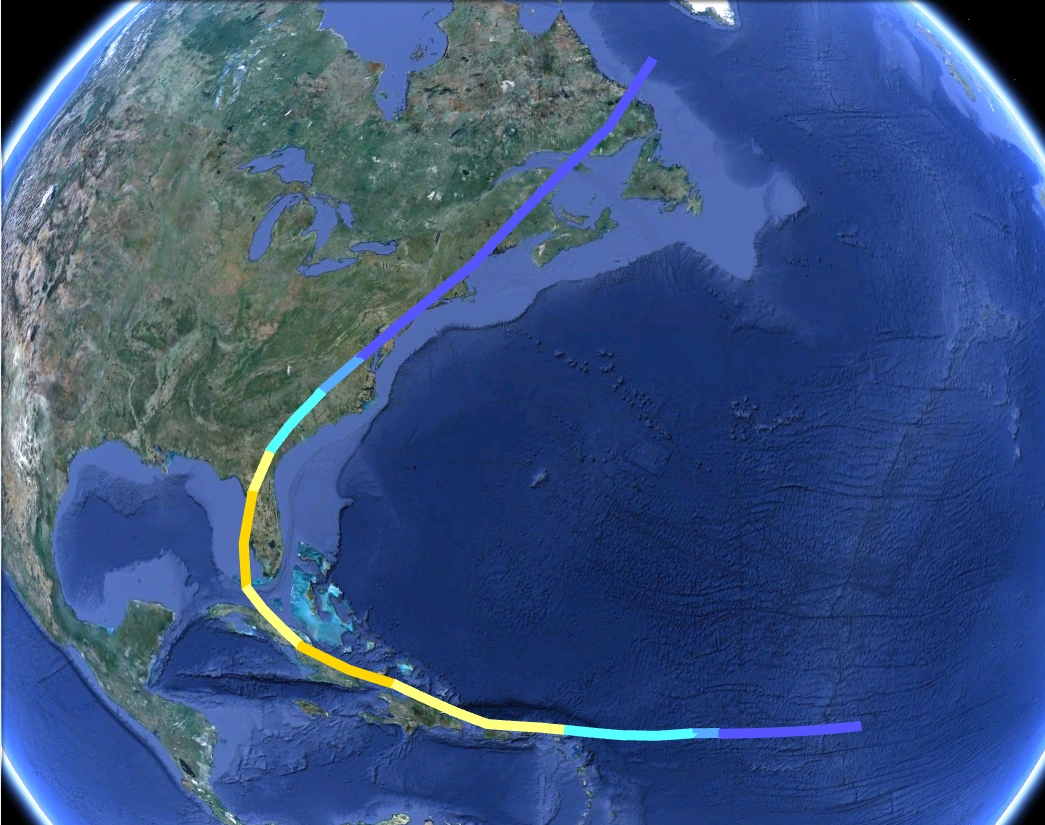
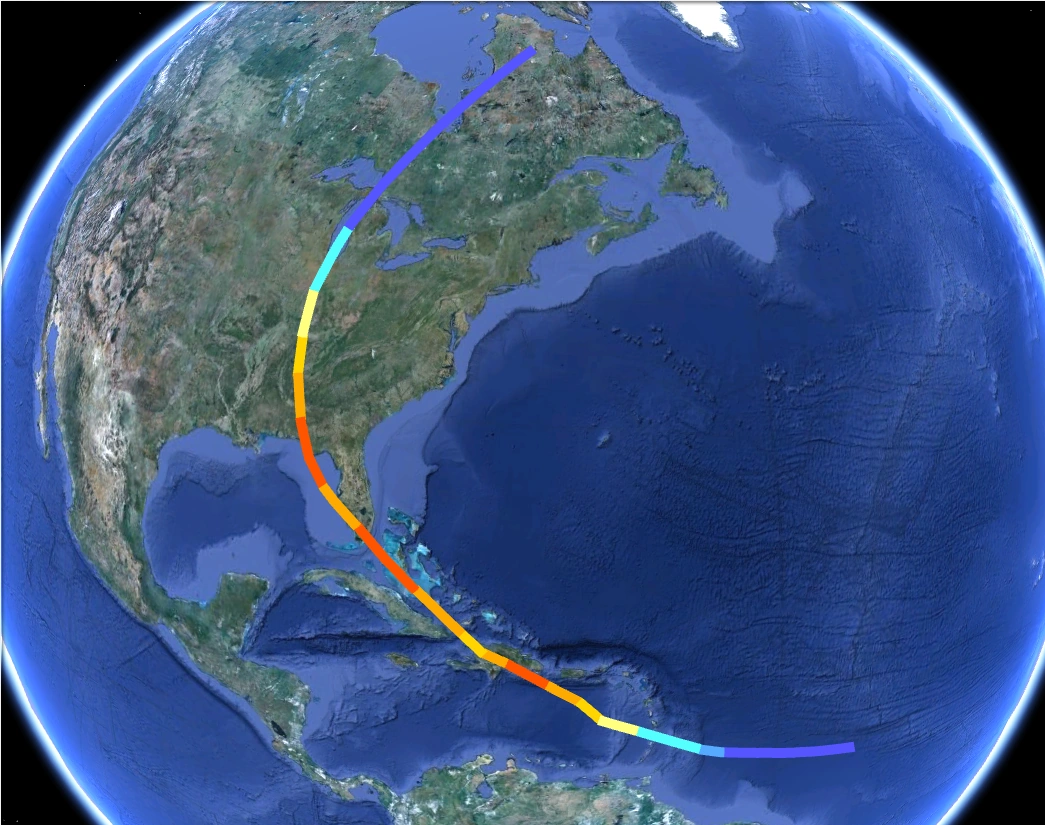
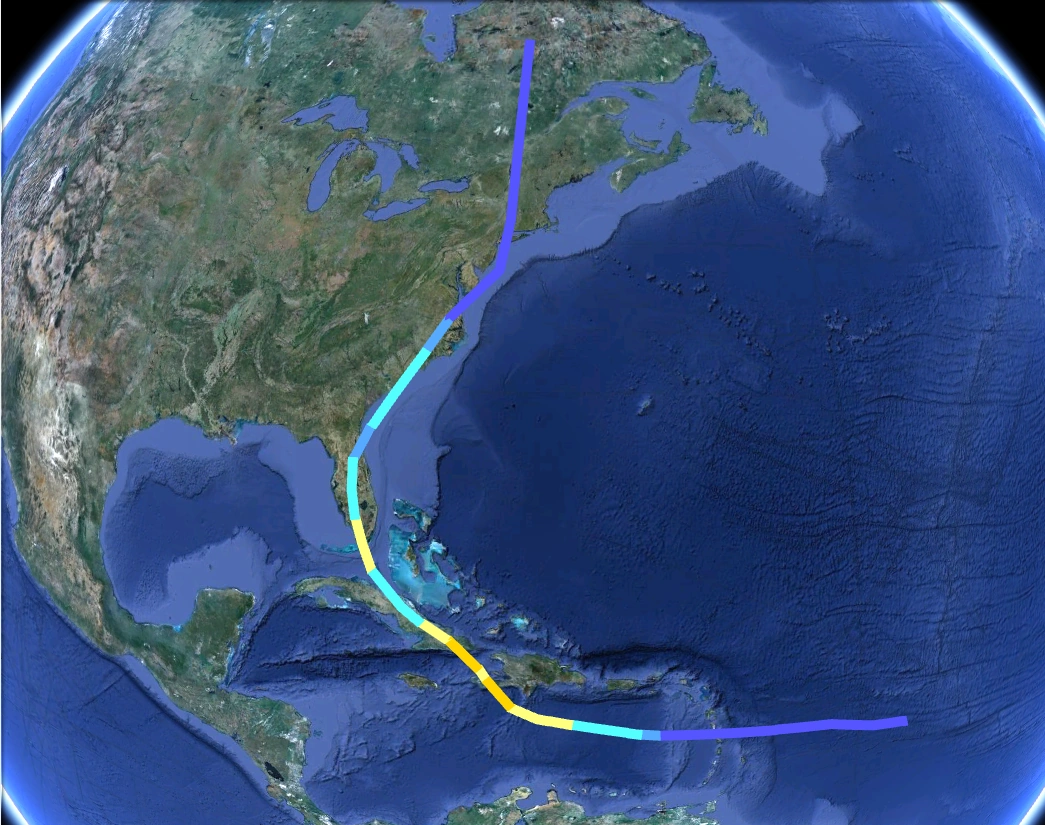
Formed south of the Cape Verde Islands. It impacted the Windward Islands as a C4, Honduras and Belize as a C6, and Florida as a C7. It followed the east coast before becoming extratropical south of Greenland. Mu was the strongest hurricane of the season, reaching 245 mph. It also caused catastrophic devastation amounting to $350 billion in damage and 11,386 deaths.
Hurricane Nu[]
| Category 2 hurricane (SSHWS) | |
  | |
| Duration | October 2 – October 9 |
|---|---|
| Peak intensity | 105 mph (165 km/h) (1-min) 966 mbar (hPa) |
Impacted Florida as a TS and North Carolina as a C2. N caused $1 billion in damage and 25 deaths.
Hurricane Xi[]
| Category 4 hurricane (SSHWS) | |
  | |
| Duration | October 5 – October 14 |
|---|---|
| Peak intensity | 150 mph (240 km/h) (1-min) 929 mbar (hPa) |
A Cape-Verde type hurricane that peaked as a C4 while passing near Bermuda and made landfall on Newfoundland as a C2. Xi caused $105 million in damage and 9 deaths.
Hurricane Omicron[]
| Category 1 hurricane (SSHWS) | |
  | |
| Duration | October 9 – October 16 |
|---|---|
| Peak intensity | 90 mph (150 km/h) (1-min) 978 mbar (hPa) |
Formed in the southwest Caribbean and impacted Honduras as a C1, Belize as a TS, and dissipated over the Yucatán peninsula. It later regenerated in the Gulf of Mexico and impacted Veracruz as a TS. Omicron caused $465 million in damage and killed 545 people, mainly because of destructive flash floods and mudslides.
Hurricane Pi[]
| Category 4 hurricane (SSHWS) | |
  | |
| Duration | October 12 – October 20 |
|---|---|
| Peak intensity | 135 mph (220 km/h) (1-min) 931 mbar (hPa) |
Impacted the Yucatán as a C4 and southern Mexico as a C3. Pi caused $854 million in damage and killed 282 people.
Hurricane Rho[]
| Category 2 hurricane (SSHWS) | |
  | |
| Duration | October 15 – October 22 |
|---|---|
| Peak intensity | 100 mph (155 km/h) (1-min) 975 mbar (hPa) |
Affected Haiti and Cuba as a C2, Florida as a C1, and the Carolinas as a TS. Rho caused $1.2 billion in damage and 475 deaths, mostly in Haiti.
Tropical Storm Sigma[]
| Tropical storm (SSHWS) | |
  | |
| Duration | October 19 – October 23 |
|---|---|
| Peak intensity | 60 mph (95 km/h) (1-min) 993 mbar (hPa) |
Formed from a supercell that came off the coast of New York City. It affected Nova Scotia and Newfoundland before dissipating in Newfoundland. Sigma caused minimal damage.
Hurricane Tau[]
| Category 4 hurricane (SSHWS) | |
  | |
| Duration | October 20 – October 27 |
|---|---|
| Peak intensity | 140 mph (220 km/h) (1-min) 957 mbar (hPa) |
Affected Puerto Rico as a TS, peaked as a C4 over open waters, passed close to the Azores as a C1, and affected Europe as an extratropical storm. Tau caused $1.5 million in damage.
Hurricane Upsilon[]
| Category 1 hurricane (SSHWS) | |
  | |
| Duration | October 24 – October 28 |
|---|---|
| Peak intensity | 85 mph (140 km/h) (1-min) 982 mbar (hPa) |
Made landfall near Jacksonville, Florida as a C1. Upsilon caused $148 million in damage and 8 deaths.
Hurricane Phi[]
| Category 4 hurricane (SSHWS) | |
  | |
| Duration | October 27 – November 4 |
|---|---|
| Peak intensity | 145 mph (230 km/h) (1-min) 946 mbar (hPa) |
Affected Honduras/Guatemala as a C4, Belize as a C3, crossed the Yucatán, and affected Veracruz as a C1. Phi caused $2 billion in damage and killed 3,648 people, especially because of deadly mudslides and flash floods.
Tropical Depression Forty-Nine[]
| Tropical depression (SSHWS) | |
  | |
| Duration | November 1 – November 2 |
|---|---|
| Peak intensity | 35 mph (55 km/h) (1-min) 1004 mbar (hPa) |
Formed close to Nicaragua and then made landfall in that country. It formed too close to land to become a tropical storm. Forty-Nine caused minimal damage and 2 deaths.
Hurricane Chi[]
| Category 3 hurricane (SSHWS) | |
  | |
| Duration | November 5 – November 12 |
|---|---|
| Peak intensity | 125 mph (205 km/h) (1-min) 952 mbar (hPa) |
Affected the southern Windward Islands as a TS, Haiti as a C1/C2, and Bermuda as a C3. It dissipated near Newfoundland. Chi caused $675 million in damage and 496 deaths, mainly in Haiti.
Hurricane Psi[]
| Category 5 hurricane (SSHWS) | |
  | |
| Duration | November 12 – November 22 |
|---|---|
| Peak intensity | 170 mph (275 km/h) (1-min) 918 mbar (hPa) |
Formed in the western Caribbean. It rapidly intensified, and made landfall on the Yucatán as a C5. It also affected Cuba as a C4 and Florida as a C3. It followed the Florida coastline before it dissipated in Georgia. Its remnants contributed to the formation of a massive nor-Easter that hit the east coast. Psi caused $13 billion in damage and 1,076 deaths, mainly in the Yucatán.
Tropical Storm Omega[]
| Tropical storm (SSHWS) | |
  | |
| Duration | November 21 – November 25 |
|---|---|
| Peak intensity | 65 mph (100 km/h) (1-min) 992 mbar (hPa) |
Didn't affect land, and peaked as a 65 mph TS northeast of Bermuda. When this season hit the name Omega, it became the first season in history to exhaust the Greek alphabet. After this storm, the NHC started to use the Hebrew alphabet.
Hurricane Alef[]
| Category 2 hurricane (SSHWS) | |
  | |
| Duration | December 1 – December 8 |
|---|---|
| Peak intensity | 100 mph (155 km/h) (1-min) 979 mbar (hPa) |
Didn't make landfall, but brought rain to Bermuda when it passed near the island as a C2. It was also the first storm ever to use the Hebrew alphabet.
Tropical Storm Bet[]
| Tropical storm (SSHWS) | |
  | |
| Duration | December 16 – December 20 |
|---|---|
| Peak intensity | 45 mph (75 km/h) (1-min) 997 mbar (hPa) |
A weak tropical storm that didn't affect land.
Tropical Storm Gimel[]
| Tropical storm (SSHWS) | |
  | |
| Duration | December 29 – January 2, 2101 |
|---|---|
| Peak intensity | 50 mph (85 km/h) (1-min) 996 mbar (hPa) |
Another weak storm that didn't affect land. It was also one of few storms to cross into the next year, as Gimel lasted into January 2, 2101.
Storm names[]
The following names were used to name tropical cyclones this year. This is the same list used in the 2094 season, expect for Pamela, which replaced Portia. The names Qualia, Unala, Xavier, Yolanda, and Zeke were added after the season started due to extreme activity.
|
|
|
|
Greek Alphabet[]
Due to extreme activity, the Greek Alphabet was used this year.
|
|
|
Hebrew Alphabet[]
Because of the extreme historic activity of this season, even the Greek Alphabet was exhausted. Thus, the Hebrew Alphabet was used for the first time ever. The first three letters of the Hebrew Alphabet were used this year.
|
|
|
|
Retirement[]
Due to extensive damage and deaths, the names Gregory, Lisa, Nadia, Oliver, Pamela, Shary, Tom, and Unala were officially retired, and will never be used again for an Atlantic hurricane. They were replaced by Gary, Lexi, Nellie, Olo, Perdita, Sasha, and Tim. Unala didn't have a replacement name because it was one of the names the NHC added after the season started. The names Gamma, Delta, Eta, Theta, Kappa, Mu, Rho, Phi, and Psi were also retired, but were marked for potential reuse in the future.
List for 2106:
|
|
|
Accumulated Cyclone Energy (ACE)[]
| ACE (104 kt2) – Storm: Source | ||||||||||||||
|---|---|---|---|---|---|---|---|---|---|---|---|---|---|---|
| 1 | 112.4 | Shary | 12 | 27.6 | Eta | 23 | 18.5 | Beta | 34 | 11.1 | Alef | 45 | 2.46 | Alpha |
| 2 | 101.6 | Mu | 13 | 26.8 | Xi | 24 | 18.1 | Chi | 35 | 10.3 | Yolanda | 46 | 1.52 | Debra |
| 3 | 81.8 | Oliver | 14 | 25.5 | Walter | 25 | 17.4 | Roy | 36 | 9.45 | Eddie | 47 | 1.24 | Bernice |
| 4 | 76.4 | Delta | 15 | 24.3 | Pamela | 26 | 16.5 | Virginie | 37 | 8.74 | Clyde | 48 | 0.92 | Hermine |
| 5 | 46.7 | Gamma | 16 | 23.6 | Phi | 27 | 16.0 | Kappa | 38 | 8.26 | Lisa | 49 | 0.84 | Omega |
| 6 | 38.2 | Psi | 17 | 22.7 | Irving | 28 | 15.2 | Jane | 39 | 6.95 | Omicron | 50 | 0.72 | Alan |
| 7 | 36.1 | Theta | 18 | 22.0 | Unala | 29 | 14.7 | Tom | 40 | 6.07 | Xavier | 51 | 0.59 | Sigma |
| 8 | 34.0 | Epsilon | 19 | 21.1 | Tau | 30 | 14.3 | Nadia | 41 | 5.48 | Kirt | 52 | 0.38 | Gimel |
| 9 | 32.5 | Iota | 20 | 20.7 | Pi | 31 | 13.6 | Zeta | 42 | 4.72 | Lambda | 53 | 0.29 | Bet |
| 10 | 29.9 | Zeke | 21 | 20.0 | Qualia | 32 | 12.9 | Nu | 43 | 4.37 | Upsilon | |||
| 11 | 28.8 | Mark | 22 | 19.3 | Gregory | 33 | 12.0 | Rho | 44 | 3.14 | Faye | |||
| Total=1,128.74 (Record high) | ||||||||||||||
ACE is the result of a storm's winds multiplied by how long it lasted for, so storms that lasted a long time (like Shary), as well as particularly strong hurricanes (like Mu), have higher ACE totals. 2100 was extremely hyperactive in these terms; with an ACE total of 1,129. The storms Shary, Mu, Oliver, and Delta were the main cause for this record high ACE. Tropical depressions and subtropical storms, such as portions of TS Sigma and TS Gimel, are not included in season totals.
Season effects[]
This is a table of the storms and their effects in the 2100 Atlantic hurricane season. This table includes the storm's names, duration, peak intensity, Areas affected, damages, and death totals. Damage and deaths include totals while the storm was extratropical, a wave or a low. All of the damage figures are in US$2100 (the listed damage figure is in millions).
|
Tropical cyclones of the 2100 Atlantic hurricane season | |||||||||||||||||||||||||||||||||||||||||||||||||||||||||||||||||||||||
|
|
| ||||||||||||||||||||||||||||||||||||||||||||||||||||||||||||||||||||||
|
| |||||||||||||||||||||||||||||||||||||||||||||||||||||||||||||||||||||||
| Storm name |
Dates active | Storm category at peak intensity |
Max 1-min wind mph (km/h) |
Min. press. (mbar) |
Areas affected | Damage (USD) |
Deaths |
|---|---|---|---|---|---|---|---|
| Alan | April 18 – April 22 | Tropical storm | 60 (95) | 995 | US East Coast, Atlantic Canada | Minimal | 0 |
| Bernice | April 30 – May 5 | Tropical storm | 70 (110) | 990 | Bermuda | None | 0 |
| Clyde | May 16 – May 22 | Category 2 hurricane | 100 (155) | 973 | Yucatan Peninsula, Mexico | 57 | 16 |
| Four | May 29 – May 31 | Tropical depression | 35 (55) | 1006 | The Carolinas | Minimal | 0 |
| Debra | May 30 – June 4 | Tropical storm | 70 (110) | 987 | Leeward Islands, Puerto Rico, Hispaniola, Cuba (Florida, US East Coast as a remnant low) | 35 | 9 |
| Eddie | June 7 – June 16 | Category 1 hurricane | 90 (150) | 979 | Jamaica, Belize, Yucatan Peninsula, Mexico (Windward Islands as a tropical wave) | 69 | 40 |
| Faye | June 15 – June 18 | Category 1 hurricane | 80 (130) | 984 | Bermuda, Newfoundland | Minimal | 0 |
| Gregory | June 18 – June 26 | Category 3 hurricane | 125 (205) | 946 | Windward Islands, Jamaica, Yucatan Peninsula, Texas, Central US | 4,100 | 43 |
| Hermine | June 24 – June 29 | Tropical storm | 65 (100) | 990 | Florida, Georgia, The Carolinas (Newfoundland after dissipating) | Minimal | 1 |
| Irving | June 28 – July 8 | Category 4 hurricane | 140 (220) | 934 | Bermuda, Newfoundland | 215 | 12 |
| Jane | July 2 – July 10 | Category 3 hurricane | 115 (185) | 956 | None | None | 0 |
| Kirt | July 5 – July 10 | Category 1 hurricane | 85 (140) | 981 | US East Coast | 550 | 5 |
| Lisa | July 9 – July 15 | Category 2 hurricane | 100 (155) | 975 | US Gulf Coast, Central US | 1,600 | 14 |
| Mark | July 11 – July 22 | Category 5 hurricane | 160 (260) | 916 | Cape Verde, Azores (United Kingdom after dissipating) | 21 | 2 |
| Nadia | July 15 – July 23 | Category 2 hurricane | 105 (165) | 961 | Leeward Islands, Puerto Rico, Hispaniola, Cuba, Florida, Georgia, The Carolinas, US East Coast | 4,500 | 79 |
| Oliver | July 20 – August 10 | Category 6 hurricane | 210 (340) | 866 | Leeward Islands, Puerto Rico, Hispaniola, Jamaica, Cuba, Yucatan Peninsula, US Gulf Coast, Southeast US, The Carolinas, Bermuda | 248,000 | 7,136 |
| Pamela | July 23 – July 31 | Category 4 hurricane | 145 (230) | 932 | Windward Islands, Hispaniola, Cuba, Bahamas, Florida, Southeast US, Central US | 12,000 | 645 |
| Qualia | July 26 – July 31 | Category 4 hurricane | 140 (220) | 936 | Mexico | 550 | 41 |
| Roy | July 28 – August 4 | Category 3 hurricane | 125 (205) | 946 | Cape Verde (Europe after dissipating) | Minimal | 0 |
| Shary | August 3 – September 4 | Category 6 hurricane | 230 (370) | 842 | Windward Islands, Hispaniola, Jamaica, Yucatan Peninsula, Mexico (2x), US Gulf Coast, Florida, Bermuda | 420,000 | 42,763 |
| Tom | August 8 – August 13 | Category 3 hurricane | 115 (185) | 966 | US Gulf Coast, Southeast US | 4,500 | 32 |
| Unala | August 10 – August 17 | Category 4 hurricane | 140 (220) | 942 | Bahamas, Florida, Southeast US, US East Coast | 9,200 | 39 |
| Virginie | August 14 – August 20 | Category 3 hurricane | 125 (205) | 949 | Yucatan Peninsula, Mexico | 305 | 253 |
| Walter | August 15 – August 26 | Category 4 hurricane | 145 (230) | 938 | Leeward Islands | 53 | 14 |
| Xavier | August 19 – August 23 | Category 1 hurricane | 90 (150) | 980 | Azores (United Kingdom after dissipating) | Minimal | 0 |
| Yolanda | August 22 – August 27 | Category 2 hurricane | 100 (155) | 974 | None | None | 0 |
| Zeke | August 24 – September 1 | Category 5 hurricane | 165 (270) | 916 | Cape Verde, Newfoundland (Iceland after dissipating) | 75 | 21 |
| Alpha | August 27 – September 6 | Tropical storm | 70 (110) | 987 | Leeward Islands, Puerto Rico, US East Coast | 24 | 3 |
| Beta | August 31 – September 7 | Category 3 hurricane | 125 (205) | 948 | Cape Verde | Minimal | 0 |
| Gamma | September 3 – September 12 | Category 6 hurricane | 210 (340) | 868 | Florida, Texas, Midwest US | 195,000 | 1,235 |
| Delta | September 5 – September 16 | Category 6 hurricane | 225 (360) | 850 | Windward Islands, Venezuela, Colombia, Nicaragua | 14,000 | 27,628 |
| Epsilon | September 8 – September 17 | Category 5 hurricane | 165 (270) | 916 | Cape Verde | None | 0 |
| Zeta | September 13 – September 19 | Category 2 hurricane | 110 (175) | 965 | None | None | 0 |
| Eta | September 16 – September 25 | Category 4 hurricane | 155 (250) | 930 | Leeward Islands, Puerto Rico, Hispaniola, Bahamas, The Carolinas, US East Coast, Atlantic Canada | 14,000 | 153 |
| Theta | September 20 – September 28 | Category 5 hurricane | 170 (275) | 912 | Jamaica, Cuba, US Gulf Coast, Midwest US | 41,000 | 637 |
| Iota | September 21 – October 2 | Category 5 hurricane | 160 (260) | 921 | Bermuda, Newfoundland | Minimal | 0 |
| Kappa | September 24 – September 30 | Category 3 hurricane | 120 (195) | 956 | Yucatan Peninsula (as a low), Texas, Midwest US | 6,100 | 32 |
| Lambda | September 27 – October 1 | Category 1 hurricane | 85 (140) | 979 | Cape Verde, Canary Islands, Spain (France and England after dissipating) | Minimal | 0 |
| Muster | September 30 – October 16 | Category 7 hurricane | 245 (400) | 826 | Windward Islands, Jamaica, Nicaragua, Honduras, Belize, Yucatan Peninsula, Florida, Georgia, The Carolinas, US East Coast, Atlantic Canada (Iceland after dissipating) | 350,000 | 11,386 |
| Nutter | October 2 – October 9 | Category 2 hurricane | 105 (165) | 966 | Cuba (as a low), Florida, The Carolinas, Northeast US | 1,000 | 25 |
| Xi | October 5 – October 14 | Category 4 hurricane | 150 (240) | 929 | Cape Verde, Bermuda, Newfoundland | 105 | 9 |
| Omicron | October 9 – October 16 | Category 1 hurricane | 90 (150) | 978 | Nicaragua, Honduras, Belize, Yucatan Peninsula, Mexico | 465 | 545 |
| Pi | October 12 – October 20 | Category 4 hurricane | 135 (220) | 931 | Belize, Yucatan Peninsula, Mexico | 854 | 282 |
| Rho | October 15 – October 22 | Category 2 hurricane | 100 (155) | 975 | Windward Islands (as a low), Hispaniola, Cuba, Florida, Georgia, The Carolinas, US East Coast | 1,200 | 475 |
| Sigma | October 19 – October 23 | Tropical storm | 60 (95) | 993 | Atlantic Canada, Newfoundland | Minimal | 0 |
| Tau | October 20 – October 27 | Category 4 hurricane | 140 (220) | 957 | Windward Islands (as a low), Puerto Rico, Azores (Europe after dissipating) | 1.5 | 0 |
| Upsilon | October 24 – October 28 | Category 1 hurricane | 85 (140) | 982 | Florida, Georgia, Southeast US | 148 | 8 |
| Phi | October 27 – November 4 | Category 4 hurricane | 145 (230) | 946 | Honduras, Guatemala, Belize, Mexico | 2,000 | 3,648 |
| Forty-Nine | November 1 – November 2 | Tropical depression | 35 (55) | 1004 | Nicaragua | Minimal | 2 |
| Chi | November 5 – November 12 | Category 3 hurricane | 125 (205) | 952 | Windward Islands, Hispaniola, Turks @ Caicos, Bermuda, Newfoundland | 675 | 496 |
| Psi | November 12 – November 22 | Category 5 hurricane | 170 (275) | 918 | Belize, Yucatan Peninsula, Cuba, Florida, Georgia (The Carolinas and US East Coast after dissipating) | 13,000 | 1,076 |
| Omega | November 21 – November 25 | Tropical storm | 65 (100) | 992 | Newfoundland (after dissipating) | None | 0 |
| Alef | December 1 – December 8 | Category 2 hurricane | 100 (155) | 979 | Bermuda (Newfoundland after dissipating) | Minimal | 0 |
| Bet | December 16 – December 20 | Tropical storm | 45 (75) | 997 | None | None | 0 |
| Gimel | December 29 – January 2 | Tropical storm | 50 (85) | 996 | None | None | 0 |