The 2015 Atlantic hurricane season began on June 1, 2015 and ended November 30th, 2015.
Seasonal forecasts[]
| Source | Date | Named
storms |
Hurricanes | Major
hurricanes | |
| NOAA | April 30, 2015 | 13 | 6 | 2 | |
| ––––––––––––––––––––––––––––––––––––––––––––––––––––––– | |||||
| Actual activity | 12 | 6 | 3 | ||
Season Summary[]
The 2015 Atlantic hurricane season was a near-normal season, the season spawned 15 depressions, 12 named storms, 6 hurricanes and 3 major.
Before the season began, other parts of the globe were experiencing record breaking activity, such as a rather high number of Category-5s for the early half of the year, a higher number of Tropical/Subtropical Cyclones in the Southern Atlantic.. one of the earliest Category-5s on record in the Western Pacific.. many things that pointed to possibly one of the Worst El Ninos on Record.
The Season started with Ana, a weak Hurricane that formed on June 10.
The Aforementioned Activity later Spread into the Atlantic, where Grace would be added to the Year's high total of Category-5s.
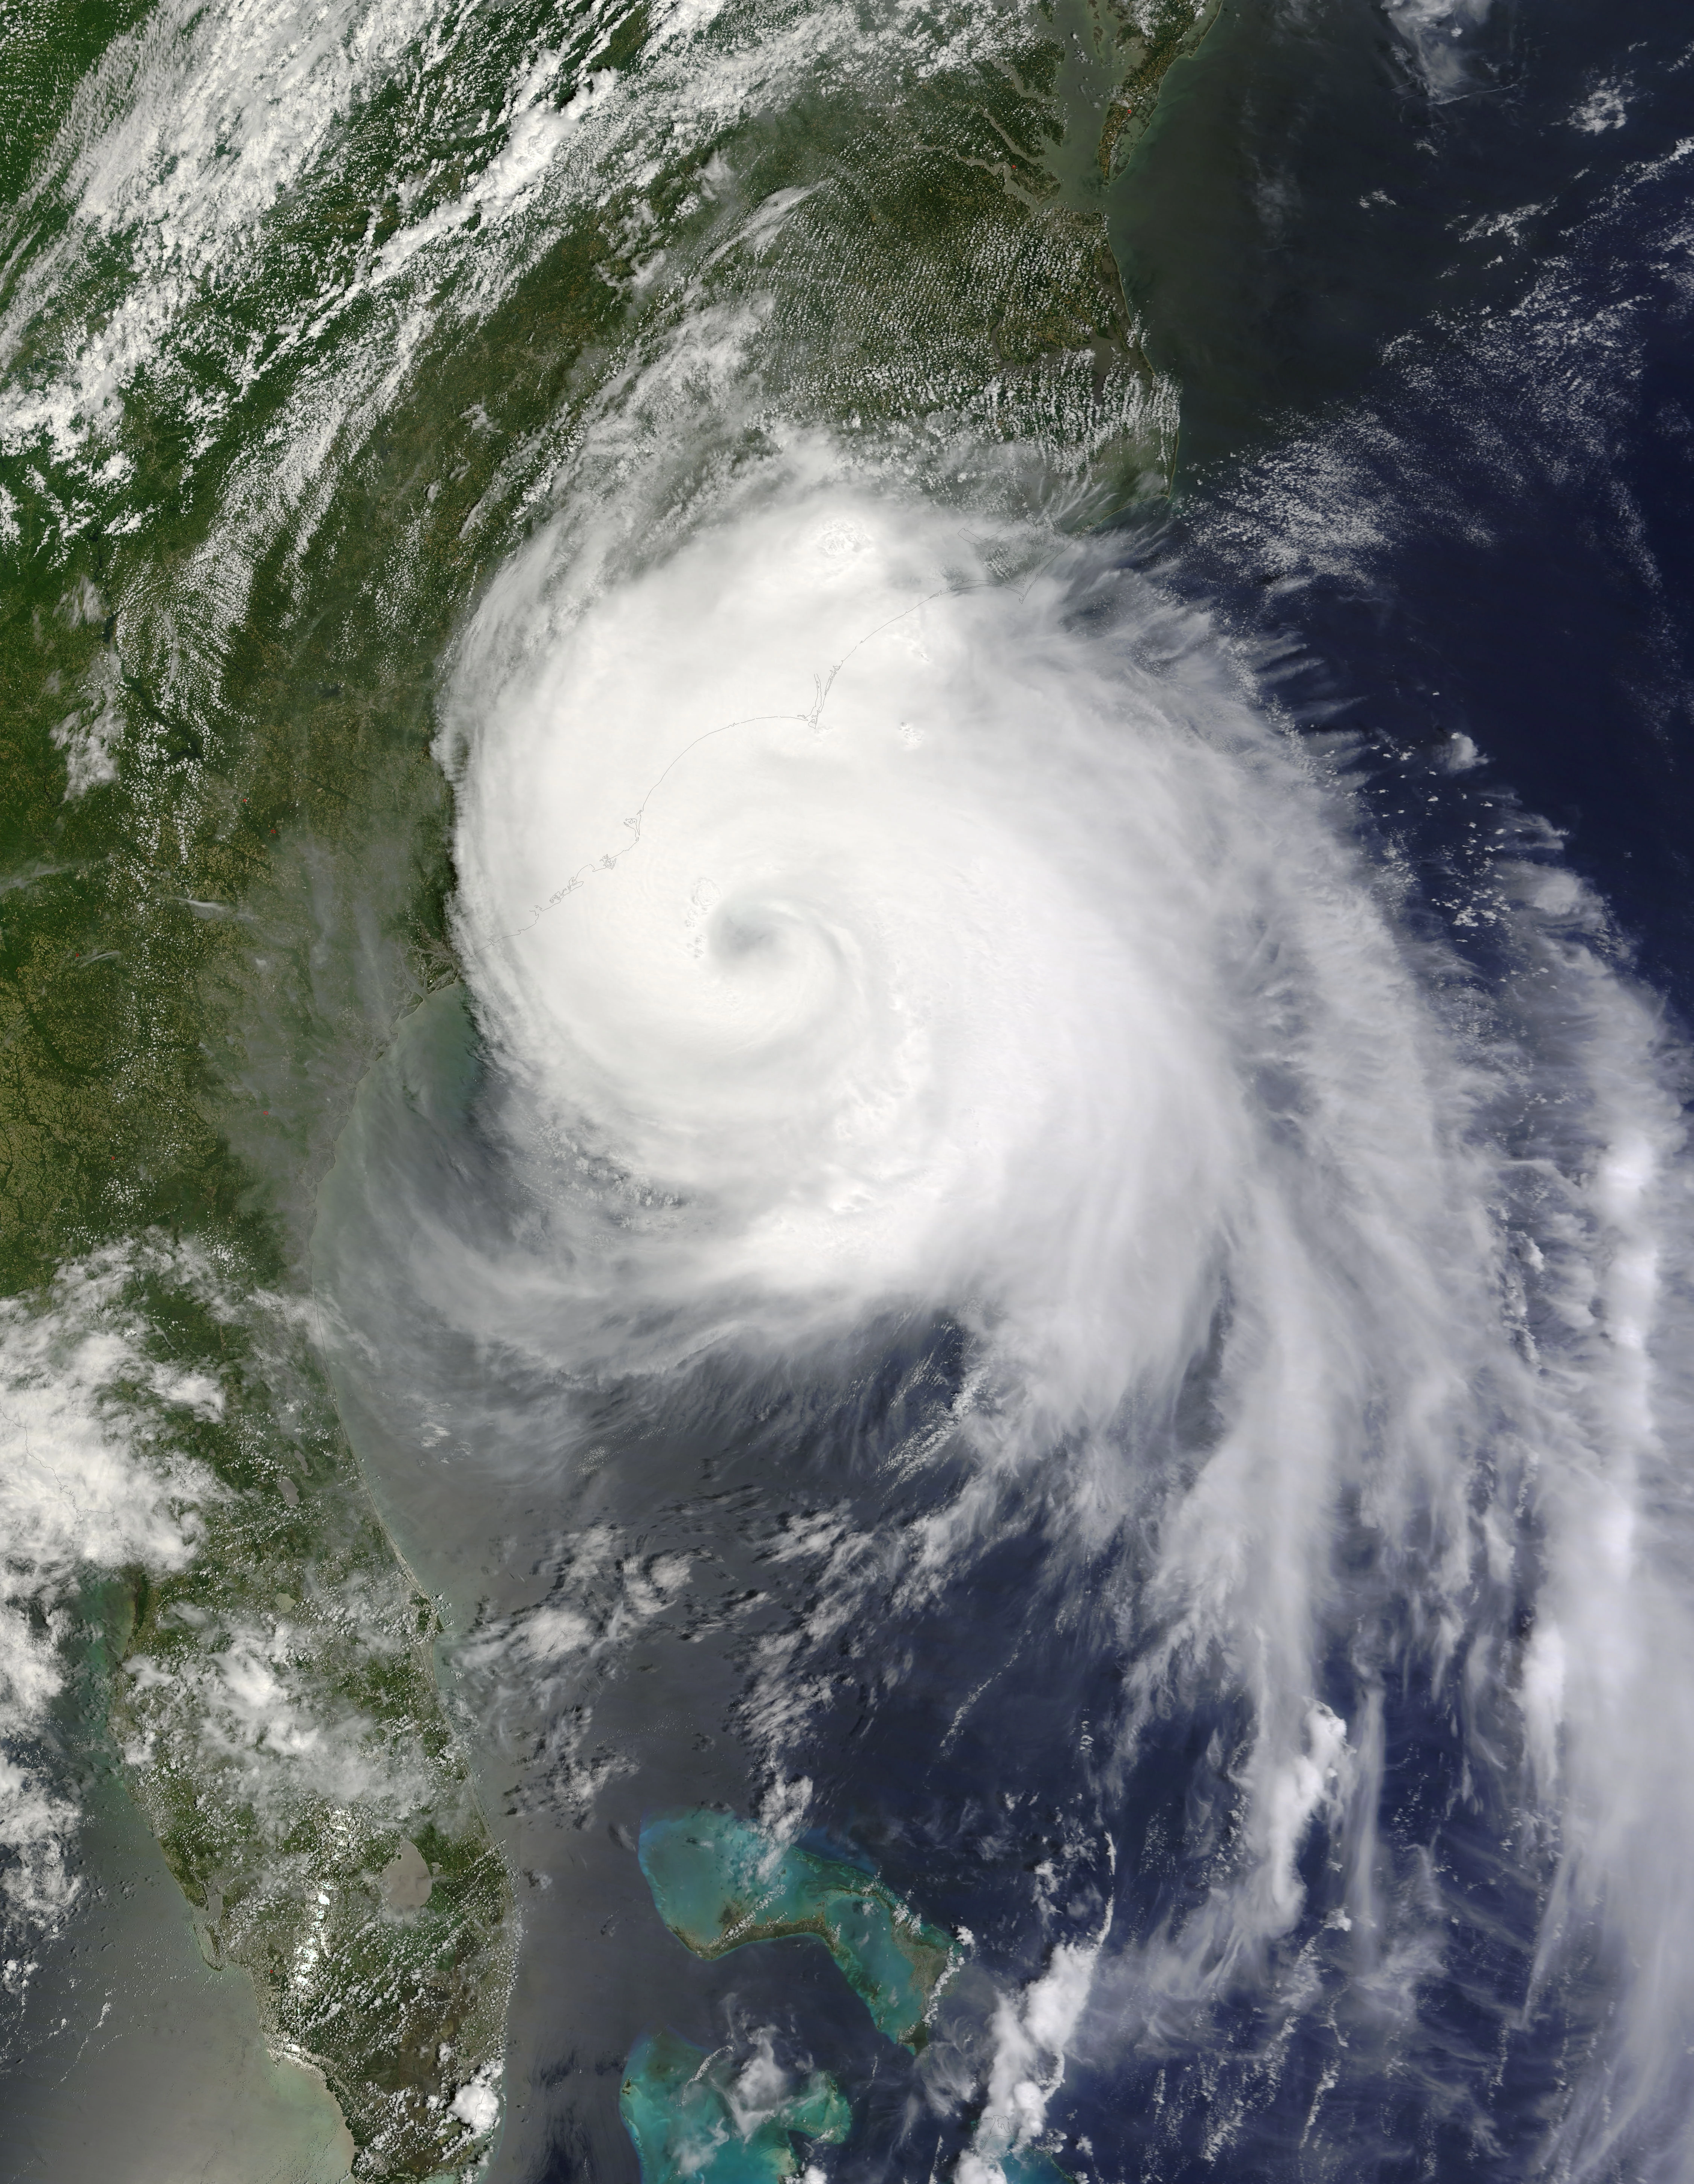
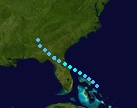
Grace became the first Category-5 to form in the Atlantic since 2007, and the first Major Hurricane to make landfall anywhere in the US since Wilma from 2005
Grace became the strongest storm of the season, at 165 mph (270 km/h), it would later weaken and make landfall in North Carolina as a 115 mph (185 km/h) Category-3 just before Midnight on September 20.
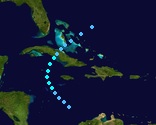
Later, Ida cut a path through the Caribbean, Peaking as a Strong Category-4 and making several landfalls in Mexico.
The season ended with Larry, a Weak TS that made landfall in Florida, before dissipating on November 3.
In All, the season caused $19.52 billion (2015 USD) in damage and killed 458, making 2015 the most destructive season since 2012
Storms[]
|
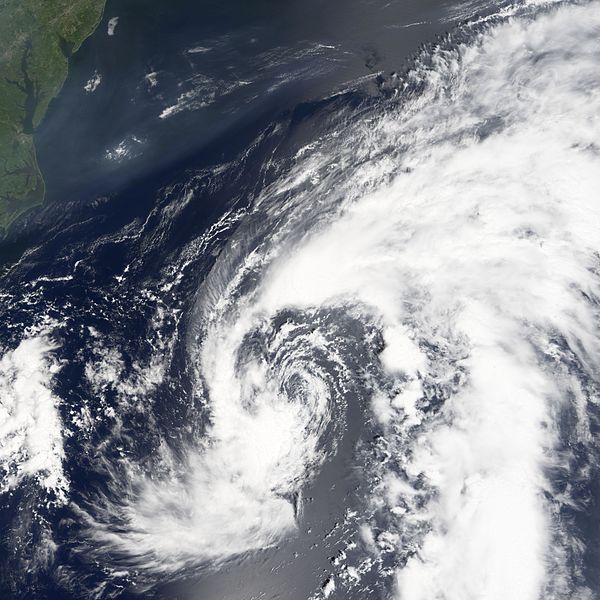
Hurricane Ana[]
| Category 1 hurricane (SSHWS) | |
  | |
| Duration | June 10 – June 16 |
|---|---|
| Peak intensity | 75 mph (120 km/h) (1-min) 987 mbar (hPa) |
Main article: Hurricane Ana (2015)
Tropical Depression Two[]
| Tropical depression (SSHWS) | |
  | |
| Duration | July 30 – August 1 |
|---|---|
| Peak intensity | 35 mph (55 km/h) (1-min) 1002 mbar (hPa) |
Tropical Storm Bill[]
| Tropical storm (SSHWS) | |
  | |
| Duration | August 17 – August 22 |
|---|---|
| Peak intensity | 60 mph (95 km/h) (1-min) 995 mbar (hPa) |
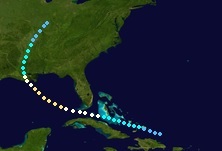
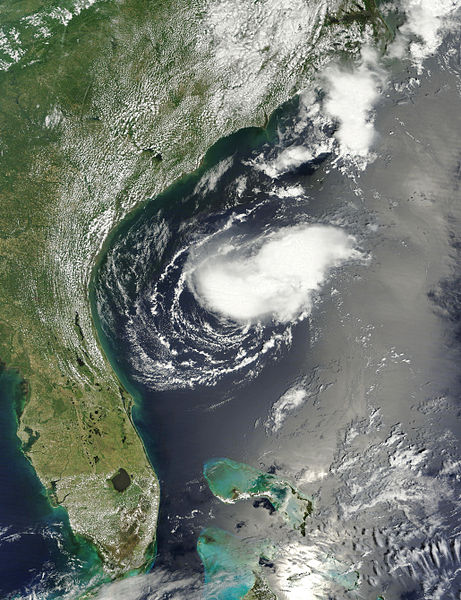
Tropical Storm Claudette[]
| Tropical storm (SSHWS) | |
  | |
| Duration | August 20 – August 25 |
|---|---|
| Peak intensity | 70 mph (110 km/h) (1-min) 986 mbar (hPa) |
Hurricane Danny[]
| Category 3 hurricane (SSHWS) | |
  | |
| Duration | August 26 – September 7 |
|---|---|
| Peak intensity | 115 mph (185 km/h) (1-min) 959 mbar (hPa) |
Tropical Depression Six[]
| Tropical depression (SSHWS) | |
  | |
| Duration | August 31 – September 2 |
|---|---|
| Peak intensity | 35 mph (55 km/h) (1-min) 1004 mbar (hPa) |
Hurricane Erika[]
| Category 2 hurricane (SSHWS) | |
  | |
| Duration | September 1 – September 14 |
|---|---|
| Peak intensity | 110 mph (175 km/h) (1-min) 960 mbar (hPa) |
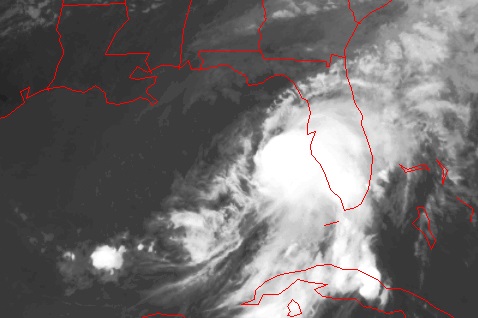
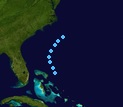
Tropical Storm Fred[]
| Tropical storm (SSHWS) | |
  | |
| Duration | September 7 – September 9 |
|---|---|
| Peak intensity | 40 mph (65 km/h) (1-min) 1000 mbar (hPa) |
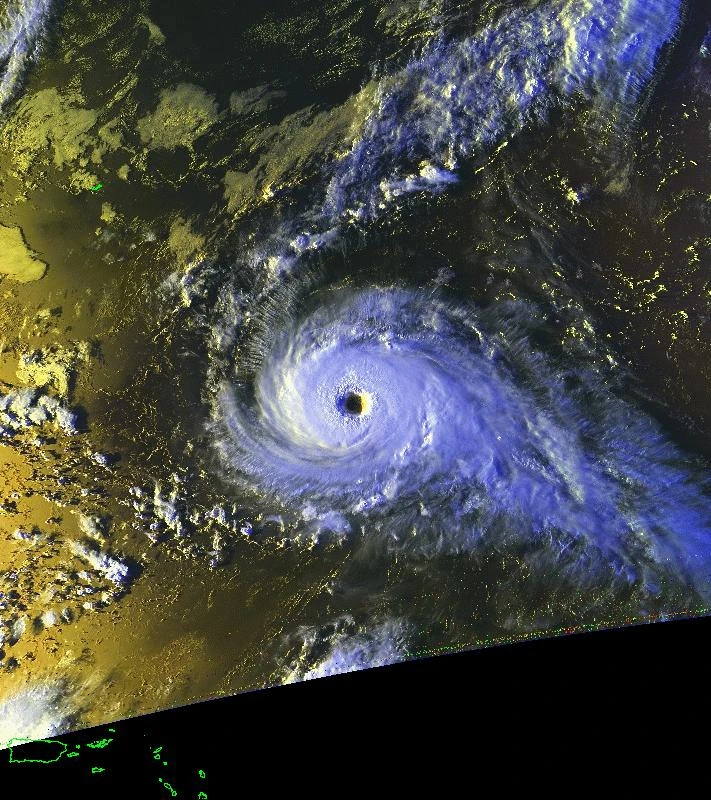
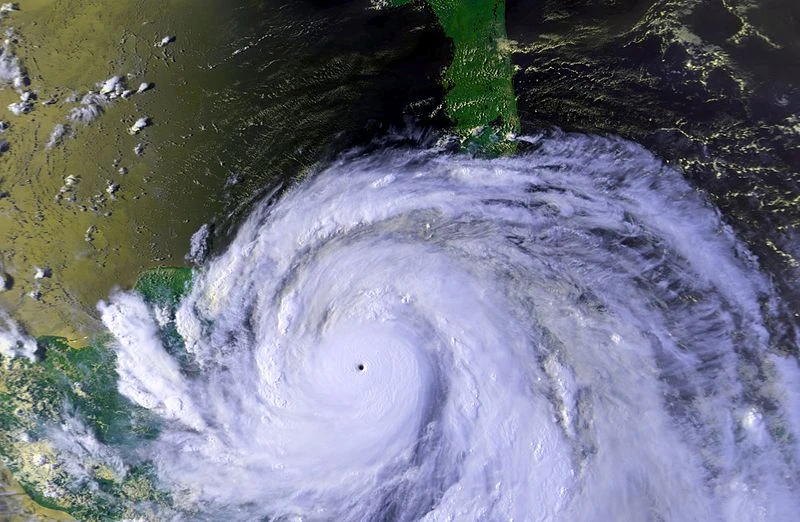
Hurricane Grace[]
| Category 5 hurricane (SSHWS) | |
  | |
| Duration | September 10 – September 24 |
|---|---|
| Peak intensity | 165 mph (270 km/h) (1-min) 911 mbar (hPa) |
Tropical Depression Ten[]
| Tropical depression (SSHWS) | |
  | |
| Duration | September 14 – September 16 |
|---|---|
| Peak intensity | 35 mph (55 km/h) (1-min) 1002 mbar (hPa) |
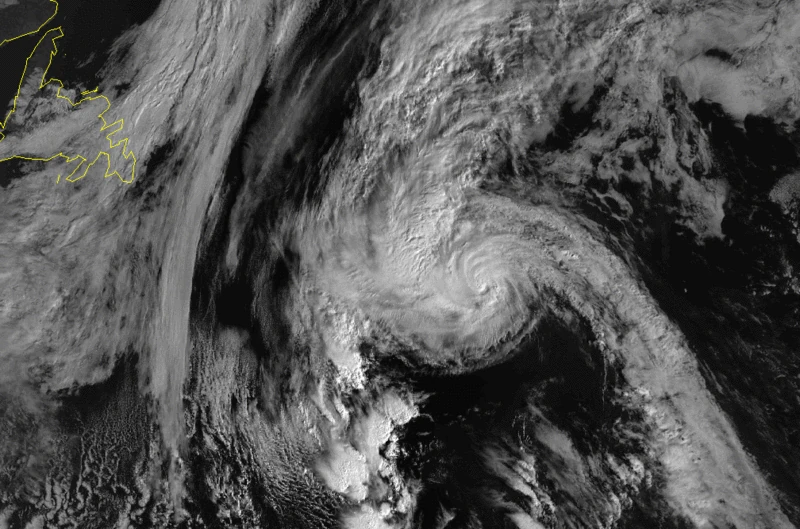
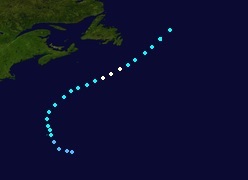
Hurricane Henri[]
| Category 1 hurricane (SSHWS) | |
 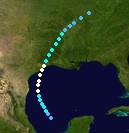 | |
| Duration | September 20 – September 26 |
|---|---|
| Peak intensity | 90 mph (150 km/h) (1-min) 971 mbar (hPa) |
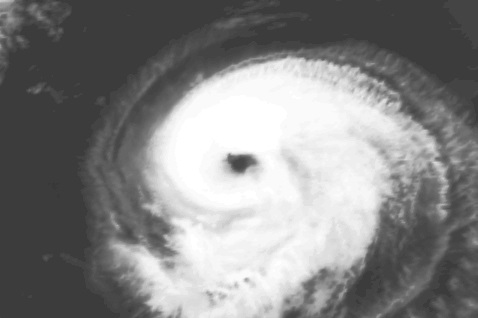
Hurricane Ida[]
| Category 4 hurricane (SSHWS) | |
 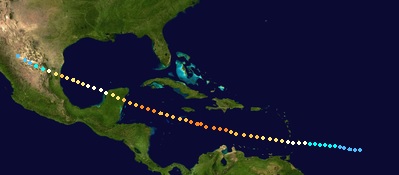 | |
| Duration | September 30 – October 12 |
|---|---|
| Peak intensity | 145 mph (230 km/h) (1-min) 934 mbar (hPa) |
Subtropical Storm Joaquin[]
| Tropical storm (SSHWS) | |
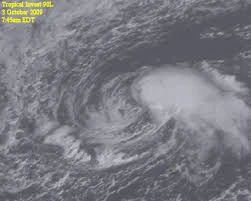  | |
| Duration | October 9 – October 13 |
|---|---|
| Peak intensity | 45 mph (75 km/h) (1-min) 998 mbar (hPa) |
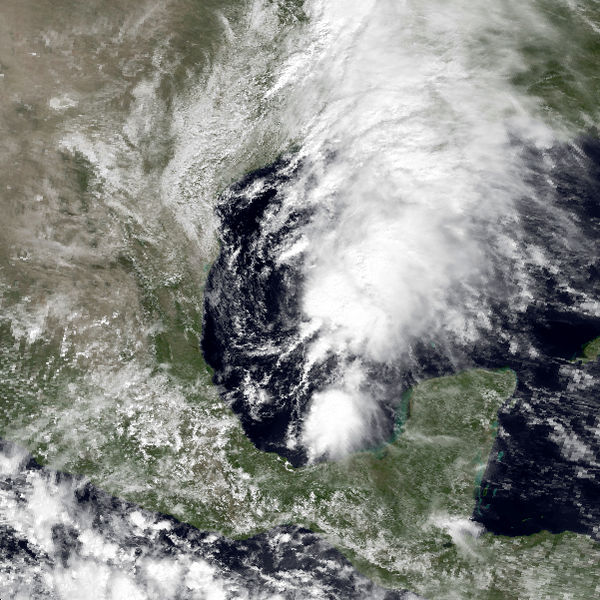
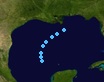
Tropical Storm Kate[]
| Tropical storm (SSHWS) | |
  | |
| Duration | October 19 – October 22 |
|---|---|
| Peak intensity | 50 mph (85 km/h) (1-min) 996 mbar (hPa) |
Tropical Storm Larry[]
| Tropical storm (SSHWS) | |
  | |
| Duration | October 31 – November 3 |
|---|---|
| Peak intensity | 40 mph (65 km/h) (1-min) 999 mbar (hPa) |
Timeline[]

Storm names[]
The following names will be used to name tropical and subtropical cyclones in the 2015 season.
|
|
|
Retirement[]
During the WMO meeting on April 13, 2016, the names Grace and Ida were officially retired Due to extensive damage and deaths. They were replaced by Gwen and Ivy for the 2021 season.
-The List for 2021-
|
|
|
Accumulated Cyclone Energy (ACE) Rating[]
| ACE (104 kt2) – Storm: Source | |||||
|---|---|---|---|---|---|
| 1 | 32.9 | Grace | 12 | 2.00 | Fred |
| 2 | 26.5 | Ida | 13 | 0.00 | Storm |
| 3 | 18.4 | Danny | 14 | 0.00 | Storm |
| 4 | 15.0 | Erika | 15 | 0.00 | Storm |
| 5 | 10.0 | Henri | 16 | 0.00 | Storm |
| 6 | 6.97 | Ana | 17 | 0.00 | Storm |
| 7 | 6.22 | Claudette | 18 | 0.00 | Storm |
| 8 | 4.95 | Bill | 19 | 0.00 | Storm |
| 9 | 4.28 | Kate | 20 | 0.00 | Storm |
| 10 | 3.18 | Joaquin | 21 | 0.00 | Storm |
| 11 | 2.39 | Larry | 22 | 0.00 | Storm |
| Total=132.79 | |||||
ACE is the result of a storm's winds multiplied by how long it lasted for, so storms or subtropical storms (Originally not included up until 2012) that at lasted a long time , as well as particularly strong hurricanes , have higher ACE totals. Tropical Depressions are not included in season total.
Season effects[]
This is a table of the storms and their effects in the 2015 Atlantic hurricane season. This table includes the storm's names, duration, peak intensity, Areas affected (bold indicates made landfall in that region at least once), damages, and death totals. Deaths in parentheses are additional and indirect (an example of an indirect death would be a traffic accident), but are still storm-related. Damage and deaths include totals while the storm was extratropical, a wave or a low. All of the damage figures are in 2015 USD (the listed damage figure is in millions).
| Storm name |
Dates active | Storm category at peak intensity |
Max 1-min wind mph (km/h) |
Min. press. (mbar) |
Areas affected | Damage (USD) |
Deaths |
|---|---|---|---|---|---|---|---|
| Ana | June 10 – June 16 | Category 1 hurricane | 75 (120) | 987 | None | 0 | 0 |
| Two | July 30 – August 1 | Tropical depression | 35 (55) | 1002 | None | 0 | 0 |
| Bill | August 17 – August 22 | Tropical storm | 60 (95) | 995 | None | 0 | 0 |
| Claudette | August 20 – August 25 | Tropical storm | 70 (110) | 986 | US East Coast (North Carolina) | 20 | 6 |
| Danny | August 26 – September 7 | Category 3 hurricane | 115 (185) | 959 | None | 0 | 0 |
| Six | August 31 – September 2 | Tropical depression | 35 (55) | 1004 | Mexico | 5 | 3 |
| Erika | September 1 – September 14 | Category 2 hurricane | 110 (175) | 960 | US Gulf Coast (Louisiana), Cuba, The Bahamas | 680 | 32 |
| Fred | September 7 – September 9 | Tropical storm | 40 (65) | 1000 | None | 0 | 0 |
| Grace | September 10 – September 24 | Category 5 hurricane | 165 (270) | 911 | US East Coast (North Carolina) | 17,300 | 189 |
| Ten | September 14 – September 16 | Tropical depression | 35 (55) | 1002 | None | 0 | 0 |
| Henri | September 20 – September 26 | Category 1 hurricane | 90 (150) | 971 | US Gulf Coast (Texas) | 490 | 20 |
| Ida | September 30 – October 12 | Category 4 hurricane | 145 (230) | 934 | Mexico | 1,000 | 200 |
| Joaquin | October 9 – October 13 | Subtropical storm | 45 (75) | 998 | None | 0 | 0 |
| Kate | October 19 – October 22 | Tropical storm | 50 (85) | 996 | The Bahamas, Cuba | 10 | 4 |
| Larry | October 31 – November 3 | Tropical storm | 40 (65) | 999 | US East Coast (Florida), The Bahamas | 10 | 4 |