The 2060 Atlantic hurricane season was a near normal season.
This season wrung in the 100th Anniversary of the Launch of Earth's first Weather Satellites, which were launched in 1959-1960.
Storms[]
Tropical Depression One[]
| Tropical depression (SSHWS) | |
 | |
| Duration | June 29 – June 30 |
|---|---|
| Peak intensity | 35 mph (55 km/h) (1-min) 1004 mbar (hPa) |
Hurricane Arturo[]
| Category 1 hurricane (SSHWS) | |
 | |
| Duration | August 1 – August 6 |
|---|---|
| Peak intensity | 85 mph (140 km/h) (1-min) 979 mbar (hPa) |
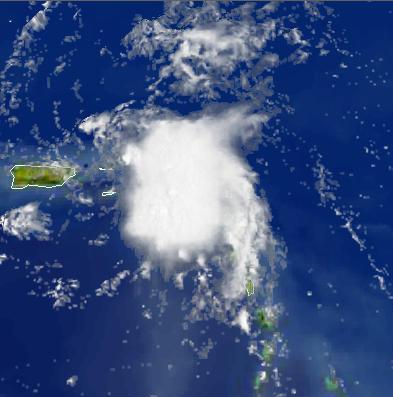
Tropical Storm Babs[]
| Tropical storm (SSHWS) | |
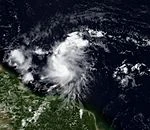 | |
| Duration | August 7 – August 11 |
|---|---|
| Peak intensity | 50 mph (85 km/h) (1-min) 996 mbar (hPa) |
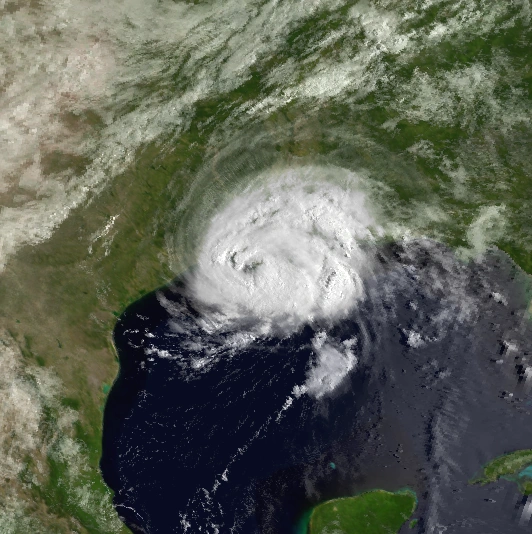
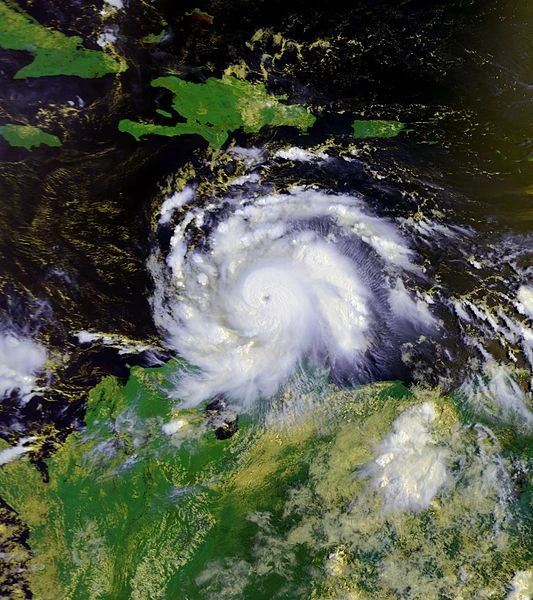
Hurricane Charlie[]
| Category 3 hurricane (SSHWS) | |
 | |
| Duration | August 14 – August 23 |
|---|---|
| Peak intensity | 120 mph (195 km/h) (1-min) 951 mbar (hPa) |
Hurricane Deidre[]
| Category 1 hurricane (SSHWS) | |
 | |
| Duration | August 16 – August 21 |
|---|---|
| Peak intensity | 75 mph (120 km/h) (1-min) 987 mbar (hPa) |
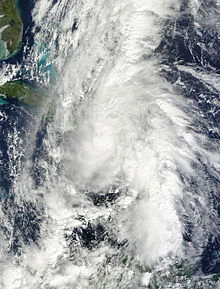
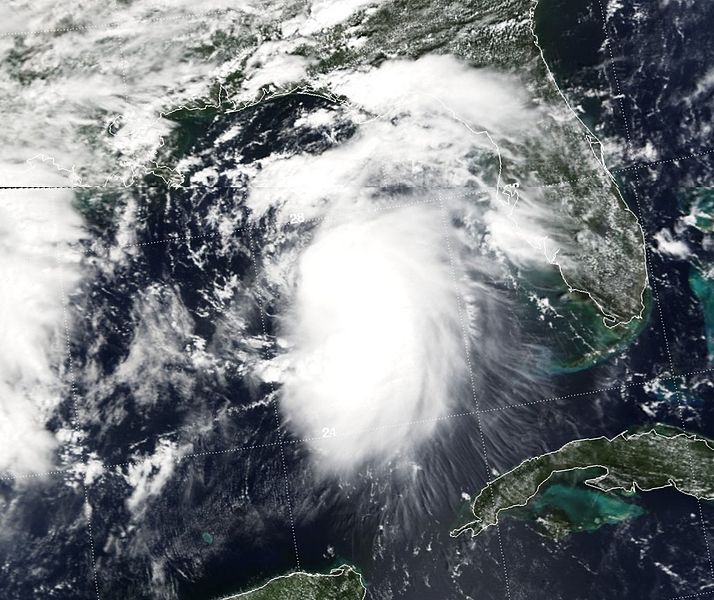
Tropical Storm Ethan[]
| Tropical storm (SSHWS) | |
 | |
| Duration | September 2 – September 6 |
|---|---|
| Peak intensity | 65 mph (100 km/h) (1-min) 994 mbar (hPa) |
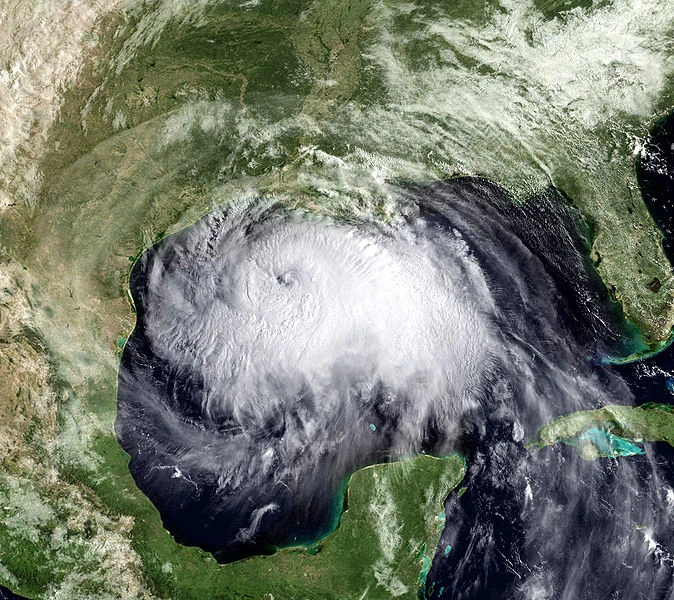
Hurricane Fernanda[]
| Category 4 hurricane (SSHWS) | |
 | |
| Duration | September 10 – September 21 |
|---|---|
| Peak intensity | 145 mph (230 km/h) (1-min) 936 mbar (hPa) |
Hurricane Grant[]
| Category 2 hurricane (SSHWS) | |
 | |
| Duration | September 23 – September 30 |
|---|---|
| Peak intensity | 110 mph (175 km/h) (1-min) 961 mbar (hPa) |
Tropical Depression Nine[]
| Tropical depression (SSHWS) | |
 | |
| Duration | September 29 – October 1 |
|---|---|
| Peak intensity | 35 mph (55 km/h) (1-min) 1003 mbar (hPa) |
Tropical Storm Hannah[]
| Tropical storm (SSHWS) | |
 | |
| Duration | November 30 – December 5 |
|---|---|
| Peak intensity | 70 mph (110 km/h) (1-min) 986 mbar (hPa) |
Timeline[]

Accumulated Cyclone Energy (ACE) Rating[]
| ACE (104 kt2) – Storm: Source | |||||
|---|---|---|---|---|---|
| 1 | 20.1 | Fernanda | 12 | 0.00 | Storm |
| 2 | 13.9 | Charlie | 13 | 0.00 | Storm |
| 3 | 10.5 | Grant | 14 | 0.00 | Storm |
| 4 | 7.16 | Arturo | 15 | 0.00 | Storm |
| 5 | 5.48 | Deidre | 16 | 0.00 | Storm |
| 6 | 5.02 | Storm | 17 | 0.00 | Storm |
| 7 | 3.75 | Ethan | 18 | 0.00 | Storm |
| 8 | 2.99 | Babs | 19 | 0.00 | Storm |
| 9 | 0.00 | Storm | 20 | 0.00 | Storm |
| 10 | 0.00 | Storm | 21 | 0.00 | Storm |
| 11 | 0.00 | Storm | 22 | 0.00 | Storm |
| Total=58.9 | |||||
ACE is the result of a storm's winds multiplied by how long it lasted for, so storms or subtropical storms (Originally not included up until 2012) that at lasted a long time , as well as particularly strong hurricanes , have higher ACE totals. Tropical Depressions are not included in season total.