The 2045 Atlantic hurricane season was semi active hurricane season, but saw mainly tropical storms even though it saw neutral conditions.
Seasonal forecasts[]
| Source | Date | Named
storms |
Hurricanes | Major
hurricanes | |
| TSR | November 29, 2044 | 8 | 2 | 1 | |
| WSI | December 31, 2044 | 10 | 3 | 0 | |
| CSU | March 15, 2045 | 9 | 3 | 1 | |
| TSR | April 21, 2045 | 12 | 4 | 1 | |
| TWC | May 9, 2045 | 11 | 5 | 1 | |
| UKMO | May 22, 2045 | 11 | 5 | 1 | |
| NOAA | June 1, 2045 | 3-10 | 0-2 | 0-1 | |
| FSU COAPS | June 14, 2045 | 9 | 4 | 0 | |
| CSU | June 25, 2045 | 11 | 5 | 1 | |
| TSR | July 13, 2045 | 10 | 3 | 0 | |
| NOAA | August 6, 2045 | 7-14 | 1-6 | 0-2 | |
| WSI | August 24, 2045 | 14 | 5 | 0 | |
| TSR | September 18, 2045 | 15 | 5 | 1 | |
| ––––––––––––––––––––––––––––––––––––––––––––––––––––––– | |||||
| Actual activity | 5 | 0 | 0 | ||
Storms[]
Tropical Storm Ana[]
| Tropical storm (SSHWS) | |
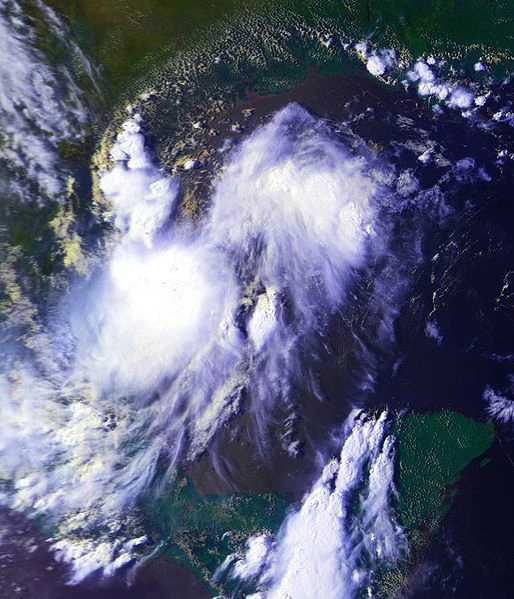 | |
| Duration | May 24 – May 28 |
|---|---|
| Peak intensity | 65 mph (100 km/h) (1-min) 990 mbar (hPa) |
Tropical Storm Bret[]
| Tropical storm (SSHWS) | |
 | |
| Duration | June 5 – June 9 |
|---|---|
| Peak intensity | 50 mph (85 km/h) (1-min) 1000 mbar (hPa) |
Tropical Storm Carrie[]
| Tropical storm (SSHWS) | |
 | |
| Duration | June 21 – June 25 |
|---|---|
| Peak intensity | 50 mph (85 km/h) (1-min) 1000 mbar (hPa) |
Subtropical Storm Dennis[]
| Subtropical storm (SSHWS) | |
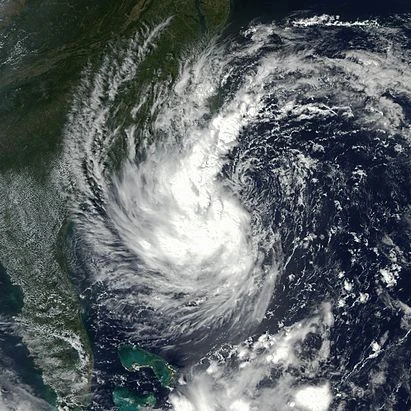 | |
| Duration | June 30 – July 4 |
|---|---|
| Peak intensity | 70 mph (110 km/h) (1-min) 988 mbar (hPa) |
Tropical Storm Elaine[]
| Tropical storm (SSHWS) | |
 | |
| Duration | July 10 – July 13 |
|---|---|
| Peak intensity | 40 mph (65 km/h) (1-min) 1000 mbar (hPa) |
Timeline[]

Accumulated Cyclone Energy (ACE) Rating[]
| ACE (104 kt2) – Storm: Source | |||||
|---|---|---|---|---|---|
| 1 | 0.00 | Storm | 12 | 0.00 | Storm |
| 2 | 0.00 | Storm | 13 | 0.00 | Storm |
| 3 | 0.00 | Storm | 14 | 0.00 | Storm |
| 4 | 0.00 | Storm | 15 | 0.00 | Storm |
| 5 | 0.00 | Storm | 16 | 0.00 | Storm |
| 6 | 0.00 | Storm | 17 | 0.00 | Storm |
| 7 | 0.00 | Storm | 18 | 0.00 | Storm |
| 8 | 0.00 | Storm | 19 | 0.00 | Storm |
| 9 | 0.00 | Storm | 20 | 0.00 | Storm |
| 10 | 0.00 | Storm | 21 | 0.00 | Storm |
| 11 | 0.00 | Storm | 22 | 0.00 | Storm |
| Total=0.00 | |||||
ACE is the result of a storm's winds multiplied by how long it lasted for, so storms or subtropical storms (Originally not included up until 2012) that at lasted a long time , as well as particularly strong hurricanes , have higher ACE totals. Tropical Depressions are not included in season totals.