The 2005 Atlantic hurricane season began on June 1, 2005 and ended November 30th, 2005.
Seasonal forecasts[]
| Source | Date | Named
storms |
Hurricanes | Major
hurricanes | |
| NOAA | May 31, 2005 | 15-19 | 7-11 | 1-5 | |
| ––––––––––––––––––––––––––––––––––––––––––––––––––––––– | |||||
| Actual activity | 16 | 9 | 5 | ||
Season Summary[]
The 2005 Atlantic hurricane season was an Somewhat Active Hurricane season primarily due to very low end La Nina Conditions.
This season was a little more active compared to 2003.
During the course of the season, there were 17 Depressions, 16 Named Storms, 9 Hurricanes and 5 Major Hurricanes.
In All, the season collectively caused $60.5 billion (USD) in damages and claimed 1,158 lives
Storms[]
|
Tropical Storm Arlene[]
| Tropical storm (SSHWS) | |
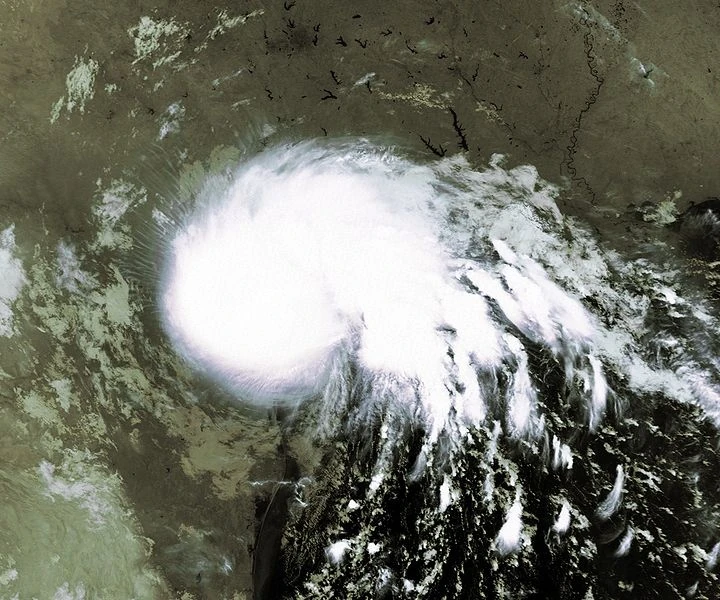  | |
| Duration | June 10 – June 14 |
|---|---|
| Peak intensity | 60 mph (95 km/h) (1-min) 995 mbar (hPa) |
Hurricane Bret[]
| Category 2 hurricane (SSHWS) | |
 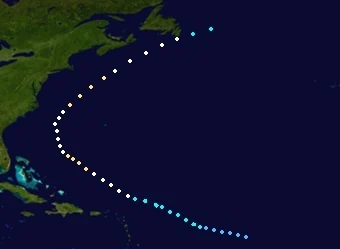 | |
| Duration | July 4 – July 18 |
|---|---|
| Peak intensity | 105 mph (165 km/h) (1-min) 962 mbar (hPa) |
Tropical Storm Cindy[]
| Tropical storm (SSHWS) | |
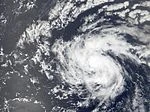  | |
| Duration | July 31 – August 4 |
|---|---|
| Peak intensity | 50 mph (85 km/h) (1-min) 996 mbar (hPa) |
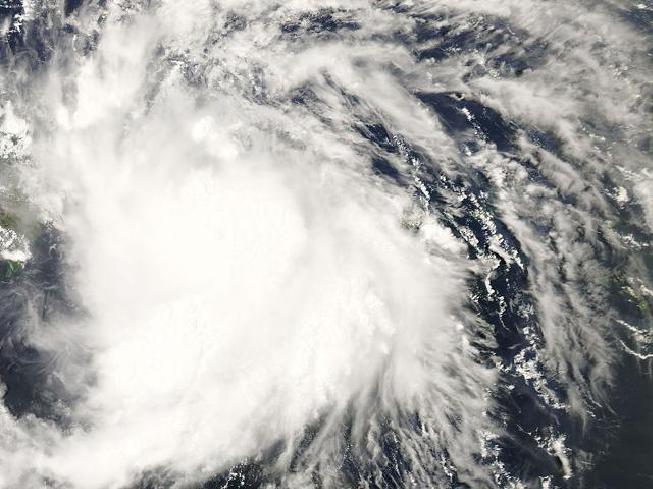
Hurricane Dennis[]
| Category 3 hurricane (SSHWS) | |
  | |
| Duration | August 6 – August 18 |
|---|---|
| Peak intensity | 125 mph (205 km/h) (1-min) 945 mbar (hPa) |
Hurricane Emily[]
| Category 1 hurricane (SSHWS) | |
  | |
| Duration | August 10 – August 16 |
|---|---|
| Peak intensity | 75 mph (120 km/h) (1-min) 987 mbar (hPa) |
Hurricane Franklin[]
| Category 2 hurricane (SSHWS) | |
  | |
| Duration | August 20 – August 31 |
|---|---|
| Peak intensity | 100 mph (155 km/h) (1-min) 969 mbar (hPa) |
Tropical Storm Gert[]
| Tropical storm (SSHWS) | |
  | |
| Duration | September 1 – September 6 |
|---|---|
| Peak intensity | 70 mph (110 km/h) (1-min) 989 mbar (hPa) |
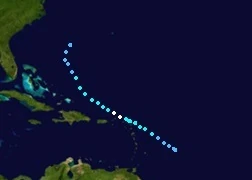
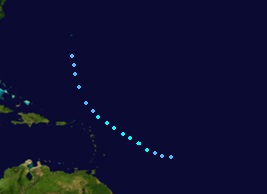
Hurricane Harvey[]
| Category 5 hurricane (SSHWS) | |
  | |
| Duration | September 10 – September 28 |
|---|---|
| Peak intensity | 160 mph (260 km/h) (1-min) 921 mbar (hPa) |
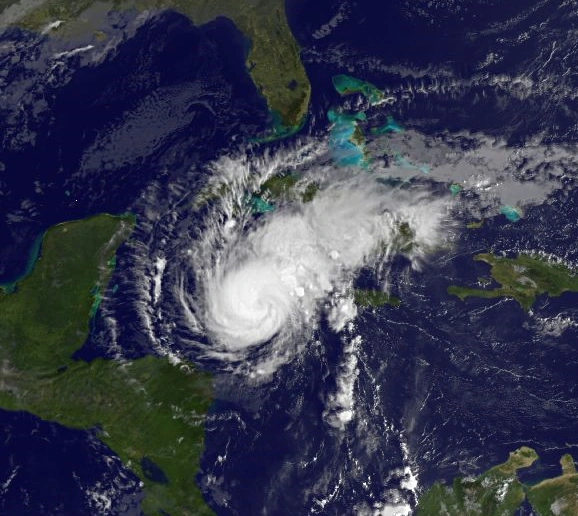
Hurricane Irene[]
| Category 4 hurricane (SSHWS) | |
  | |
| Duration | September 10 – September 21 |
|---|---|
| Peak intensity | 145 mph (230 km/h) (1-min) 934 mbar (hPa) |
Tropical Storm Jose[]
| Tropical storm (SSHWS) | |
  | |
| Duration | September 17 – September 24 |
|---|---|
| Peak intensity | 65 mph (100 km/h) (1-min) 989 mbar (hPa) |
Tropical Storm Katia[]
| Tropical storm (SSHWS) | |
  | |
| Duration | September 27 – October 2 |
|---|---|
| Peak intensity | 50 mph (85 km/h) (1-min) 996 mbar (hPa) |
Hurricane Lee[]
| Category 1 hurricane (SSHWS) | |
  | |
| Duration | September 30 – October 6 |
|---|---|
| Peak intensity | 85 mph (140 km/h) (1-min) 979 mbar (hPa) |
Tropical Storm Maria[]
| Tropical storm (SSHWS) | |
  | |
| Duration | September 30 – October 4 |
|---|---|
| Peak intensity | 50 mph (85 km/h) (1-min) 996 mbar (hPa) |
Tropical Depression Fourteen[]
| Tropical depression (SSHWS) | |
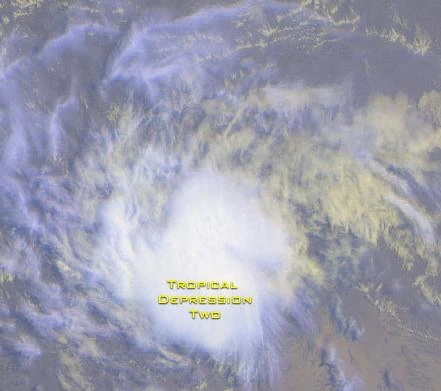  | |
| Duration | September 30 – October 3 |
|---|---|
| Peak intensity | 35 mph (55 km/h) (1-min) 1002 mbar (hPa) |
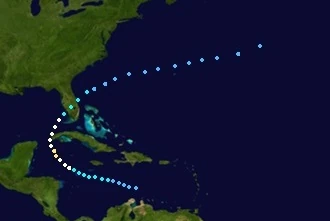
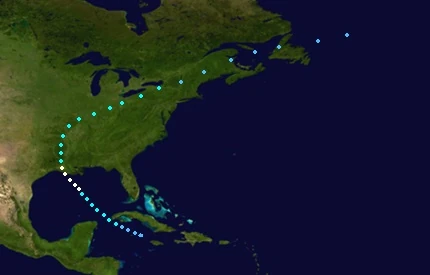
Hurricane Nate[]
| Category 4 hurricane (SSHWS) | |
  | |
| Duration | October 11 – October 28 |
|---|---|
| Peak intensity | 150 mph (240 km/h) (1-min) 930 mbar (hPa) |
Tropical Storm Ophelia[]
| Tropical storm (SSHWS) | |
  | |
| Duration | October 19 – October 24 |
|---|---|
| Peak intensity | 50 mph (85 km/h) (1-min) 997 mbar (hPa) |
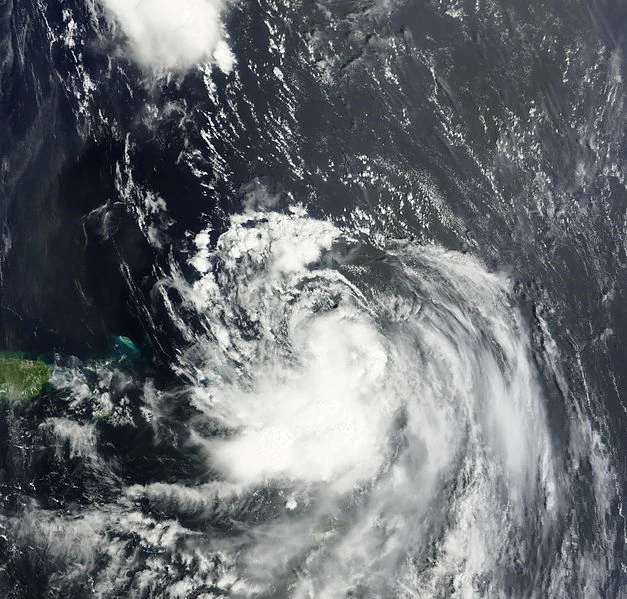
Hurricane Philippe[]
| Category 3 hurricane (SSHWS) | |
  | |
| Duration | October 31 – November 7 |
|---|---|
| Peak intensity | 115 mph (185 km/h) (1-min) 960 mbar (hPa) |
Timeline[]

Storm names[]
The following names will be used to name tropical and subtropical cyclones in the 2005 season.
|
|
|
Retirement[]
During the WMO meeting on April 20, 2018, the names Irene and Nate were officially retired Due to the Damage and Deaths they've caused. They were replaced by Irma and Nathan for the 2017 season.
-The List for 2017-
|
|
|
Accumulated Cyclone Energy (ACE) Rating[]
| ACE (104 kt2) – Storm: Source | |||||
|---|---|---|---|---|---|
| 1 | 41.0 | Harvey | 12 | 5.22 | Arlene |
| 2 | 36.5 | Nate | 13 | 5.02 | Cindy |
| 3 | 30.7 | Irene | 14 | 5.00 | Katrina |
| 4 | 20.9 | Dennis | 15 | 4.74 | Maria |
| 5 | 15.5 | Philippe | 16 | 4.44 | Ophelia |
| 6 | 10.5 | Bret | 17 | 0.00 | Storm |
| 7 | 10.0 | Franklin | 18 | 0.00 | Storm |
| 8 | 7.10 | Lee | 19 | 0.00 | Storm |
| 9 | 6.90 | Emily | 20 | 0.00 | Storm |
| 10 | 6.05 | Gert | 21 | 0.00 | Storm |
| 11 | 6.00 | Jose | 22 | 0.00 | Storm |
| Total=215.57 | |||||
ACE is the result of a storm's winds multiplied by how long it lasted for, so storms or subtropical storms (Originally not included up until 2012) that at lasted a long time , as well as particularly strong hurricanes , have higher ACE totals. Tropical Depressions are not included in season total.
Season effects[]
This is a table of the storms and their effects in the 2005 Atlantic hurricane season. This table includes the storm's names, duration, peak intensity, Areas affected (bold indicates made landfall in that region at least once), damages, and death totals. Deaths in parentheses are additional and indirect (an example of an indirect death would be a traffic accident), but are still storm-related. Damage and deaths include totals while the storm was extratropical, a wave or a low. All of the damage figures are in 2016 USD (the listed damage figure is in millions).
| Storm name |
Dates active | Storm category at peak intensity |
Max 1-min wind mph (km/h) |
Min. press. (mbar) |
Areas affected | Damage (USD) |
Deaths | |||
|---|---|---|---|---|---|---|---|---|---|---|
| Arlene | June 10 – June 14 | Tropical storm | 60 (100) | 995 | US Gulf Coast (Texas) | 65 | 10 | |||
| Bret | July 4 – July 18 | Category 2 hurricane | 105 (165) | 962 | Newfoundland | 5 | 5 | |||
| Cindy | July 31 – August 4 | Tropical storm | 50 (100) | 996 | None | 0 | 0 | |||
| Dennis | August 6 – August 18 | Category 3 hurricane | 125 (205) | 945 | None | 0 | 0 | |||
| Emily | August 10 – August 16 | Category 1 hurricane | 75 (120) | 987 | None | 0 | 0 | |||
| Franklin | August 20 – August 31 | Category 2 hurricane | 100 (155) | 969 | US Gulf Coast (Florida), Cuba | 190 | 12 | |||
| Gert | September 1 – September 6 | Tropical storm | 70 (110) | 989 | None | 0 | 0 | |||
| Harvey | September 10 – September 28 | Category 5 hurricane | 160 (260) | 921 | Newfoundland | 25 | 7 | |||
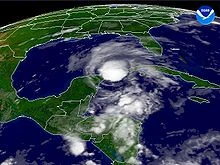
| Irene | September 10 – September 21 | Category 4 hurricane | 140 (220) | 939 | US Gulf Coast (Alabama) (Florida), Cuba, The Bahamas | 25,000 | 261 | |||
| Jose | September 17 – September 24 | Tropical storm | 65 (100) | 989 | None | 0 | 0 | |||
| Katrina | September 27 – October 2 | Tropical storm | 50 (85) | 996 | None | 0 | 0 | |||
| Lee | September 30 – October 6 | Category 1 hurricane | 85 (140) | 979 | US Gulf Coast (Lousiana), Mexico, Cuba | 1,000 | 88 | |||
| Fourteen | September 30 – October 3 | Tropical depression | 35 (55) | 1002 | None | 0 | 0 | |||
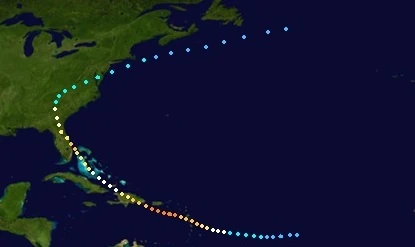
| Nate | October 11 – October 28 | Category 4 hurricane | 150 (240) | 930 | US East Coast (Florida), The Bahamas, Cuba, Hispaniola, Puerto Rico | 33,620 | 750 | |||
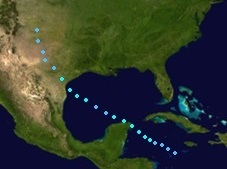
| Ophelia | October 19 – October 24 | Tropical storm | 50 (85) | 997 | US Gulf Coast (Texas), Mexico | 120 | 9 | |||
| Philippe | October 31 – November 7 | Category 3 hurricane | 115 (185) | 960 | Hispaniola | 500 | 20 | |||
| Season aggregates | ||||||||||
| 17 systems | June 10 – November 7 | 160 (260) | 921 | $60.5 billion | 1,158 | |||||