The 2050 Atlantic hurricane season was an active season.
Storms[]
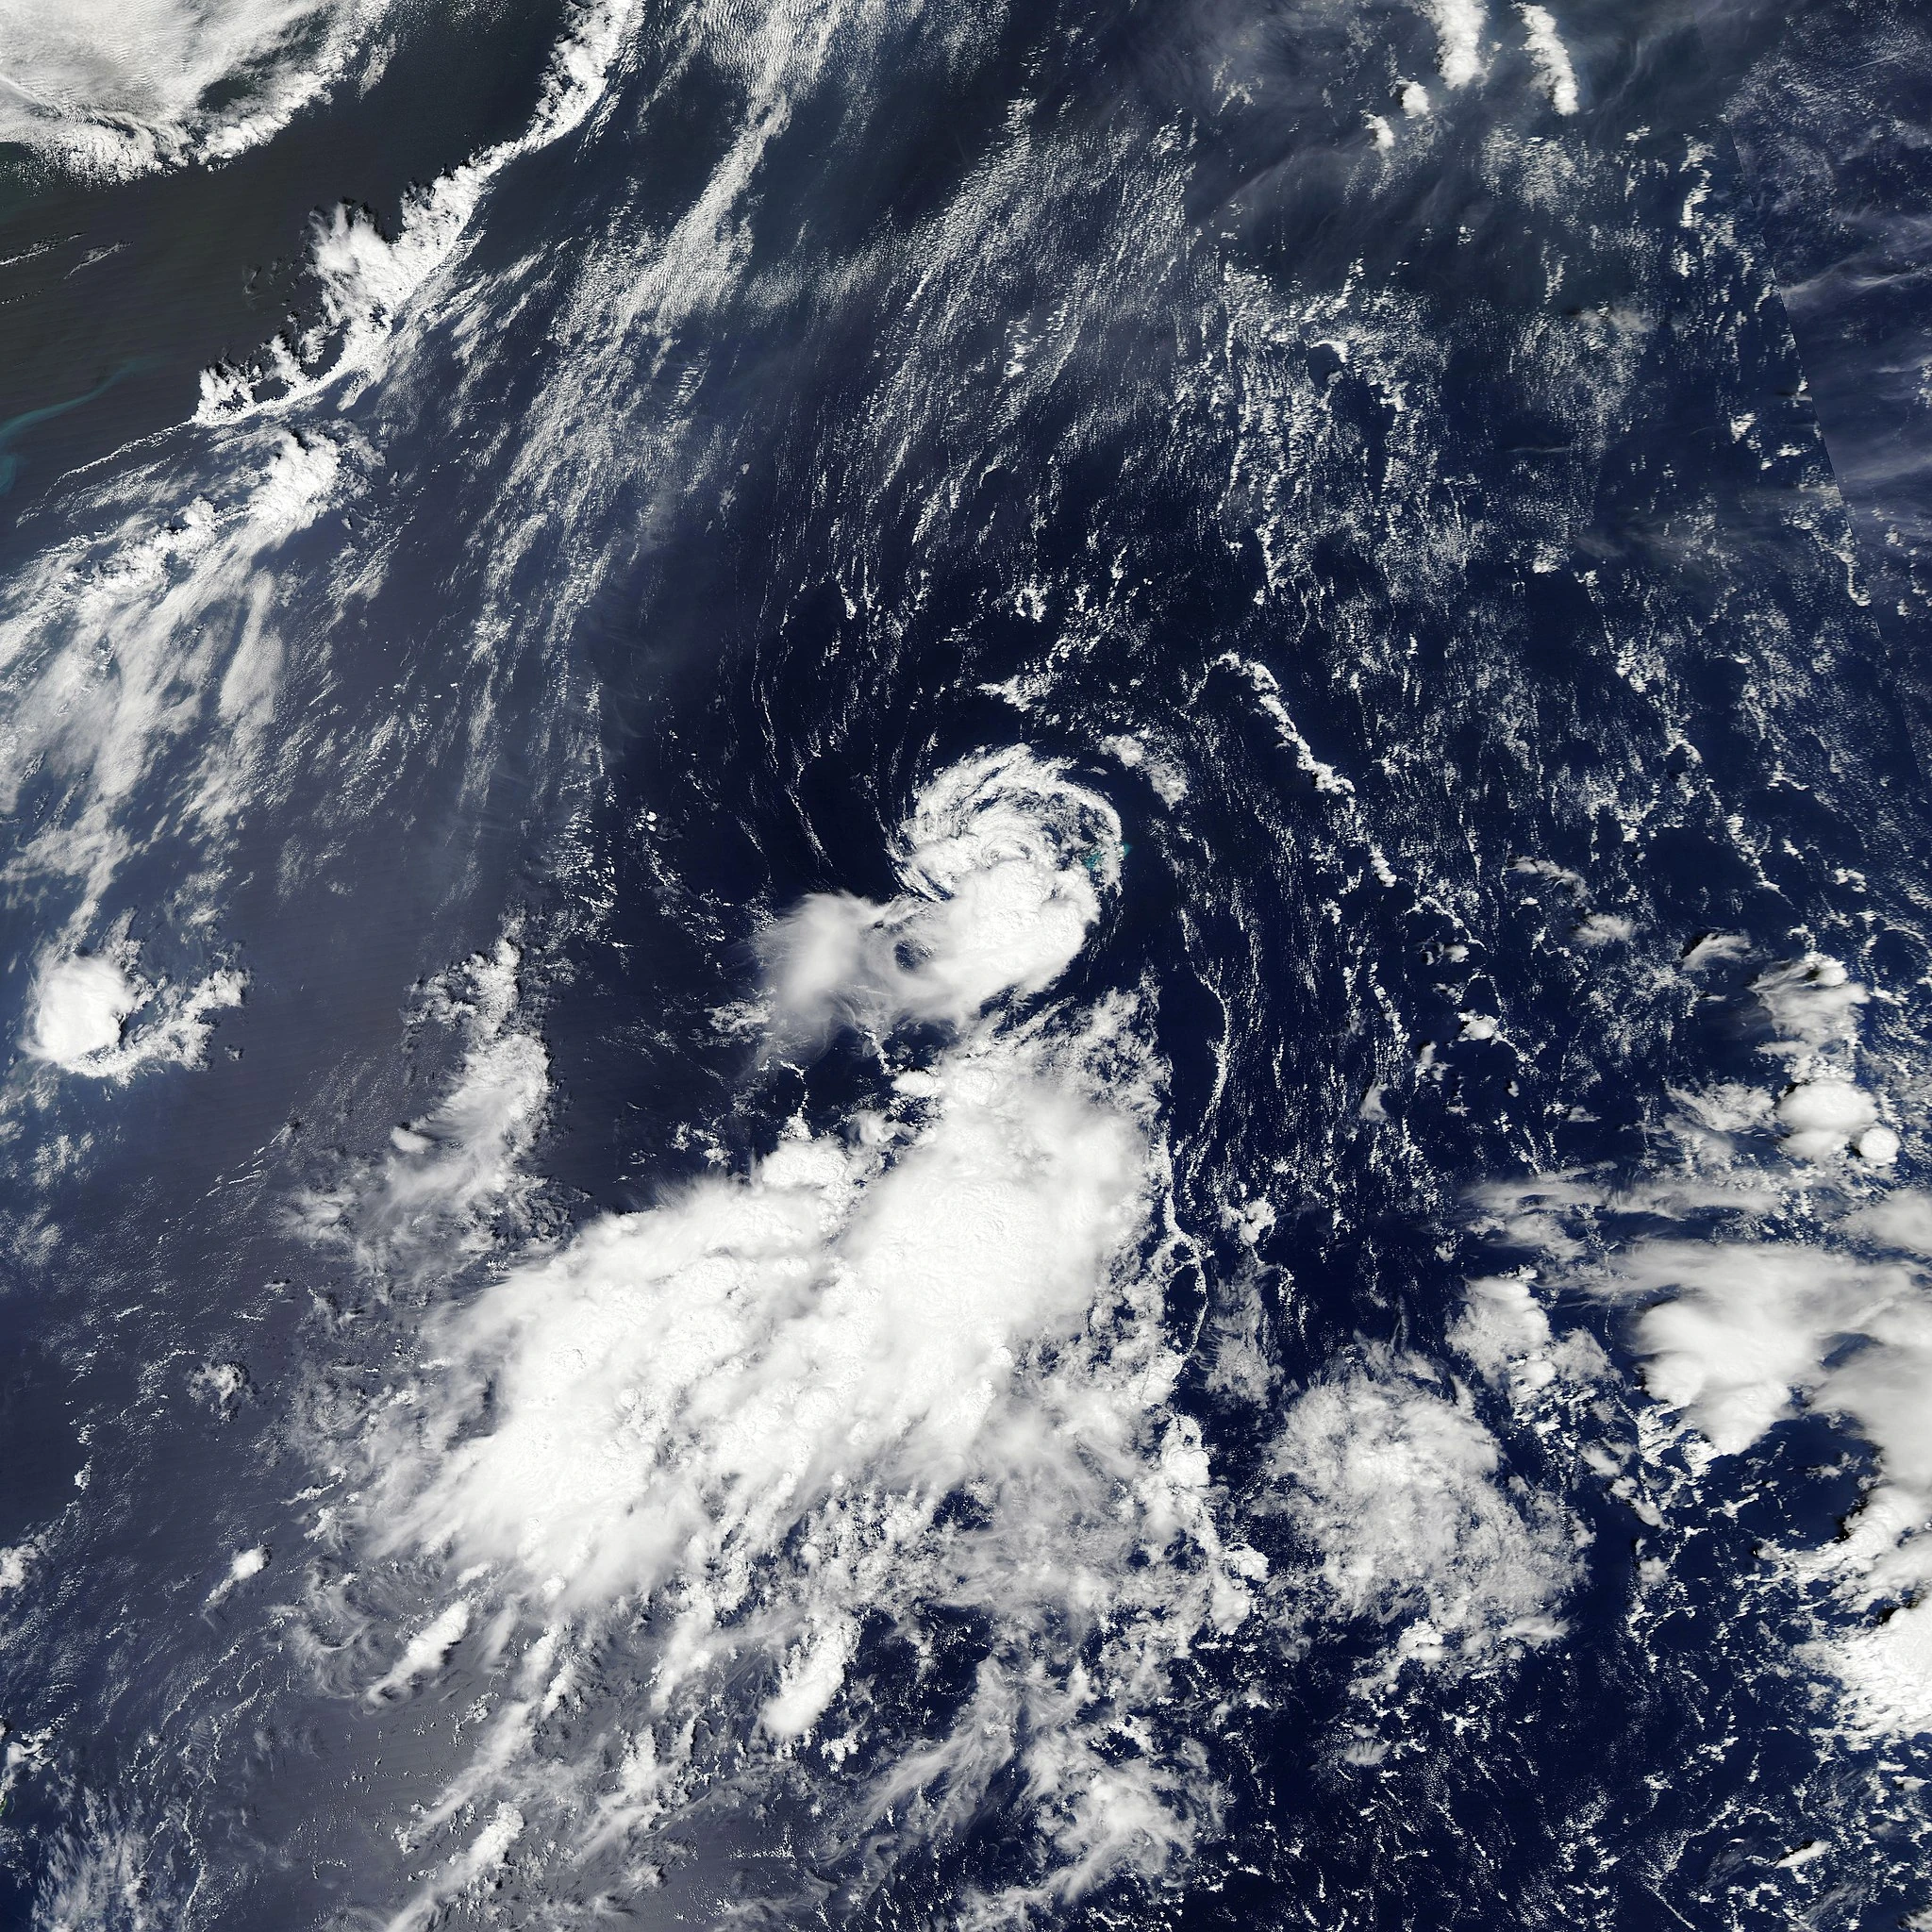
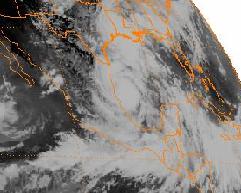
Tropical Storm Alberto[]
| Tropical storm (SSHWS) | |
 | |
| Duration | May 18 – May 20 |
|---|---|
| Peak intensity | 45 mph (75 km/h) (1-min) 1000 mbar (hPa) |
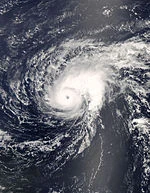
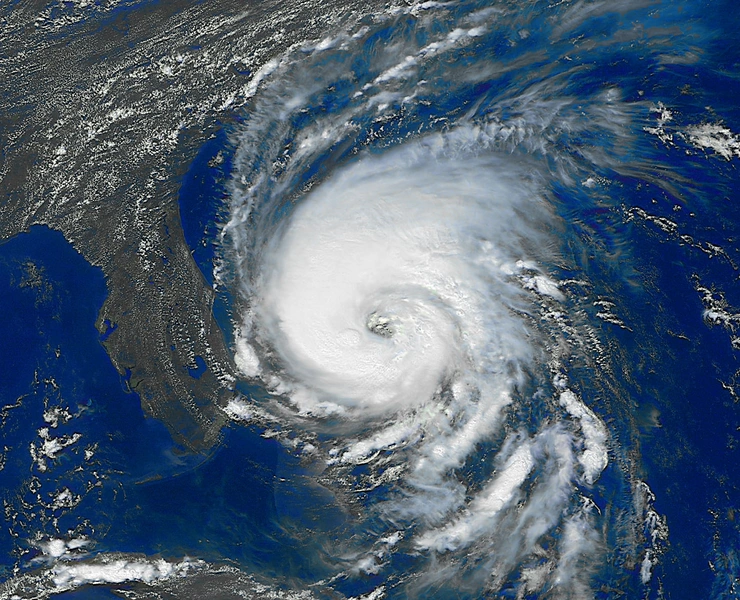
Hurricane Brandy[]
| Category 3 hurricane (SSHWS) | |
 | |
| Duration | June 15 – June 21 |
|---|---|
| Peak intensity | 115 mph (185 km/h) (1-min) 956 mbar (hPa) |
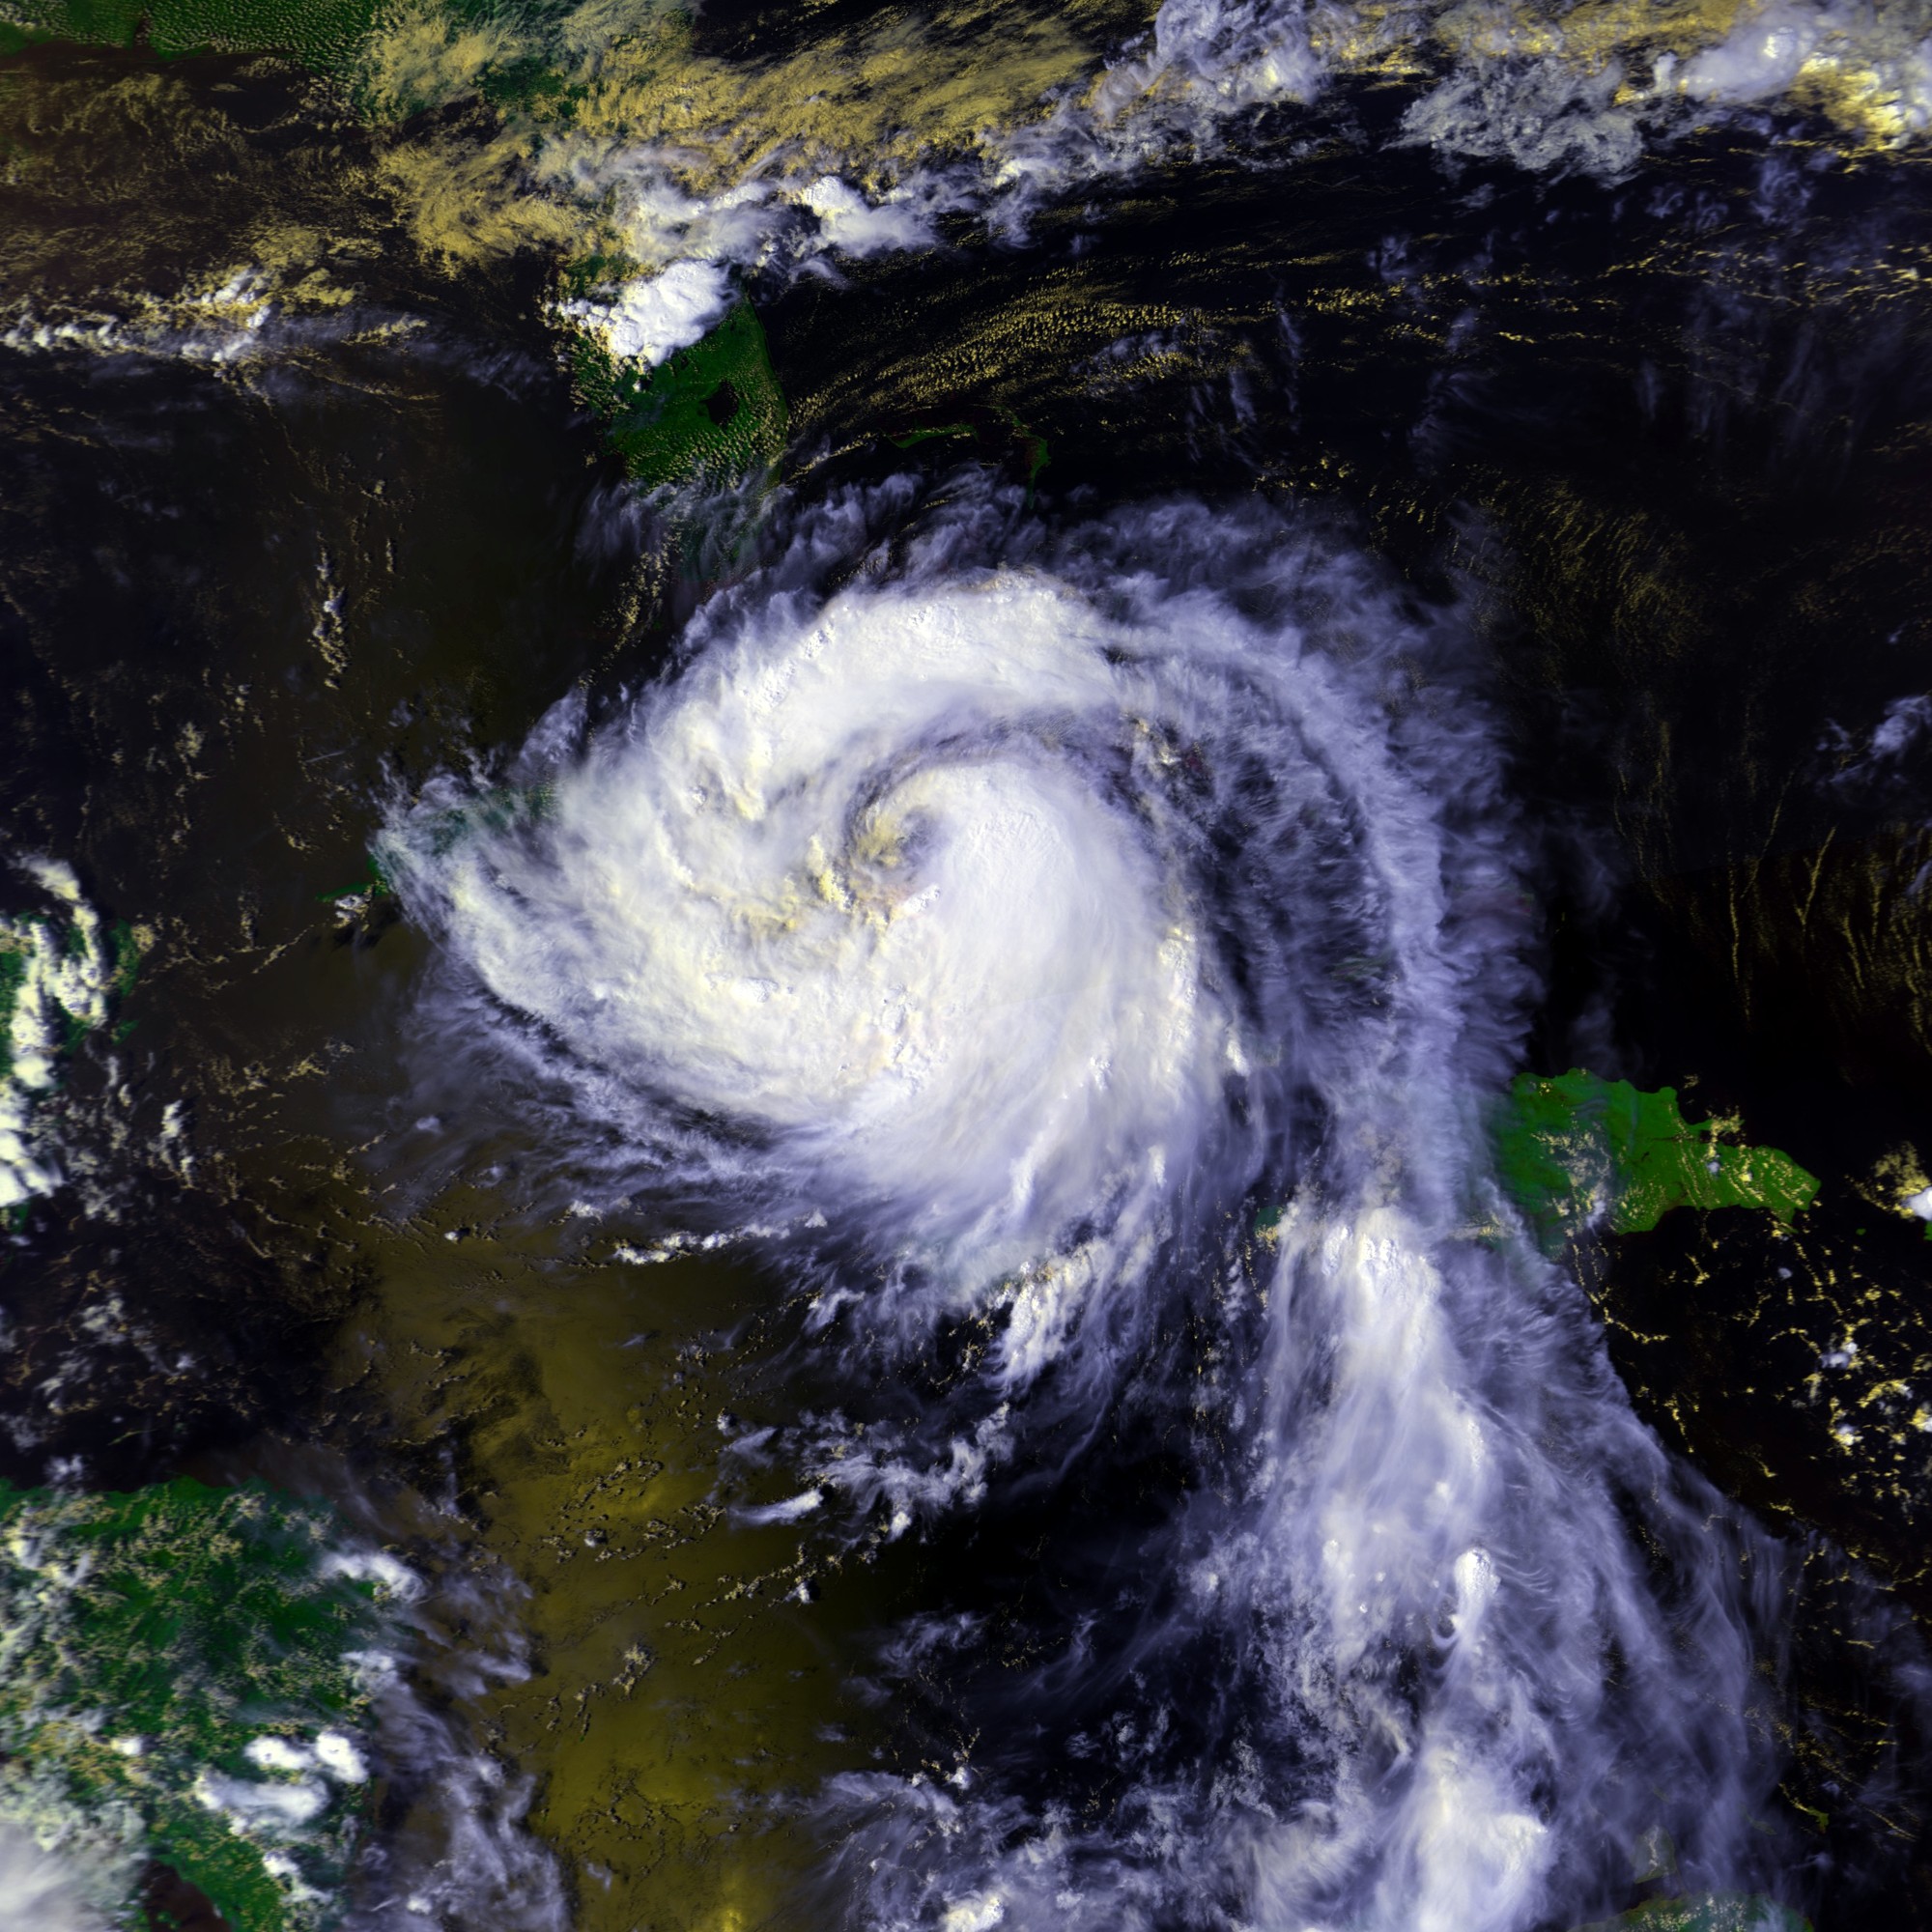
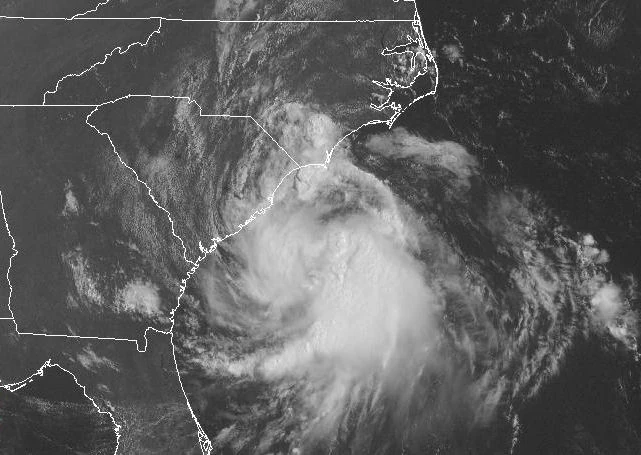
Tropical Storm Chad[]
| Tropical storm (SSHWS) | |
 | |
| Duration | June 23 – June 26 |
|---|---|
| Peak intensity | 70 mph (110 km/h) (1-min) 985 mbar (hPa) |
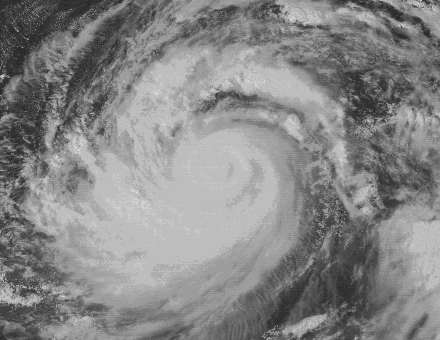
Tropical Storm Diana[]
| Tropical storm (SSHWS) | |
 | |
| Duration | July 4 – July 7 |
|---|---|
| Peak intensity | 50 mph (85 km/h) (1-min) 996 mbar (hPa) |
Tropical Depression Five[]
| Tropical depression (SSHWS) | |
 | |
| Duration | July 12 – July 14 |
|---|---|
| Peak intensity | 35 mph (55 km/h) (1-min) 1006 mbar (hPa) |
Hurricane Ethan[]
| Category 2 hurricane (SSHWS) | |
 | |
| Duration | July 18 – July 24 |
|---|---|
| Peak intensity | 110 mph (175 km/h) (1-min) 963 mbar (hPa) |
Hurricane Florence[]
| Category 1 hurricane (SSHWS) | |
 | |
| Duration | July 20 – July 25 |
|---|---|
| Peak intensity | 85 mph (140 km/h) (1-min) 973 mbar (hPa) |
Hurricane Gaston[]
| Category 4 hurricane (SSHWS) | |
 | |
| Duration | August 1 – August 11 |
|---|---|
| Peak intensity | 145 mph (230 km/h) (1-min) 936 mbar (hPa) |
Tropical Storm Helena[]
| Tropical storm (SSHWS) | |
 | |
| Duration | August 6 – August 9 |
|---|---|
| Peak intensity | 45 mph (75 km/h) (1-min) 1000 mbar (hPa) |
Hurricane Isaac[]
| Category 5 hurricane (SSHWS) | |
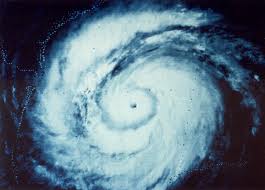 | |
| Duration | August 13 – August 30 |
|---|---|
| Peak intensity | 175 mph (280 km/h) (1-min) 901 mbar (hPa) |
Tropical Storm Julie[]
| Tropical storm (SSHWS) | |
 | |
| Duration | August 17 – August 19 |
|---|---|
| Peak intensity | 40 mph (65 km/h) (1-min) 1001 mbar (hPa) |
Hurricane Kevin[]
| Category 2 hurricane (SSHWS) | |
 | |
| Duration | August 22 – August 30 |
|---|---|
| Peak intensity | 110 mph (175 km/h) (1-min) 964 mbar (hPa) |
Hurricane Lauren[]
| Category 1 hurricane (SSHWS) | |
 | |
| Duration | August 27 – September 2 |
|---|---|
| Peak intensity | 80 mph (130 km/h) (1-min) 984 mbar (hPa) |
Tropical Depression Fourteen[]
| Tropical depression (SSHWS) | |
 | |
| Duration | August 30 – September 1 |
|---|---|
| Peak intensity | 35 mph (55 km/h) (1-min) 1004 mbar (hPa) |
Hurricane Mike[]
| Category 1 hurricane (SSHWS) | |
 | |
| Duration | August 31 – September 6 |
|---|---|
| Peak intensity | 90 mph (150 km/h) (1-min) 972 mbar (hPa) |
Timeline[]

Accumulated Cyclone Energy (ACE) Rating[]
| ACE (104 kt2) – Storm: Source | |||||
|---|---|---|---|---|---|
| 1 | 0.00 | Storm | 12 | 0.00 | Storm |
| 2 | 0.00 | Storm | 13 | 0.00 | Storm |
| 3 | 0.00 | Storm | 14 | 0.00 | Storm |
| 4 | 0.00 | Storm | 15 | 0.00 | Storm |
| 5 | 0.00 | Storm | 16 | 0.00 | Storm |
| 6 | 0.00 | Storm | 17 | 0.00 | Storm |
| 7 | 0.00 | Storm | 18 | 0.00 | Storm |
| 8 | 0.00 | Storm | 19 | 0.00 | Storm |
| 9 | 0.00 | Storm | 20 | 0.00 | Storm |
| 10 | 0.00 | Storm | 21 | 0.00 | Storm |
| 11 | 0.00 | Storm | 22 | 0.00 | Storm |
| Total=0.0 | |||||
ACE is the result of a storm's winds multiplied by how long it lasted for, so storms or subtropical storms (Originally not included up until 2012) that at lasted a long time , as well as particularly strong hurricanes , have higher ACE totals. Tropical Depressions are not included in season total.