The 2018 Atlantic hurricane season was a relatively active season.
Storms[]
Hurricane Alberto[]
| Category 2 hurricane (SSHWS) | |
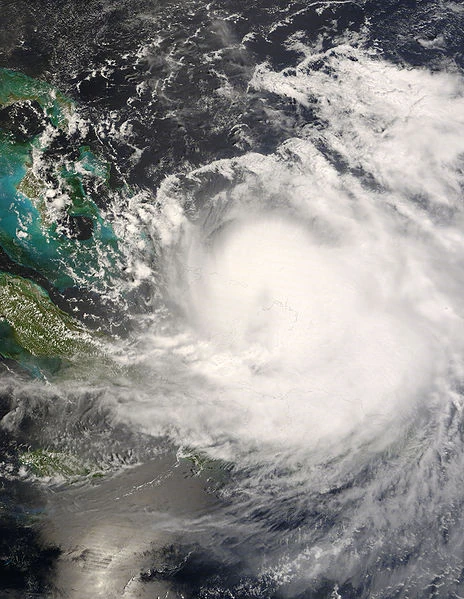 | |
| Duration | May 21 – May 29 |
|---|---|
| Peak intensity | 105 mph (165 km/h) (1-min) 963 mbar (hPa) |
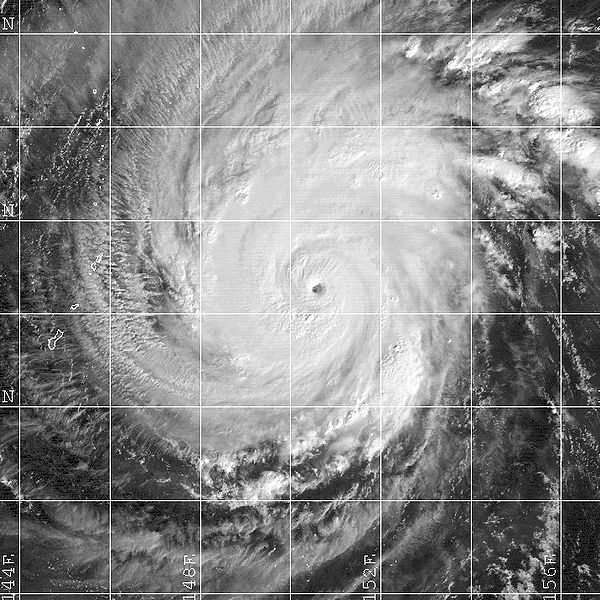
Hurricane Beryl[]
| Category 5 hurricane (SSHWS) | |
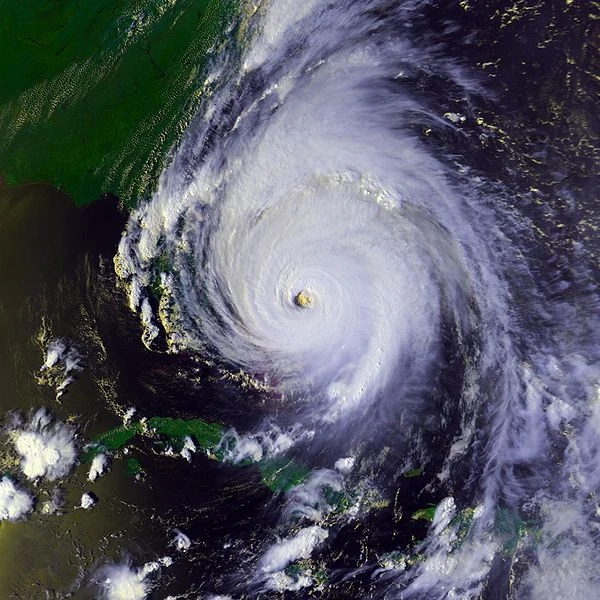 | |
| Duration | June 15 – June 30 |
|---|---|
| Peak intensity | 160 mph (260 km/h) (1-min) 920 mbar (hPa) |
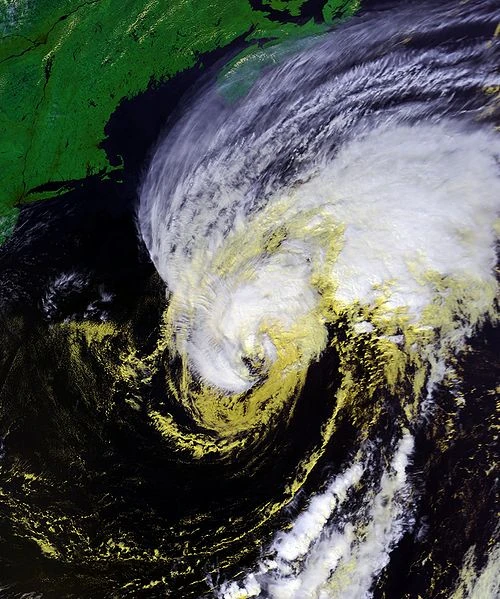
Hurricane Chris[]
| Category 2 hurricane (SSHWS) | |
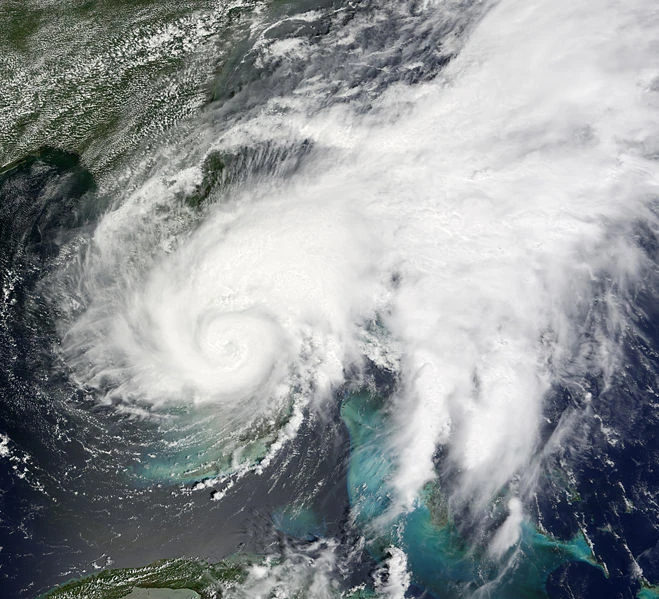 | |
| Duration | June 23 – June 29 |
|---|---|
| Peak intensity | 100 mph (155 km/h) (1-min) 970 mbar (hPa) |
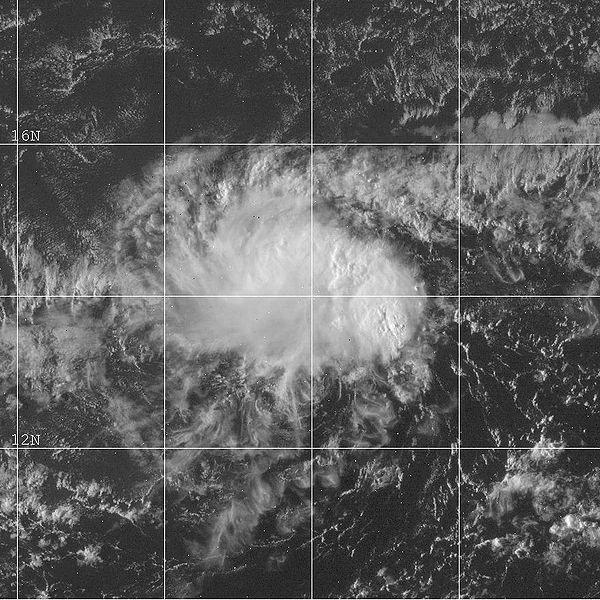
Tropical Storm Debby[]
| Tropical storm (SSHWS) | |
 | |
| Duration | June 28 – July 2 |
|---|---|
| Peak intensity | 45 mph (75 km/h) (1-min) 997 mbar (hPa) |
Tropical Storm Ernesto[]
| Tropical storm (SSHWS) | |
 | |
| Duration | July 7 – July 13 |
|---|---|
| Peak intensity | 65 mph (100 km/h) (1-min) 992 mbar (hPa) |
Hurricane Florence[]
| Category 4 hurricane (SSHWS) | |
 | |
| Duration | July 11 – July 25 |
|---|---|
| Peak intensity | 145 mph (230 km/h) (1-min) 937 mbar (hPa) |
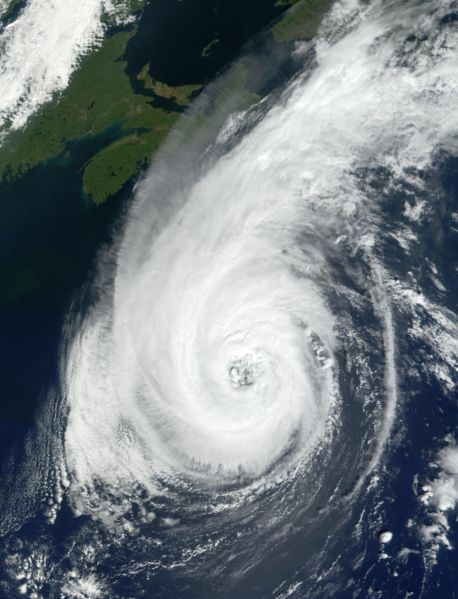
Hurricane Gordon[]
| Category 2 hurricane (SSHWS) | |
 | |
| Duration | July 16 – July 24 |
|---|---|
| Peak intensity | 100 mph (155 km/h) (1-min) 971 mbar (hPa) |
Hurricane Helene[]
| Category 4 hurricane (SSHWS) | |
 | |
| Duration | July 27 – August 10 |
|---|---|
| Peak intensity | 140 mph (220 km/h) (1-min) 940 mbar (hPa) |
Timeline[]

Accumulated Cyclone Energy (ACE) Rating[]
| ACE (104 kt2) – Storm: Source | |||||
|---|---|---|---|---|---|
| 1 | 19.74 | Beryl | 12 | 0.00 | Storm |
| 2 | 16.50 | Florence | 13 | 0.00 | Storm |
| 3 | 15.10 | Helene | 14 | 0.00 | Storm |
| 4 | 10.01 | Alberto | 15 | 0.00 | Storm |
| 5 | 8.82 | Chris | 16 | 0.00 | Storm |
| 6 | 4.61 | Gordon | 17 | 0.00 | Storm |
| 7 | 2.97 | Ernesto | 18 | 0.00 | Storm |
| 8 | 2.23 | Debby | 19 | 0.00 | Storm |
| 9 | 0.00 | Storm | 20 | 0.00 | Storm |
| 10 | 0.00 | Storm | 21 | 0.00 | Storm |
| 11 | 0.00 | Storm | |||
| Total=79.98 (80) | |||||
ACE is the result of a storm's winds multiplied by how long it lasted for, so storms that lasted a long time , as well as particularly strong hurricanes , have higher ACE totals. 2018 was active in these terms; with an ACE total of 260. Tropical Depressions and Subtropical storms are not included in season totals.
Season effects[]
This is a table of the storms and their effects in the 2018 Atlantic hurricane season. This table includes the storm's names, duration, peak intensity, Areas affected (bold indicates made landfall in that region at least once), damages, and death totals. Deaths in parentheses are additional and indirect (an example of an indirect death would be a traffic accident), but are still storm-related. Damage and deaths include totals while the storm was extratropical, a wave or a low. All of the damage figures are in 2018 USD (the listed damage figure is in millions).
| Storm name |
Dates active | Storm category at peak intensity |
Max 1-min wind mph (km/h) |
Min. press. (mbar) |
Areas affected | Damage (USD) |
Deaths |
|---|---|---|---|---|---|---|---|
| Alberto | May 9 – May 11 | Category 2 hurricane | 105 (165) | 963 | Florida, Bahamas, Dominican republic, Puerto rico | 250 | 11 |
| Beryl | June 15 – June 30 | Category 5 hurricane | 160 (260) | 920 | New York, The Carolinas, Florida, Bahamas, Dominican republic, Puerto rico | 17,000 | 291 |
| Chris | June 23 – June 29 | Category 2 hurricane | 100 (155) | 970 | New York, The Carolinas, Florida, Cuba, Mexico, Jamaica, Dominican republic | 4,500 | 100 |
| Debby | June 28 – July 2 | Tropical storm | 45 (75) | 997 | Cape Verde Islands | 0 | 0 |
| Ernesto | July 7 – July 13 | Tropical storm | 65 (100) | 992 | Cape Verde Islands | 0 | 0 |
| Florence | July 11 – July 25 | Category 4 hurricane | 145 (230) | 937 | Florida, Dominican republic, Puerto Rico, lesser Antilles, cape Verde islands | 7,100 | 115 |
| Gordon | July 16 – July 24 | Category 2 hurricane | 100 (155) | 971 | Bermuda, Nova Scotia, iceland | 70 | 6 |
| Helene | July 27 – August 10 | Category 4 hurricane | 140 (220) | 940 | Bermuda, Nova Scotia, iceland | 90 | 10 |