The 2018 Pacific hurricane season was an above average season which had many records broken, and even shattered.
Seasonal Summary[]
The 2018 Pacific hurricane season was a record-breaking and shattering season.
It bore some similarities to the 1992 Pacific hurricane season. Except the 2018 Pacific season had at least one Category-5 storm, whereas 1992 did not.
This season saw up to 27 Tropical/Subtropical Cyclones, 24 of which become Named Tropical/Subtropical Storms, 16 of which became hurricanes, one of which was in the central Pacific, something not seen since 2009. And an additional and record-breaking 11 became major hurricanes of Category-3 or higher.
This season broke and even shattered many records.
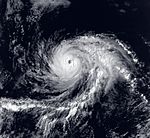
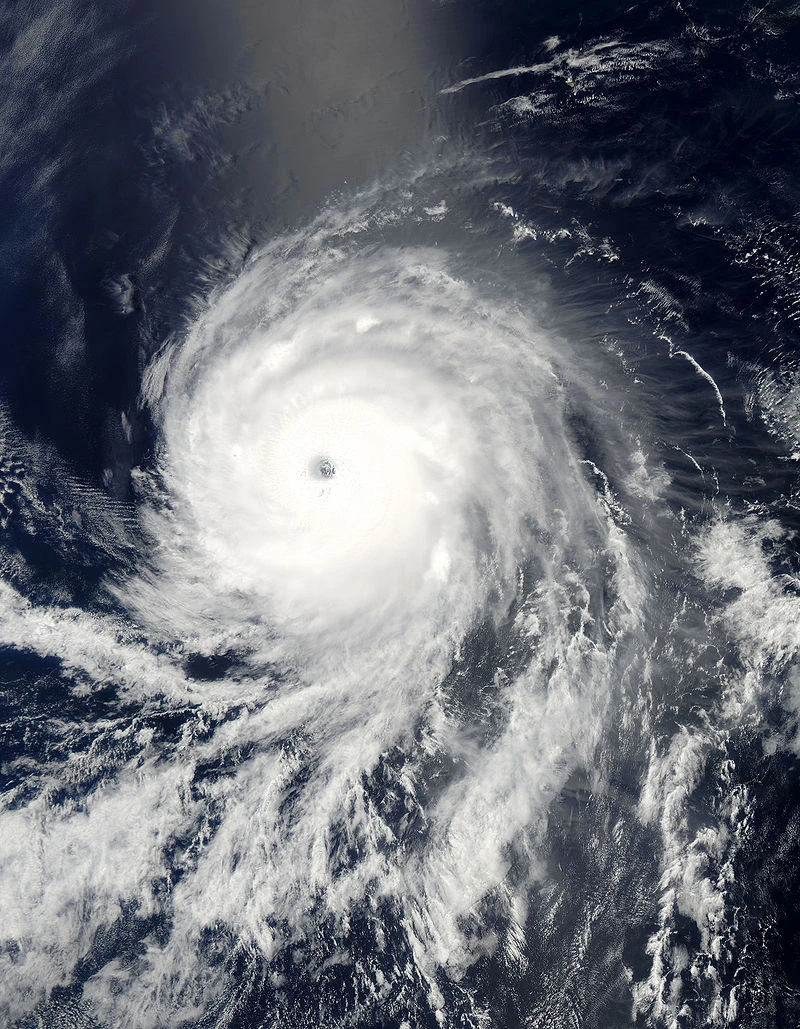
Hurricane Norman Shattered the record for strongest Eastern Pacific hurricane, Beating 1997's Hurricane Linda by 5 mph and 19 millibars. It also broke the eastern Pacific record for maintaining Category-5 status for 72 to 78 hours. And Sustaining 190 mph (305 km/h) winds for 30 hours straight. Not to mention the pressure drop from 957 millibars to 889 millibars in only 18 to 24 hours. As well as hitting the big island of Hawaii as a 100 mph hurricane.
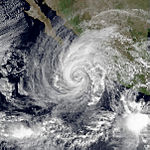
Hurricane Daniel became one of the first storms to survive long enough in a far north movement to make landfall in California as a still fully tropical storm with a record strong wind speed (for the eastern Pacific and west coast) of 65 mph (100 km/h). This shattered the previous record held by the Norman of 1978, which was only a weak Tropical Depression at its California landfall.
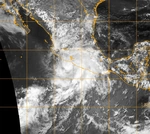
Hurricane Aletta's Category-4 peak intensity was one of the earliest and strongest May major hurricanes on record.
And this season also marked the 2nd Pacific hurricane season to use the 'Z' name, Zeke, which attained Category-1 hurricane status in Mid-November.
Storms[]
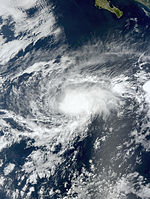
Hurricane Aletta[]
| Category 4 hurricane (SSHWS) | |
  | |
| Duration | May 17 – May 24 |
|---|---|
| Peak intensity | 135 mph (215 km/h) (1-min) 950 mbar (hPa) |
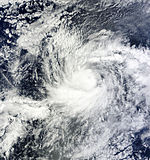
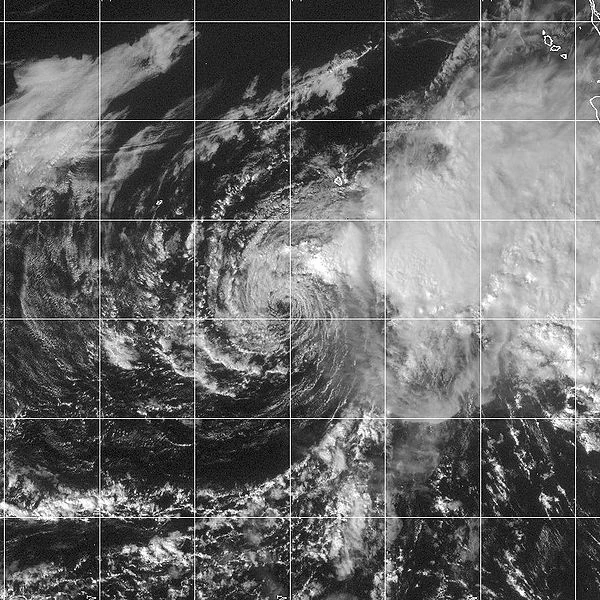
Hurricane Bud[]
| Category 2 hurricane (SSHWS) | |
  | |
| Duration | May 23 – May 28 |
|---|---|
| Peak intensity | 100 mph (155 km/h) (1-min) 970 mbar (hPa) |
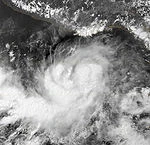
Tropical Storm Carlotta[]
| Tropical storm (SSHWS) | |
  | |
| Duration | May 31 – June 2 |
|---|---|
| Peak intensity | 45 mph (75 km/h) (1-min) 1000 mbar (hPa) |
Tropical Depression Four-E[]
| Tropical depression (SSHWS) | |
  | |
| Duration | June 14 – June 16 |
|---|---|
| Peak intensity | 35 mph (55 km/h) (1-min) 1002 mbar (hPa) |
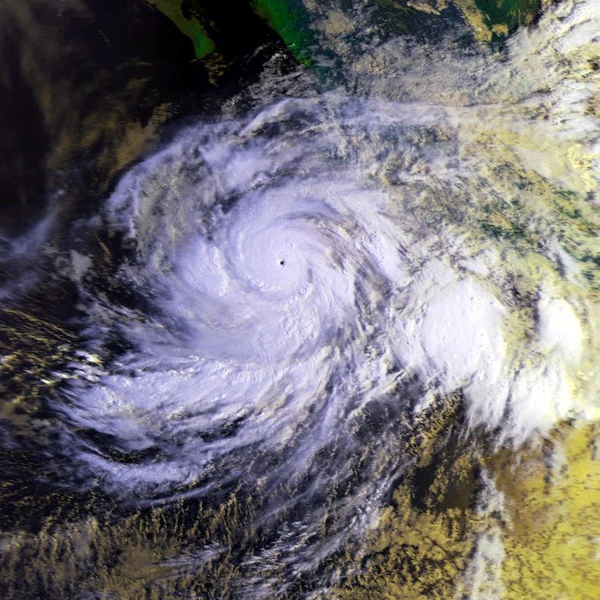
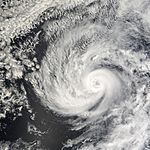
Hurricane Daniel[]
| Category 5 hurricane (SSHWS) | |
  | |
| Duration | June 21 – June 30 |
|---|---|
| Peak intensity | 160 mph (260 km/h) (1-min) 914 mbar (hPa) |
Tropical Storm Emilia[]
| Tropical storm (SSHWS) | |
  | |
| Duration | July 4 – July 8 |
|---|---|
| Peak intensity | 60 mph (95 km/h) (1-min) 997 mbar (hPa) |
Tropical Storm Fabio[]
| Tropical storm (SSHWS) | |
  | |
| Duration | July 14 – July 19 |
|---|---|
| Peak intensity | 65 mph (100 km/h) (1-min) 990 mbar (hPa) |
Hurricane Gilma[]
| Category 2 hurricane (SSHWS) | |
  | |
| Duration | July 15 – July 23 |
|---|---|
| Peak intensity | 110 mph (175 km/h) (1-min) 964 mbar (hPa) |
Hurricane Hector[]
| Category 1 hurricane (SSHWS) | |
  | |
| Duration | July 18 – July 24 |
|---|---|
| Peak intensity | 85 mph (140 km/h) (1-min) 979 mbar (hPa) |
Hurricane Ileana[]
| Category 4 hurricane (SSHWS) | |
  | |
| Duration | July 26 – August 11 |
|---|---|
| Peak intensity | 145 mph (230 km/h) (1-min) 937 mbar (hPa) |
Hurricane John[]
| Category 3 hurricane (SSHWS) | |
  | |
| Duration | August 1 – August 7 |
|---|---|
| Peak intensity | 115 mph (185 km/h) (1-min) 959 mbar (hPa) |
Hurricane Kristy[]
| Category 4 hurricane (SSHWS) | |
  | |
| Duration | August 6 – August 15 |
|---|---|
| Peak intensity | 140 mph (220 km/h) (1-min) 938 mbar (hPa) |
Hurricane Lane[]
| Category 4 hurricane (SSHWS) | |
  | |
| Duration | August 14 – September 2 |
|---|---|
| Peak intensity | 150 mph (240 km/h) (1-min) 930 mbar (hPa) |
Tropical Storm Miriam[]
| Tropical storm (SSHWS) | |
  | |
| Duration | August 19 – August 22 |
|---|---|
| Peak intensity | 40 mph (65 km/h) (1-min) 1001 mbar (hPa) |
Hurricane Norman[]
| Category 5 hurricane (SSHWS) | |
  | |
| Duration | August 24 – September 10 (Crossed into west pacific) |
|---|---|
| Peak intensity | 190 mph (305 km/h) (1-min) 883 mbar (hPa) |
Tropical Storm Olivia[]
| Tropical storm (SSHWS) | |
  | |
| Duration | August 30 – September 3 |
|---|---|
| Peak intensity | 70 mph (110 km/h) (1-min) 988 mbar (hPa) |
Hurricane Pewa[]
| Category 2 hurricane (SSHWS) | |
  | |
| Duration | September 4 – September 11 |
|---|---|
| Peak intensity | 105 mph (165 km/h) (1-min) 967 mbar (hPa) |
Hurricane Paul[]
| Category 3 hurricane (SSHWS) | |
  | |
| Duration | September 9 – September 18 |
|---|---|
| Peak intensity | 125 mph (205 km/h) (1-min) 946 mbar (hPa) |
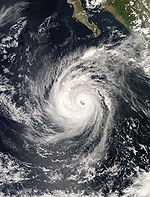
Hurricane Rosa[]
| Category 5 hurricane (SSHWS) | |
  | |
| Duration | September 18 – September 30 |
|---|---|
| Peak intensity | 165 mph (270 km/h) (1-min) 910 mbar (hPa) |
Hurricane Sergio[]
| Category 4 hurricane (SSHWS) | |
  | |
| Duration | September 21 – October 1 |
|---|---|
| Peak intensity | 135 mph (215 km/h) (1-min) 940 mbar (hPa) |
Tropical Storm Tara[]
| Tropical storm (SSHWS) | |
  | |
| Duration | September 28 – October 2 |
|---|---|
| Peak intensity | 50 mph (85 km/h) (1-min) 999 mbar (hPa) |
Tropical Storm Vicente[]
| Tropical storm (SSHWS) | |
  | |
| Duration | October 3 – October 7 |
|---|---|
| Peak intensity | 65 mph (100 km/h) (1-min) 992 mbar (hPa) |
Hurricane Willa[]
| Category 4 hurricane (SSHWS) | |
  | |
| Duration | October 10 – October 21 |
|---|---|
| Peak intensity | 155 mph (250 km/h) (1-min) 923 mbar (hPa) |
Tropical Storm Yolanda[]
| Tropical storm (SSHWS) | |
  | |
| Duration | October 19 – October 24 |
|---|---|
| Peak intensity | 40 mph (65 km/h) (1-min) 1000 mbar (hPa) |
Tropical Depression Twenty-Four-E[]
| Tropical depression (SSHWS) | |
  | |
| Duration | October 31 – November 2 |
|---|---|
| Peak intensity | 35 mph (55 km/h) (1-min) 1004 mbar (hPa) |
Tropical Depression Two-C[]
| Tropical depression (SSHWS) | |
  | |
| Duration | November 7 – November 8 |
|---|---|
| Peak intensity | 35 mph (55 km/h) (1-min) 1002 mbar (hPa) |
Hurricane Zeke[]
| Category 1 hurricane (SSHWS) | |
  | |
| Duration | November 12 – November 20 |
|---|---|
| Peak intensity | 90 mph (150 km/h) (1-min) 973 mbar (hPa) |
Timeline[]

Accumulated Cyclone Energy (ACE) Rating[]
| ACE (104 kt2) – Storm: Source | |||||
|---|---|---|---|---|---|
| 1 | 51.0 | Norman | 13 | (8.16) | Pewa |
| 2 | 36.9 | Rosa | 14 | 6.75 | Bud |
| 3 | 28.7 | Daniel | 15 | 6.14 | Zeke |
| 4 | 24.5 | Willa | 16 | 5.39 | Hector |
| 5 | 24.1 | Lane | 17 | 4.02 | Olivia |
| 6 | 20.0 | Ileana | 18 | 3.49 | Fabio |
| 7 | 18.1 | Kristy | 19 | 3.16 | Vicente |
| 8 | 15.3 | Sergio | 20 | 2.79 | Emilia |
| 9 | 13.6 | Aletta | 21 | 2.24 | Tara |
| 10 | 13.0 | Paul | 22 | 1.58 | Carlotta |
| 11 | 10.5 | John | 23 | 1.27 | Yolanda |
| 12 | 10.0 | Gilma | 24 | 1.00 | Miriam |
| Total=303.53 (8.16) | |||||
ACE is the result of a storm's winds multiplied by how long it lasted for, so storms or subtropical storms (Originally not included up until 2012) that it lasted a long time, as well as particularly strong hurricanes, have higher ACE totals. Tropical Depressions are not included in season totals.
The figures in parentheses are for storms in the Central Pacific basin west of 140°W; those not in parenthesis are for the Eastern Pacific basin.
Season effects[]
This is a table of the storms and their effects in the 2018 Pacific hurricane season. This table includes the storm's names, duration, peak intensity, Areas affected (bold indicates made landfall in that region at least once), damages, and death totals. Deaths in parentheses are additional and indirect (an example of an indirect death would be a traffic accident) but are still storm-related. Damage and deaths include totals while the storm was extratropical, a wave or a low. All of the damage figures are in 2018 USD (the listed damage figure is in millions).
| Storm name |
Dates active | Storm category at peak intensity |
Max 1-min wind mph (km/h) |
Min. press. (mbar) |
Areas affected | Damage (USD) |
Deaths |
|---|---|---|---|---|---|---|---|
| Aletta | May 17 – May 24 | Category 4 hurricane | 135 (215) | 950 | None | 0 | 0 |
| Bud | May 23 – May 28 | Category 2 hurricane | 100 (155) | 970 | Mexico, Baja California | 250 | 26 |
| Carlotta | May 31 – June 2 | Tropical storm | 45 (75) | 1000 | None | 0 | 0 |
| Four-E | June 14 – June 16 | Tropical depression | 35 (55) | 1002 | None | 0 | 0 |
| Daniel | June 21 – June 30 | Category 5 hurricane | 160 (260) | 914 | US West Coast (California) | 115 | 18 |
| Emilia | July 4 – July 8 | Tropical storm | 60 (95) | 997 | None | 0 | 0 |
| Fabio | July 14 – July 19 | Tropical storm | 65 (100) | 990 | None | 0 | 0 |
| Gilma | July 15 – July 23 | Category 2 hurricane | 110 (175) | 964 | Hawaii | 10 | 7 |
| Hector | July 18 – July 24 | Category 1 hurricane | 85 (140) | 979 | None | 0 | 0 |
| Ileana | July 26 – August 11 | Category 4 hurricane | 145 (230) | 937 | None | 0 | 0 |
| John | August 1 – August 7 | Category 3 hurricane | 115 (185) | 959 | Mexico, Baja California | 20 | 10 |
| Kristy | August 6 – August 15 | Category 4 hurricane | 140 (220) | 938 | None | 0 | 0 |
| Lane | August 14 – September 2 | Category 4 hurricane | 150 (240) | 930 | None | 0 | 0 |
| Miriam | August 19 – August 22 | Tropical storm | 40 (60) | 1001 | None | 0 | 0 |
| Norman | August 24 – September 10 | Category 5 hurricane | 190 (305) | 883 | Hawaii | 1,700 | 65 |
| Olivia | August 30 – September 3 | Tropical storm | 70 (110) | 988 | Baja California | 5 | 5 |
| Pewa | September 4 – September 11 | Category 2 hurricane | 105 (165) | 967 | None | 0 | 0 |
| Paul | September 9 – September 18 | Category 3 hurricane | 125 (205) | 946 | US West Coast (California), Mexico, Baja California | 40 | 10 |
| Rosa | September 18 – September 30 | Category 5 hurricane | 165 (270) | 910 | None | 0 | 0 |
| Sergio | September 21 – October 1 | Category 4 hurricane | 135 (215) | 940 | Mexico, Baja California | 700 | 198 |
| Tara | September 28 – October 2 | Tropical storm | 50 (85) | 999 | None | 0 | 0 |
| Vicente | October 3 – October 7 | Tropical storm | 65 (100) | 992 | None | 0 | 0 |
| Willa | October 10 – October 21 | Category 4 hurricane | 155 (250) | 923 | None | 0 | 0 |
| Yolanda | October 19 – October 24 | Tropical storm | 40 (65) | 1000 | Baja California, Mexico | 10 | 4 |
| Twenty-Four-E | October 31 – November 2 | Tropical depression | 35 (55) | 1004 | None | 0 | 0 |
| Two-C | November 7 – November 8 | Tropical depression | 35 (55) | 1002 | None | 0 | 0 |
| Zeke | November 12 – November 20 | Category 1 hurricane | 90 (150) | 973 | None | 0 | 0 |