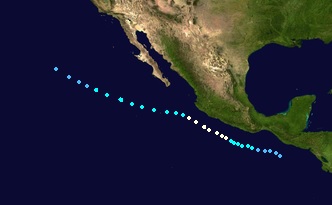
The 2018 Pacific hurricane season began on May 15, 2018 in the Eastern Pacific and on June 1, 2018 in the Central Pacific, both ended November 30, 2018.
Seasonal forecasts[]
| Source | Date | Named
storms |
Hurricanes | Major
hurricanes | |
| NOAA | May 1, 2018 | 15 | 8 | 2 | |
| ––––––––––––––––––––––––––––––––––––––––––––––––––––––– | |||||
| Actual activity | 12 | 7 | 4 | ||
Season Summary[]
Storms[]
|
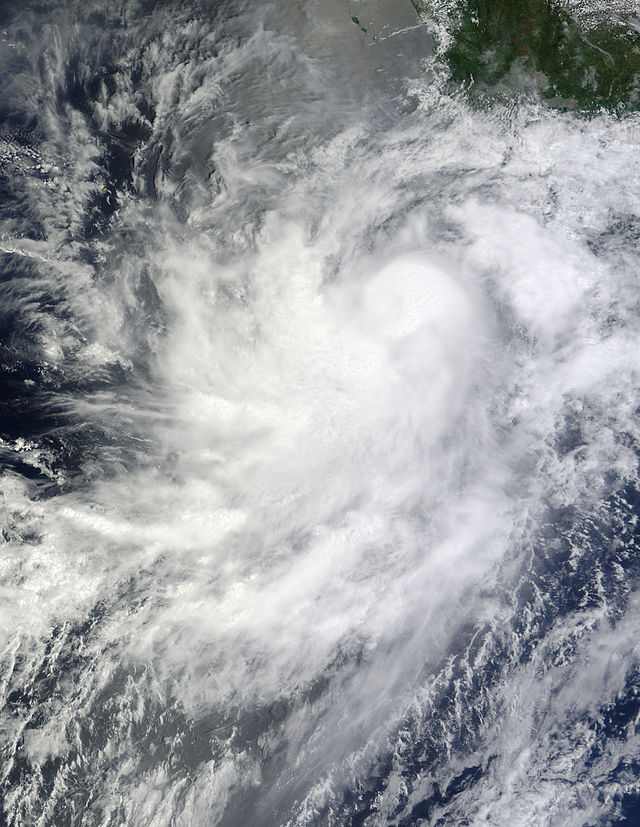
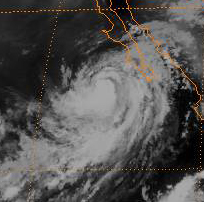
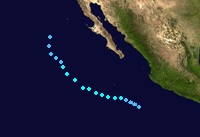
Hurricane Aletta[]
| Category 4 hurricane (SSHWS) | |
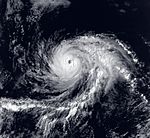  | |
| Duration | May 18 – May 27 |
|---|---|
| Peak intensity | 135 mph (215 km/h) (1-min) 940 mbar (hPa) |
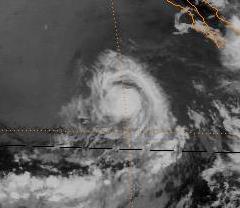
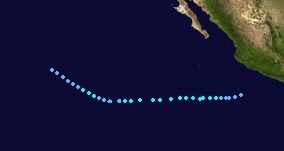
Hurricane Bud[]
| Category 1 hurricane (SSHWS) | |
  | |
| Duration | May 31 – June 6 |
|---|---|
| Peak intensity | 90 mph (150 km/h) (1-min) 972 mbar (hPa) |
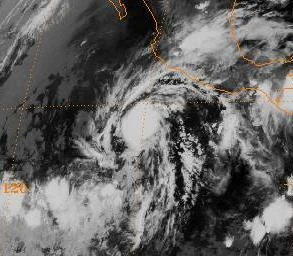
Tropical Storm Carlotta[]
| Tropical storm (SSHWS) | |
  | |
| Duration | June 10 – June 15 |
|---|---|
| Peak intensity | 70 mph (110 km/h) (1-min) 986 mbar (hPa) |
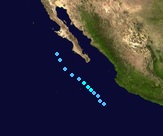
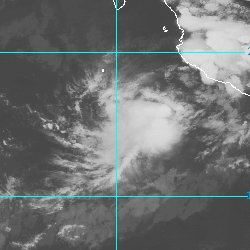
Tropical Depression Four-E[]
| Tropical depression (SSHWS) | |
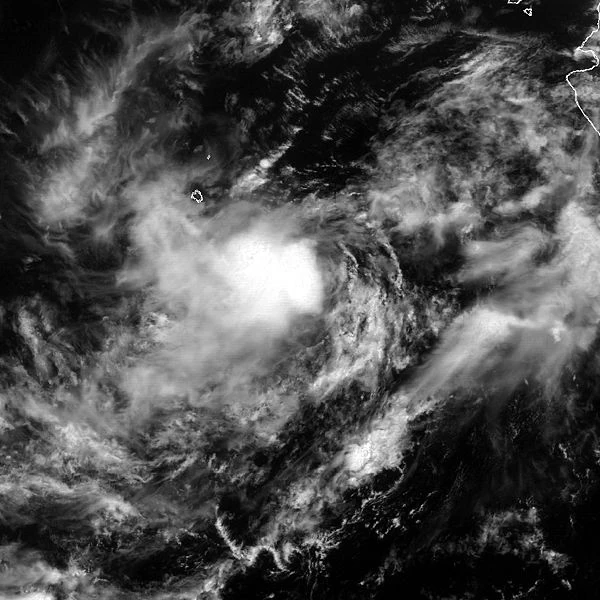 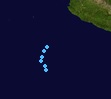 | |
| Duration | June 23 – June 24 |
|---|---|
| Peak intensity | 35 mph (55 km/h) (1-min) 1003 mbar (hPa) |
Tropical Storm Daniel[]
| Tropical storm (SSHWS) | |
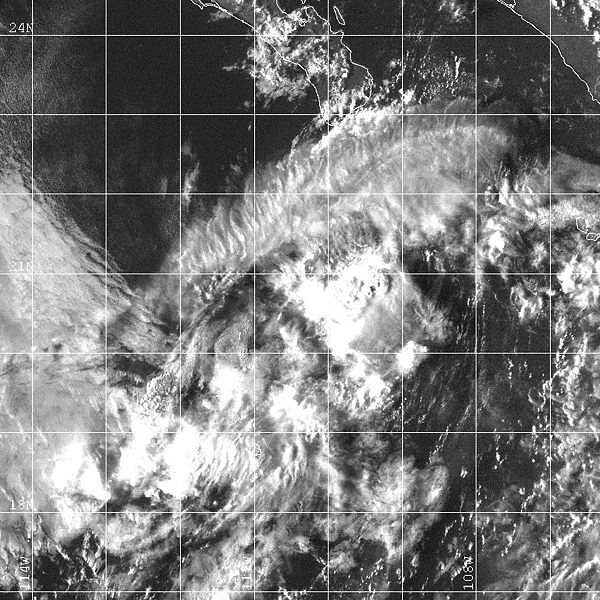  | |
| Duration | June 30 – July 2 |
|---|---|
| Peak intensity | 40 mph (65 km/h) (1-min) 1000 mbar (hPa) |
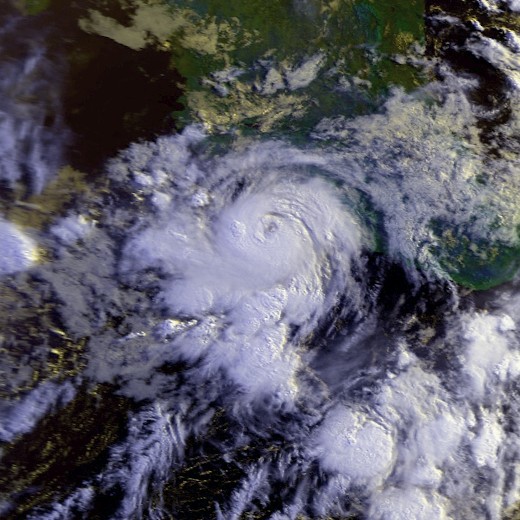
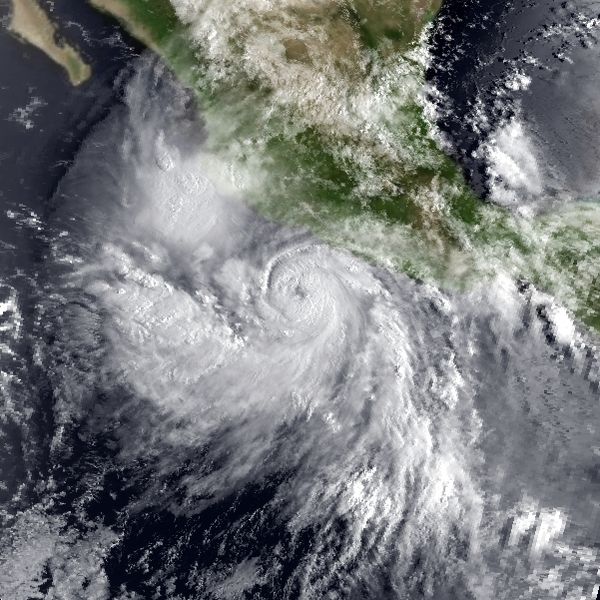
Hurricane Emilia[]
| Category 2 hurricane (SSHWS) | |
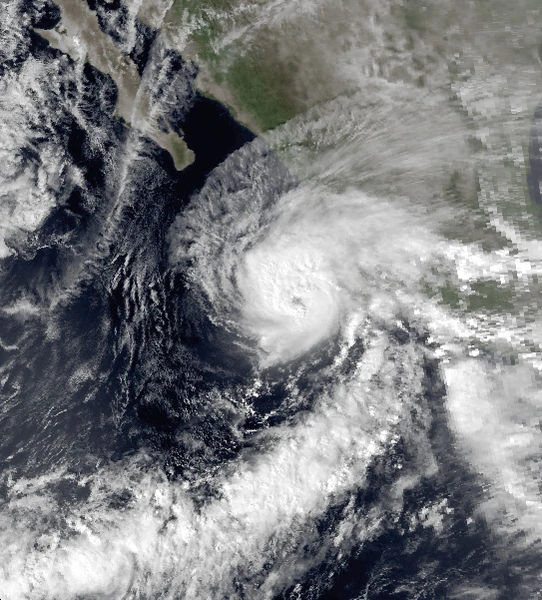  | |
| Duration | July 4 – July 12 |
|---|---|
| Peak intensity | 100 mph (155 km/h) (1-min) 970 mbar (hPa) |
Tropical Storm Fabio[]
| Tropical storm (SSHWS) | |
  | |
| Duration | July 10 – July 14 |
|---|---|
| Peak intensity | 60 mph (95 km/h) (1-min) 995 mbar (hPa) |
Hurricane Gilma[]
| Category 1 hurricane (SSHWS) | |
  | |
| Duration | July 20 – July 26 |
|---|---|
| Peak intensity | 75 mph (120 km/h) (1-min) 987 mbar (hPa) |
Hurricane Hector[]
| Category 3 hurricane (SSHWS) | |
  | |
| Duration | July 31 – August 8 |
|---|---|
| Peak intensity | 120 mph (195 km/h) (1-min) 950 mbar (hPa) |
Tropical Storm Ileana[]
| Tropical storm (SSHWS) | |
  | |
| Duration | August 6 – August 11 |
|---|---|
| Peak intensity | 65 mph (100 km/h) (1-min) 989 mbar (hPa) |
Tropical Storm John[]
| Tropical storm (SSHWS) | |
  | |
| Duration | August 10 – August 17 |
|---|---|
| Peak intensity | 70 mph (110 km/h) (1-min) 986 mbar (hPa) |
Tropical Depression Twelve-E[]
| Tropical depression (SSHWS) | |
 | |
| Duration | August 16 – August 18 |
|---|---|
| Peak intensity | 35 mph (55 km/h) (1-min) 1002 mbar (hPa) |
Hurricane Kristy[]
| Category 4 hurricane (SSHWS) | |
 | |
| Duration | August 20 – August 31 |
|---|---|
| Peak intensity | 150 mph (240 km/h) (1-min) 930 mbar (hPa) |
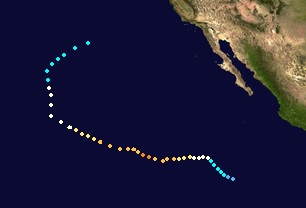
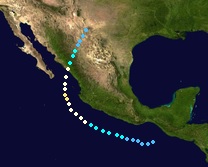
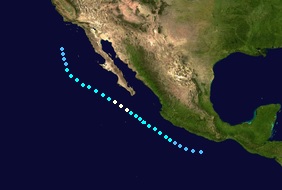
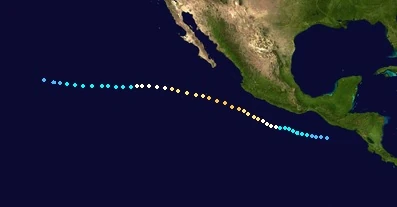
Hurricane Lane[]
| Category 4 hurricane (SSHWS) | |
 | |
| Duration | August 25 – September 6 |
|---|---|
| Peak intensity | 145 mph (230 km/h) (1-min) 934 mbar (hPa) |
Timeline[]

Storm names[]
The following names will be used to name tropical and subtropical cyclones in the 2018 season.
|
|
|
Accumulated Cyclone Energy (ACE) Rating[]
| ACE (104 kt2) – Storm: Source | |||||
|---|---|---|---|---|---|
| 1 | 0.00 | Storm | 12 | 0.00 | Storm |
| 2 | 0.00 | Storm | 13 | 0.00 | Storm |
| 3 | 0.00 | Storm | 14 | 0.00 | Storm |
| 4 | 0.00 | Storm | 15 | 0.00 | Storm |
| 5 | 0.00 | Storm | 16 | 0.00 | Storm |
| 6 | 0.00 | Storm | 17 | 0.00 | Storm |
| 7 | 0.00 | Storm | 18 | 0.00 | Storm |
| 8 | 0.00 | Storm | 19 | 0.00 | Storm |
| 9 | 0.00 | Storm | 20 | 0.00 | Storm |
| 10 | 0.00 | Storm | 21 | 0.00 | Storm |
| 11 | 0.00 | Storm | 22 | 0.00 | Storm |
| Total=0.0 | |||||
ACE is the result of a storm's winds multiplied by how long it lasted for, so storms or subtropical storms (Originally not included up until 2012) that at lasted a long time , as well as particularly strong hurricanes , have higher ACE totals. Tropical Depressions are not included in season total.
Season effects[]
This is a table of the storms and their effects in the 2018 Pacific hurricane season. This table includes the storm's names, duration, peak intensity, Areas affected (bold indicates made landfall in that region at least once), damages, and death totals. Deaths in parentheses are additional and indirect (an example of an indirect death would be a traffic accident), but are still storm-related. Damage and deaths include totals while the storm was extratropical, a wave or a low. All of the damage figures are in 2015 USD (the listed damage figure is in millions).
| Storm name |
Dates active | Storm category at peak intensity |
Max 1-min wind mph (km/h) |
Min. press. (mbar) |
Areas affected | Damage (USD) |
Deaths |
|---|---|---|---|---|---|---|---|
| Aletta | May 18 – May 27 | Category 4 hurricane | 135 (215) | 940 | None | 0 | 0 |
| Bud | May 31 – June 6 | Category 1 hurricane | 90 (150) | 972 | None | 0 | 0 |
| Carlotta | June 10 – June 15 | Tropical storm | 70 (110) | 986 | None | 0 | 0 |
| Four-E | June 23 – June 24 | Tropical depression | 35 (55) | 1003 | None | 0 | 0 |
| Daniel | June 30 – July 2 | Tropical storm | 40 (65) | 1000 | None | 0 | 0 |
| Emilia | July 4 – July 12 | Category 2 hurricane | 100 (155) | 970 | Mexico | 35 | 9 |
| Fabio | July 10 – July 14 | Tropical storm | 60 (95) | 995 | None | 0 | 0 |
| Gilma | July 20 – July 26 | Category 1 hurricane | 75 (120) | 987 | None | 0 | 0 |
| Hector | July 31 – August 8 | Category 3 hurricane | 120 (195) | 950 | None | 0 | 0 |
| Ileana | August 6 – August 11 | Tropical storm | 65 (100) | 989 | None | 0 | 0 |
| John | August 10 – August 17 | Tropical storm | 70 (110) | 986 | None | 0 | 0 |
| Twelve-E | August 16 – August 18 | Tropical depression | 35 (55) | 1002 | None | 0 | 0 |
| Kristy | August 20 – August 31 | Category 4 hurricane | 150 (240) | 930 | None | 0 | 0 |
| Lane | August 25 – September 6 | Category 4 hurricane | 145 (230) | 934 | None | 0 | 0 |