NOTE #1: THIS PAGE IS CAREFULLY MONITORED. ANY UNCONSTRUCTIVE EDITS TO THIS ARTICLE WILL BE PROMPTLY REVERTED.

NOTE #2: UNLIKE MOST SEASON ARTICLES ACROSS THIS WIKI, THIS PAGE IS A USER PREDICTION FOR THE 2015 ATLANTIC HURRICANE SEASON MADE BY ANDREW444.
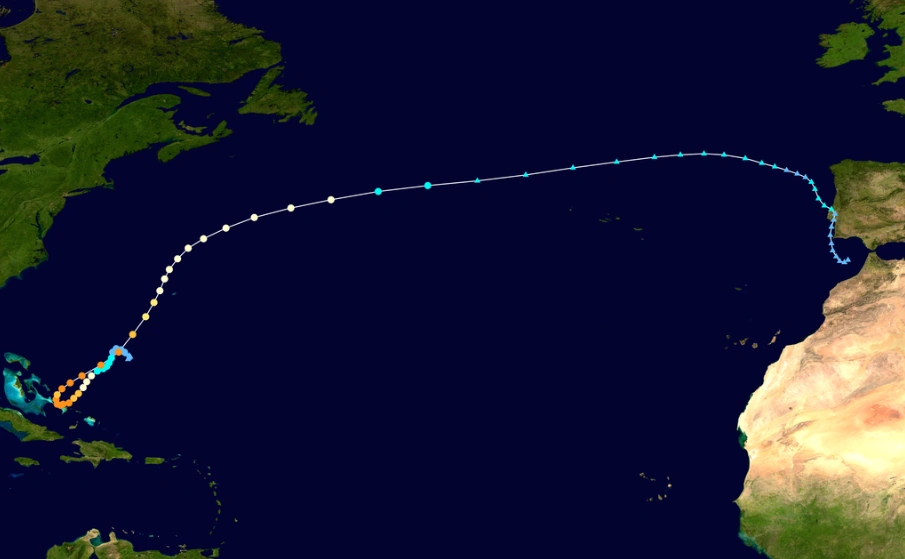
The 2015 Atlantic hurricane season was an active North Atlantic hurricane season (mainly due to a minor La Niña event), producing 18 total tropical or subtropical cyclones, 16 total storms, 11 hurricanes, and six major hurricanes. It was tied with the 2003 and 2008 seasons as the tenth most active Atlantic hurricane season on record in terms of total storms. The season began on June 1, 2015, and lasted until November 30, 2015, dates that conventionally delimit the period of each year when most tropical cyclones form in the season. However, the season's first storm, Subtropical Depression One, formed on January 14. The last storm, Hurricane Peter, dissipated on November 29. The most intense storm was Hurricane Danny, which peaked as a Category 5 hurricane on the Saffir-Simpson Hurricane Scale. The longest-lived storm was Hurricane Claudette, a major Cape-Verde type hurricane that persisted for 14.25 days in open Atlantic waters east of Bermuda.
The most notable storms were Hurricane Henri, which killed 1,004 people and left behind $100 billion (2015 USD) dollars in damage due to extensive flooding from the coasts of North Carolina to Nova Scotia, and Hurricane Bill, which killed 1,012 people throughout Mexico and left $1.4 billion (2015 USD) dollars in damage due to apocalyptic mud landslides across the entire country. Six other storms (Grace, Ida, Larry, Mindy, Nicholas, and Odette) had relatively minor impacts on land. Three storms (Henri, Larry, and Mindy) made landfall over the United States (U.S.), one (Bill) directly affected Mexico, one (Ida) directly affected Central America, one (Henri) directly affected the Greater Antilles, and one (Claudette) directly affected the Azores. Overall, the season caused 2,031 fatalities and ~$105.9 billion (2015 USD) in damage, making it the second costliest Atlantic hurricane season on record, behind only 2005.
Seasonal forecasts[]
| Source | Date | Named storms |
Hurricanes | Major hurricanes | |
| Average (1950–2000) | 9.6 | 5.9 | 2.3 | ||
| Record high activity | 28 | 15 | 8 | ||
| Record low activity | 4 | 2 (tie) | 0† | ||
| ––––––––––––––––––––––––––––––––––––––––––––––––––––––– | |||||
| TSR | December 3, 2014 | 12 | 5 | 2 | |
| WSI | December 17, 2014 | 11 | 6 | 2 | |
| CSU | April 1, 2015 | 12 | 6 | 3 | |
| TSR | April 9, 2015 | 12 | 6 | 2 | |
| TWC | April 21, 2015 | 13 | 7 | 4 | |
| TSR | May 20, 2015 | 12 | 7 | 2 | |
| UKMO | May 21, 2015 | 12* | N/A | N/A | |
| NOAA | May 21, 2015 | 10–16 | 3–7 | 2–4 | |
| FSU COAPS | May 27, 2015 | 12 | 6 | N/A | |
| CSU | May 29, 2015 | 14 | 8 | 3 | |
| TSR | June 3, 2015 | 13 | 7 | 4 | |
| NOAA | August 6, 2015 | 11–16 | 7–10 | 4–5 | |
| CSU | August 8, 2015 | 15 | 9 | 4 | |
| ––––––––––––––––––––––––––––––––––––––––––––––––––––––– | |||||
| Actual activity |
16 | 11 | 6 | ||
| * June–November only. † Most recent of several such occurrences. (See all) | |||||
Forecasts of hurricane activity are issued before each hurricane season by noted hurricane experts Philip J. Klotzbach, William M. Gray, and their associates at Colorado State University; and separately by National Oceanic and Atmospheric Administration (NOAA) forecasters.
Klotzbach's team (formerly led by Gray) defined the average number of storms per season (1981 to 2010) as 12.1 tropical storms, 6.4 hurricanes, 2.7 major hurricanes (storms reaching at least Category 3 strength in the Saffir-Simpson Hurricane Scale) and an accumulated cyclone energy (ACE) index of 96.1. NOAA defines a season as above-normal, near-normal or below-normal by a combination of the number of named storms, the number reaching hurricane strength, the number reaching major hurricane strength and the ACE index.
Pre-season forecasts[]
On December 3, 2014, Tropical Storm Risk (TSR), a public consortium consisting of experts on insurance, risk management, and seasonal climate forecasting at University College London, issued an extended-range forecast predicting an above-average hurricane season. In its report, TSR noted that tropical cyclone activity could be about 24% above the 1950–2010 average, with 12.3 (±4.2) tropical storms, 4.8 (±3.0) hurricanes, and 1.9 (±1.6) major hurricanes anticipated, and a cumulative ACE index of 97 (±58). Later that month on December 21, Weather Services International (WSI) issued an extended-range forecast predicting a near average hurricane season. In its forecast, WSI noted that a warm North Atlantic Oscillation, combined with a weakening El Niño, would result in a near-average season with 11 named storms, 6 hurricanes, and 2 major hurricanes. They also predicted a near-average probability of a hurricane landfall on the United States coastline, with a near-average chance on both the Gulf Coast and the East Coast. On April 1, 2015, Colorado State University (CSU) issued their forecast for the season, calling for a near-normal season due to a possible chance for the development of a La Niña during the season. On April 9, 2015, Tropical Storm Risk (TSR) issued their update forecast for the season, slightly revising their predictions upwards.
On May 21, 2015, NOAA released their forecast for the season, predicting a near-normal to above-normal season (10 to 16 named storms, three to seven hurricanes, and two to four major hurricanes of Category 3 strength or higher on the Saffir-Simpson Hurricane Scale). NOAA based its forecast on lower wind shear, warmer temperatures in the Main Development Region of the Eastern Atlantic, and the continuance of the "high activity" era (i.e. Atlantic multidecadal oscillation warm phase) which began in 1995. That same day, the United Kingdom Met Office (UKMO) issued a forecast of a near-average season. They predicted 12 named storms with a 60% chance that the number would be between 7 and 13. However, they do not issue forecasts on the number of hurricanes and major hurricanes. They also predicted an ACE index of 75 with a 85% chance that the index would be in the range 28 to 152. On May 27, 2015, the Florida State University for Ocean-Atmospheric Prediction Studies (FSU COAPS) issued its annual Atlantic hurricane season forecast. The organization predicted 12 named storms, including 6 hurricanes, and an ACE index of 84.
On May 29, 2015, Klotzbach's team issued their first updated forecast for the 2015 season, predicting 14 named storms, 8 hurricanes, and 3 major hurricanes. The university said there were large amounts of uncertainty concerning the phase of the La Niña as well as the Atlantic basin conditions. The organization also said the chance of a major hurricane hitting the U.S. coast was 55%, compared to an average of 52% over the past 100 years. The chance of a major hurricane hitting the Florida peninsula and the U.S. East Coast is 32%, compared to an average of 31% over the past 100 years.
Mid-season forecasts[]
On June 3, Tropical Storm Risk issued their June update for Atlantic hurricane activity for the 2015 season, predicting 13 named storms, 7 hurricanes, 3 major hurricanes, and an ACE index of 101. The agency noted that they anticipated the trade wind predictor to have a small suppressing effect on activity, and sea surface temperatures (sea surface temperatures) would provide a La Niña effect. They continued with their forecast of an above-average chance of U.S. landfall activity using the 1950–2011 long term norm, but a near-average chance of U.S. landfall activity using the recent 2002–2011 10-year norm.
On August 6, 2015, NOAA revised its predictions saying more named storms are likely in this hurricane season. The agency now predicted between 11 and 16 named storms from the period that started on June 1 and ended on November 30. NOAA's original May prediction was between 10 and 16 named storms. CSU followed suit two days later, upgrading their forecast to 15 named storms, 9 hurricanes, and 4 major hurricanes, and now giving a 86% percent chance of a U.S. major hurricane landfall, and a 59% chance of a U.S. East Coast major hurricane landfall.
Season summary[]
|
Activity by month[]
Pre-September[]
The 2015 Atlantic hurricane season had an abnormally early start. The first depression, Subtropical Depression One, formed in mid-January due to an unprecedented relaxation in wind shear. This gave 2015 the third earliest start to an Atlantic season, behind only 1938 and 1951, which received their first storms on January 3 and January 4, respectively. However, between mid January and late August, no depressions existed because wind shear and an abnormally strong Saharan Air Layer dominated the Atlantic, dissipating any tropical waves attempting to complete tropical or subtropical cyclogenesis.
September[]
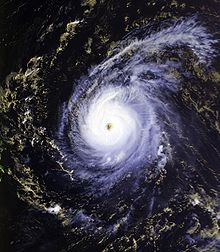
It wasn't until early September when an abrupt reversal in tropical cyclone activity occurred due to the sudden nonexistence of wind shear and a Saharan Air Layer. Seven total storms, five hurricanes (an all time record most recently set in 2005), and three intense (major) hurricanes developed, making the September the most active in terms of total storms since 2010. During the active September, numerous unusual occurrences occurred. Between September 24 and September 26, Claudette and Danny were simultaneously Category 4 hurricanes, the first time since 2010 this occurred in the North Atlantic Ocean. Both were still hurricanes when Erika and then Fred became hurricanes on September 26, an extremely rare occurrence and the first time since 1998 this happened. Two additional fairly rare events abruptly occurred that same day when Subtropical Storm Grace developed within a larger non-tropical low, not only meaning five simultaneous active storms were present, but it also meant an exceptionally rare occurrence of a storm being detected in a larger system, similar to how 1980's Hurricane Karl and the Perfect Storm of 1991 completed cyclogenesis. Overall, September was extremely active.
October[]
October saw activity identical to September. Six tropical storms, three hurricanes, and two major hurricanes formed throughout the month, making it the most active in terms of accumulated cyclone energy (ACE) since 2005. Except for Tropical Storm Joaquin and Hurricane Kate, every storm had some kind of land effects from rough waves to total devastation. The month was described as "severe" by the National Hurricane Center (NHC).
November[]
November was the most active one on record in terms of ACE. A total of three storms (Nicholas, Odette, and Peter) formed, a record shared with 2001 and 2005. All three storms became hurricanes, tying another record set in 2001, and one (Nicholas) became one of just six November Category 4 hurricanes. The record activity was mainly caused by unprecedented low amounts of wind shear.
Records and abnormalities[]
In addition to the unusual occurrences mentioned in the above paragraphs, a few additional abnormal oddities happened. Despite the large amount of total storms, only four (out of sixteen) of them (Bill, Henri, Ida, and Mindy) formed, or even existed in the Gulf of Mexico or the Caribbean Sea. Since the start of the Atlantic hurricane database in 1851, 2015 was the first year on record a season with as many as 16 total storms had only four storms existing in the Gulf of Mexico and the Caribbean Sea. Every other season with at least 15 total storms had at least five storms persist in those two major bodies of water. The lack of Caribbean Sea and Gulf of Mexico tropical cyclones can be linked to pockets of wind shear dominating the region even after the dissipation of shear in the open Atlantic. Furthermore, in the North Atlantic Main Development Region, encompassing the region between 10 and 20 degrees north and 20 to 60 degrees west, 10 total storms (Ana, Claudette, Danny, Erika, Fred, Joaquin, Kate, Nicholas, Odette, and Peter) formed in this area. Since the beginning of reliable Atlantic tropical cyclone records in 1944, 2015 was the first year 10 storms formed in this region, slightly ahead of the previous record, nine, set in 1995. This was due to sea surface temperatures in the region displaying similar conditions to that observed in August and September 2004. Additionally, these favorable conditions fueled many tropical waves exiting the coast of Africa. In fact, every storm that formed during 2015 originated from a tropical wave departing African's west coast - except for Hurricane Bill, which developed from a cluster of thunderstorms that detached from the Intertropical Convergence Zone in the Pacific basin. Furthermore, a few storms reached their peak intensities in unprecedented locations.
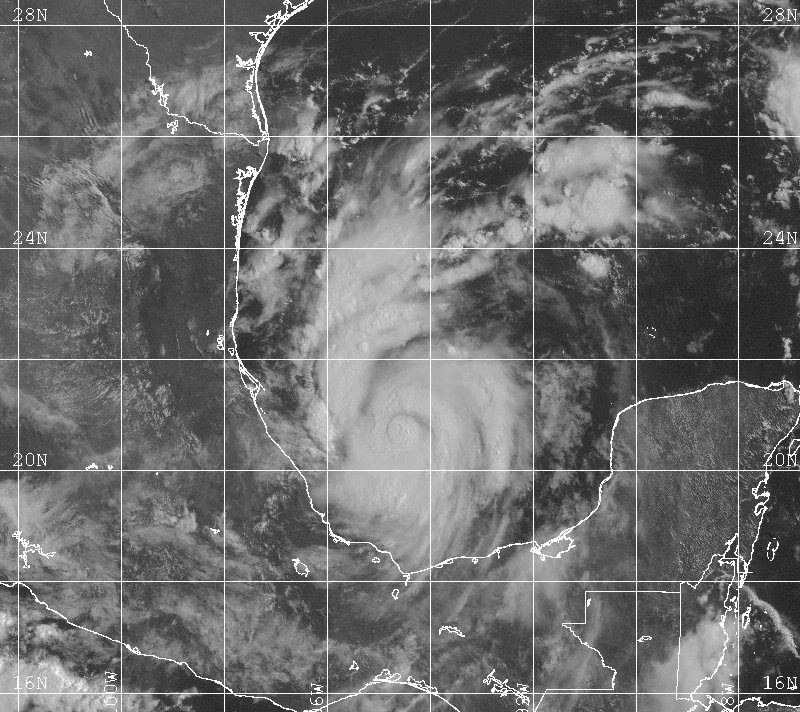
During 2015, three storms, Hurricanes Bill, Danny, and Nicholas, intensified at extreme points. Bill attained major hurricane strength approximately 150 miles north-northwest of Coatzacoalcos, Veracruz, Mexico, eclipsing 2010's Hurricane Karl as the southernmost Gulf of Mexico major hurricane (however, Karl was stronger than Bill in terms of minimum pressure). Next, Hurricane Danny reached Category 5 status at around 30 degrees north and 30 degrees west, surpassing Hurricane Ethel in 1960 and Hurricane Cleo in 1958 as the northernmost and easternmost Category 5 hurricane, respectively. Finally, Hurricane Nicholas reached Category 4 intensity at 41 degrees north and maintained it through 47 degrees north. This means Nicholas reached and maintained Category 4 intensity further north than any other Atlantic hurricane, breaking the records set by Hurricane Debby in 1982 and Hurricane Ella in 1978, respectively. Overall, the 2015 season was a season of extremes.
Accumulated cyclone energy (ACE)[]
The season's activity was reflected with a hyperactive ACE rating of 194, which is classifed as above normal. ACE is, broadly speaking, a measure of the power of the hurricane multiplied by the length of time it existed, so storms that last a long time, as well as particularly strong hurricanes, have high ACEs. ACE is only calculated for full advisories on tropical systems at or exceeding 34 knots (39 mph, 63 km/h) or tropical storm strength. Subtropical cyclones, such as Grace, are excluded from the total.
Timeline[]


List of storms[]
Subtropical Depression One []
| Subtropical depression (SSHWS) | |
  | |
| Duration | January 14 – January 18 |
|---|---|
| Peak intensity | 30 mph (45 km/h) (1-min) 1005 mbar (hPa) |
Tropical Depression Two[]
| Tropical depression (SSHWS) | |
  | |
| Duration | August 30 – August 31 |
|---|---|
| Peak intensity | 35 mph (55 km/h) (1-min) 1003 mbar (hPa) |
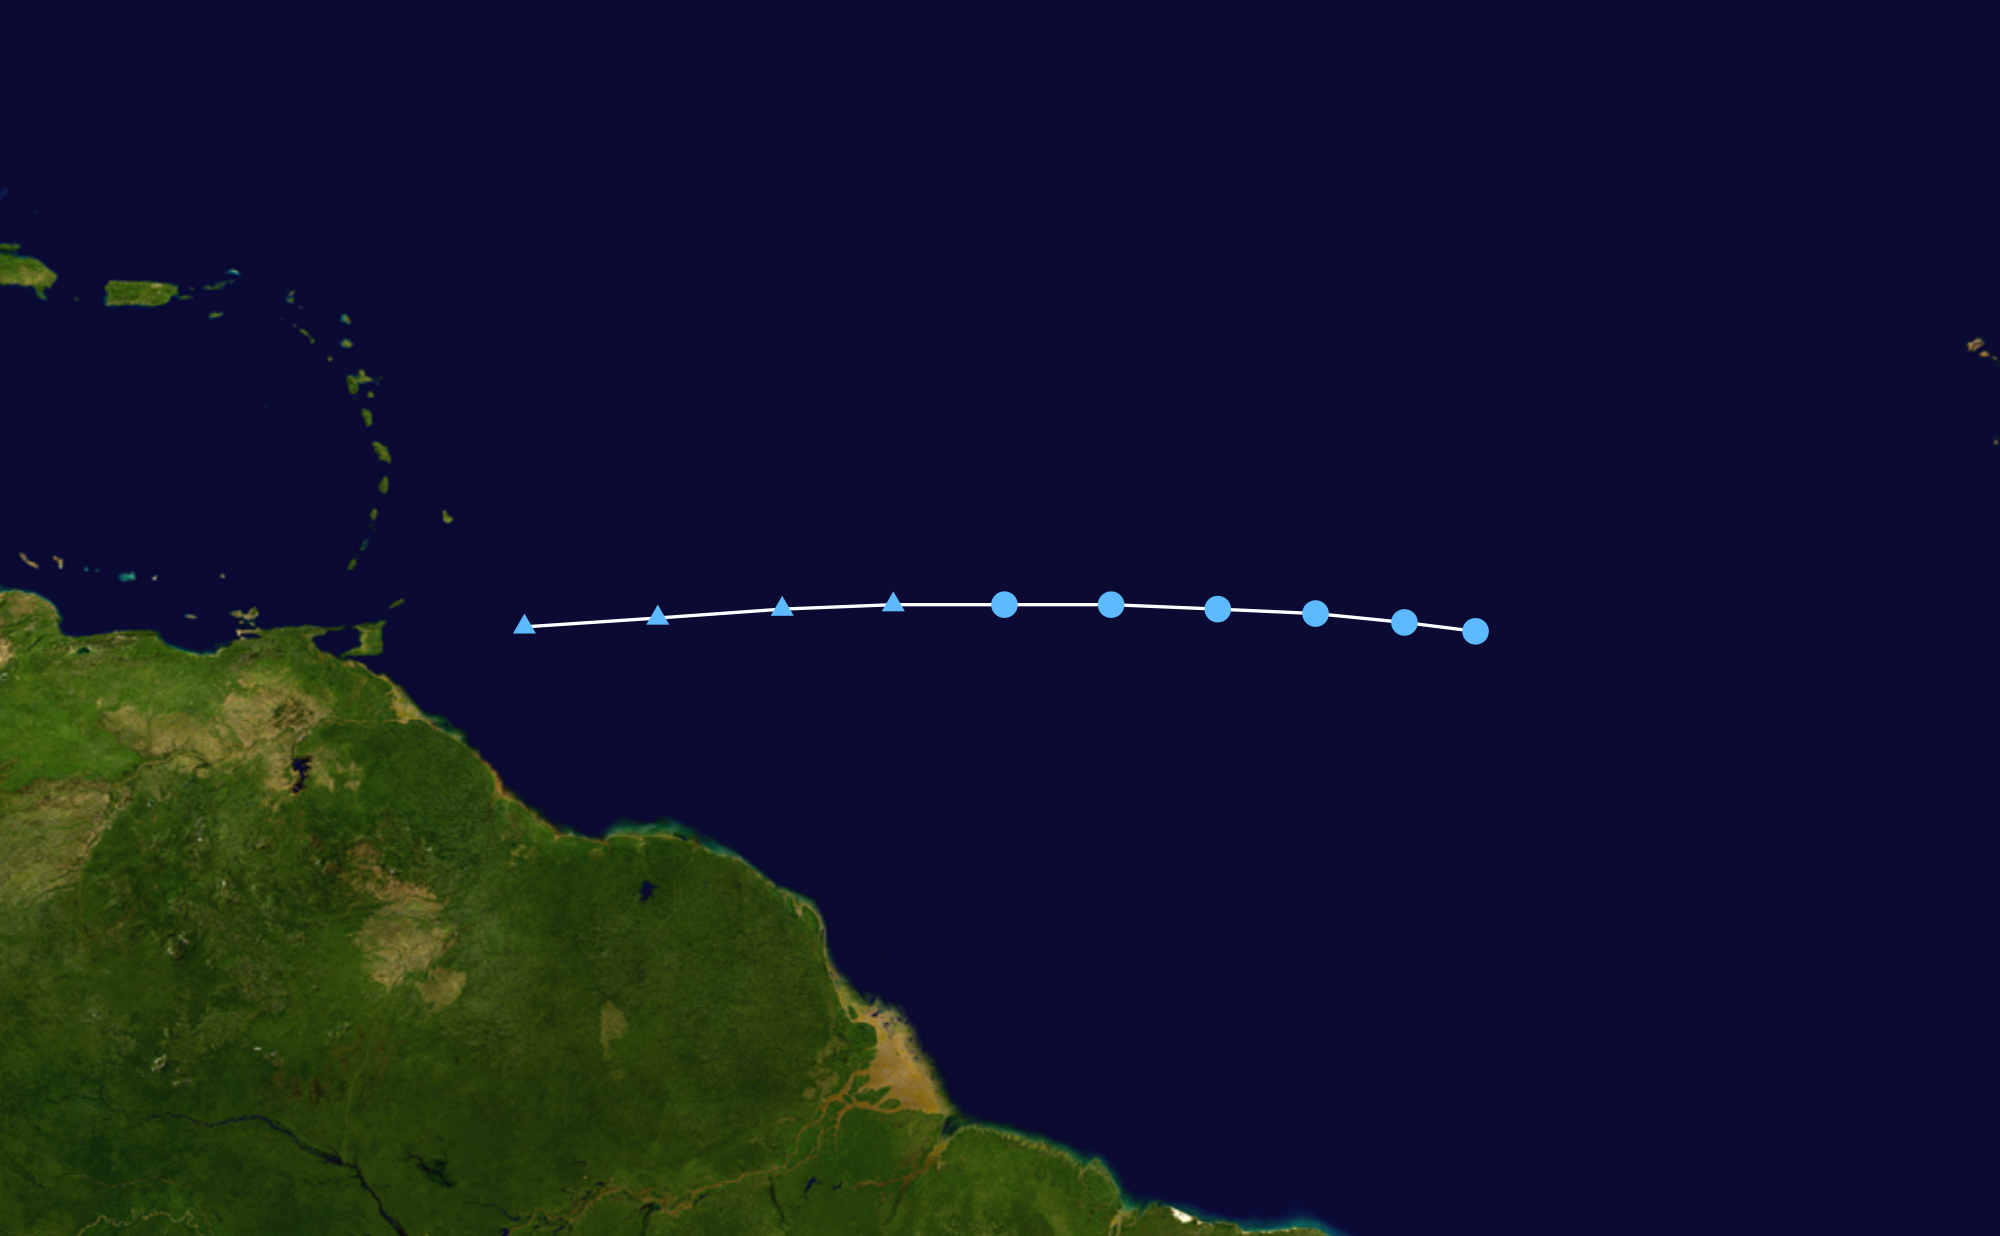
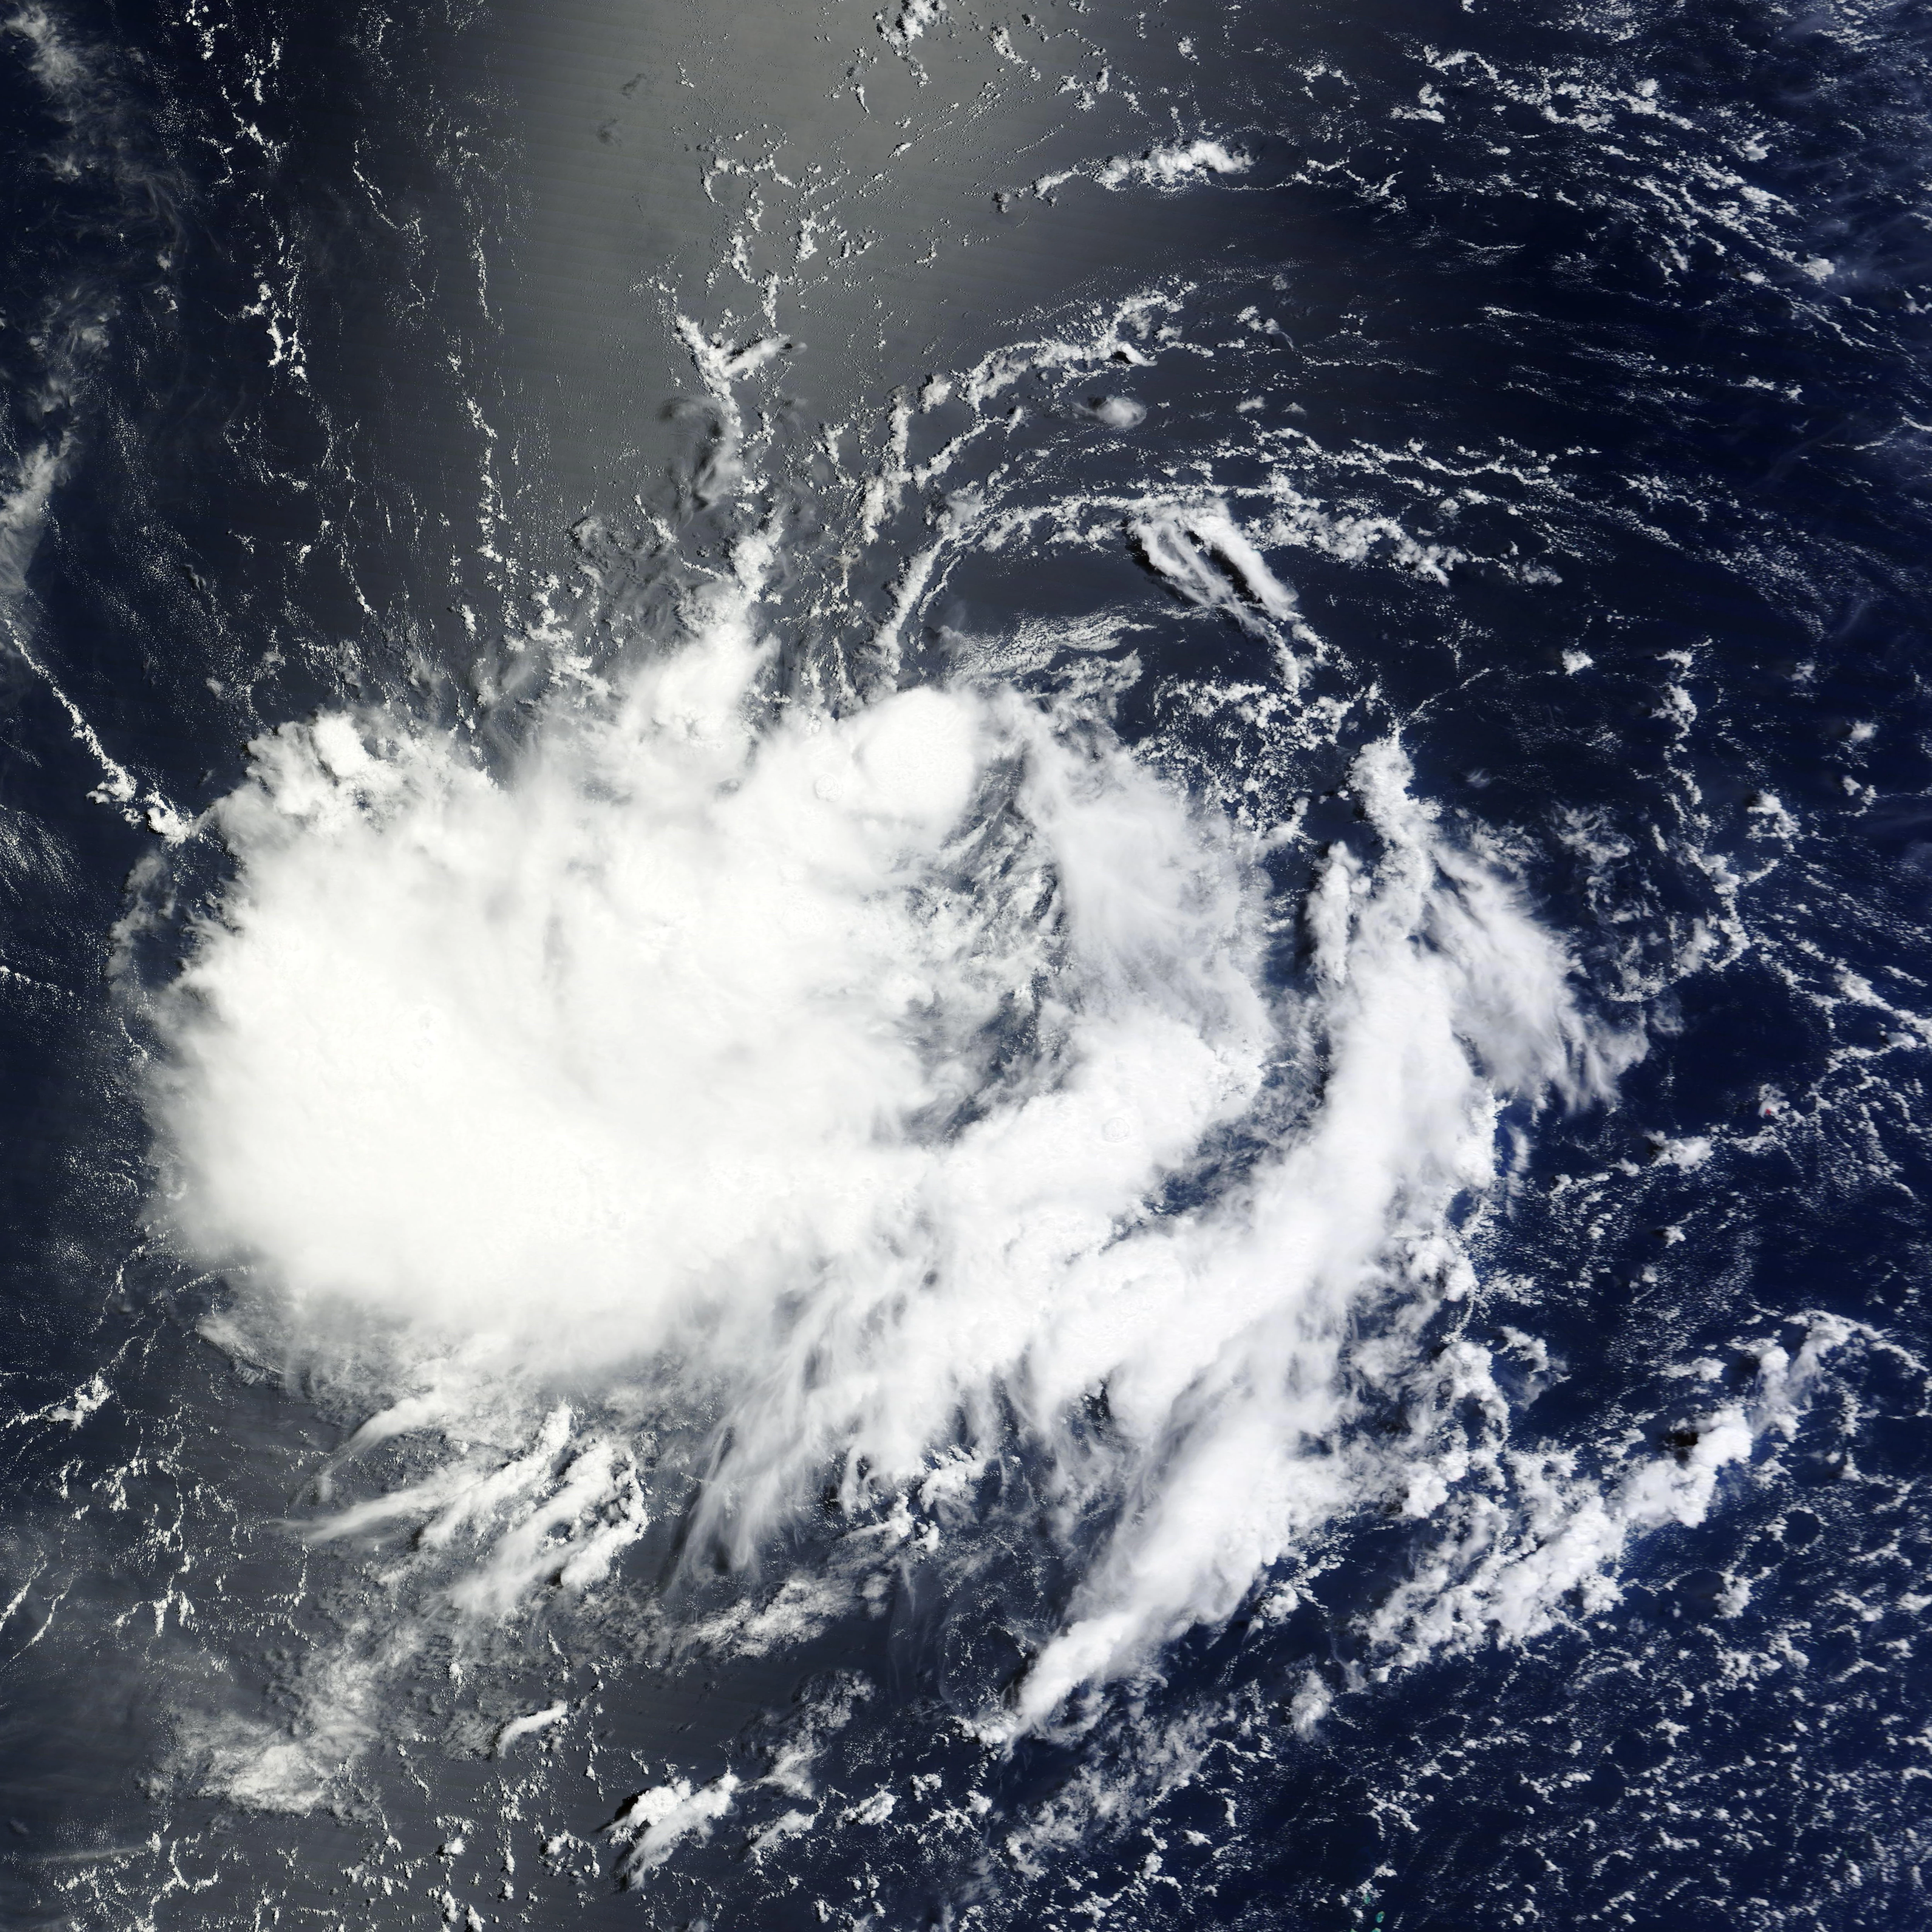
Tropical Storm Ana[]
| Tropical storm (SSHWS) | |
  | |
| Duration | September 4 – September 7 |
|---|---|
| Peak intensity | 50 mph (85 km/h) (1-min) 996 mbar (hPa) |
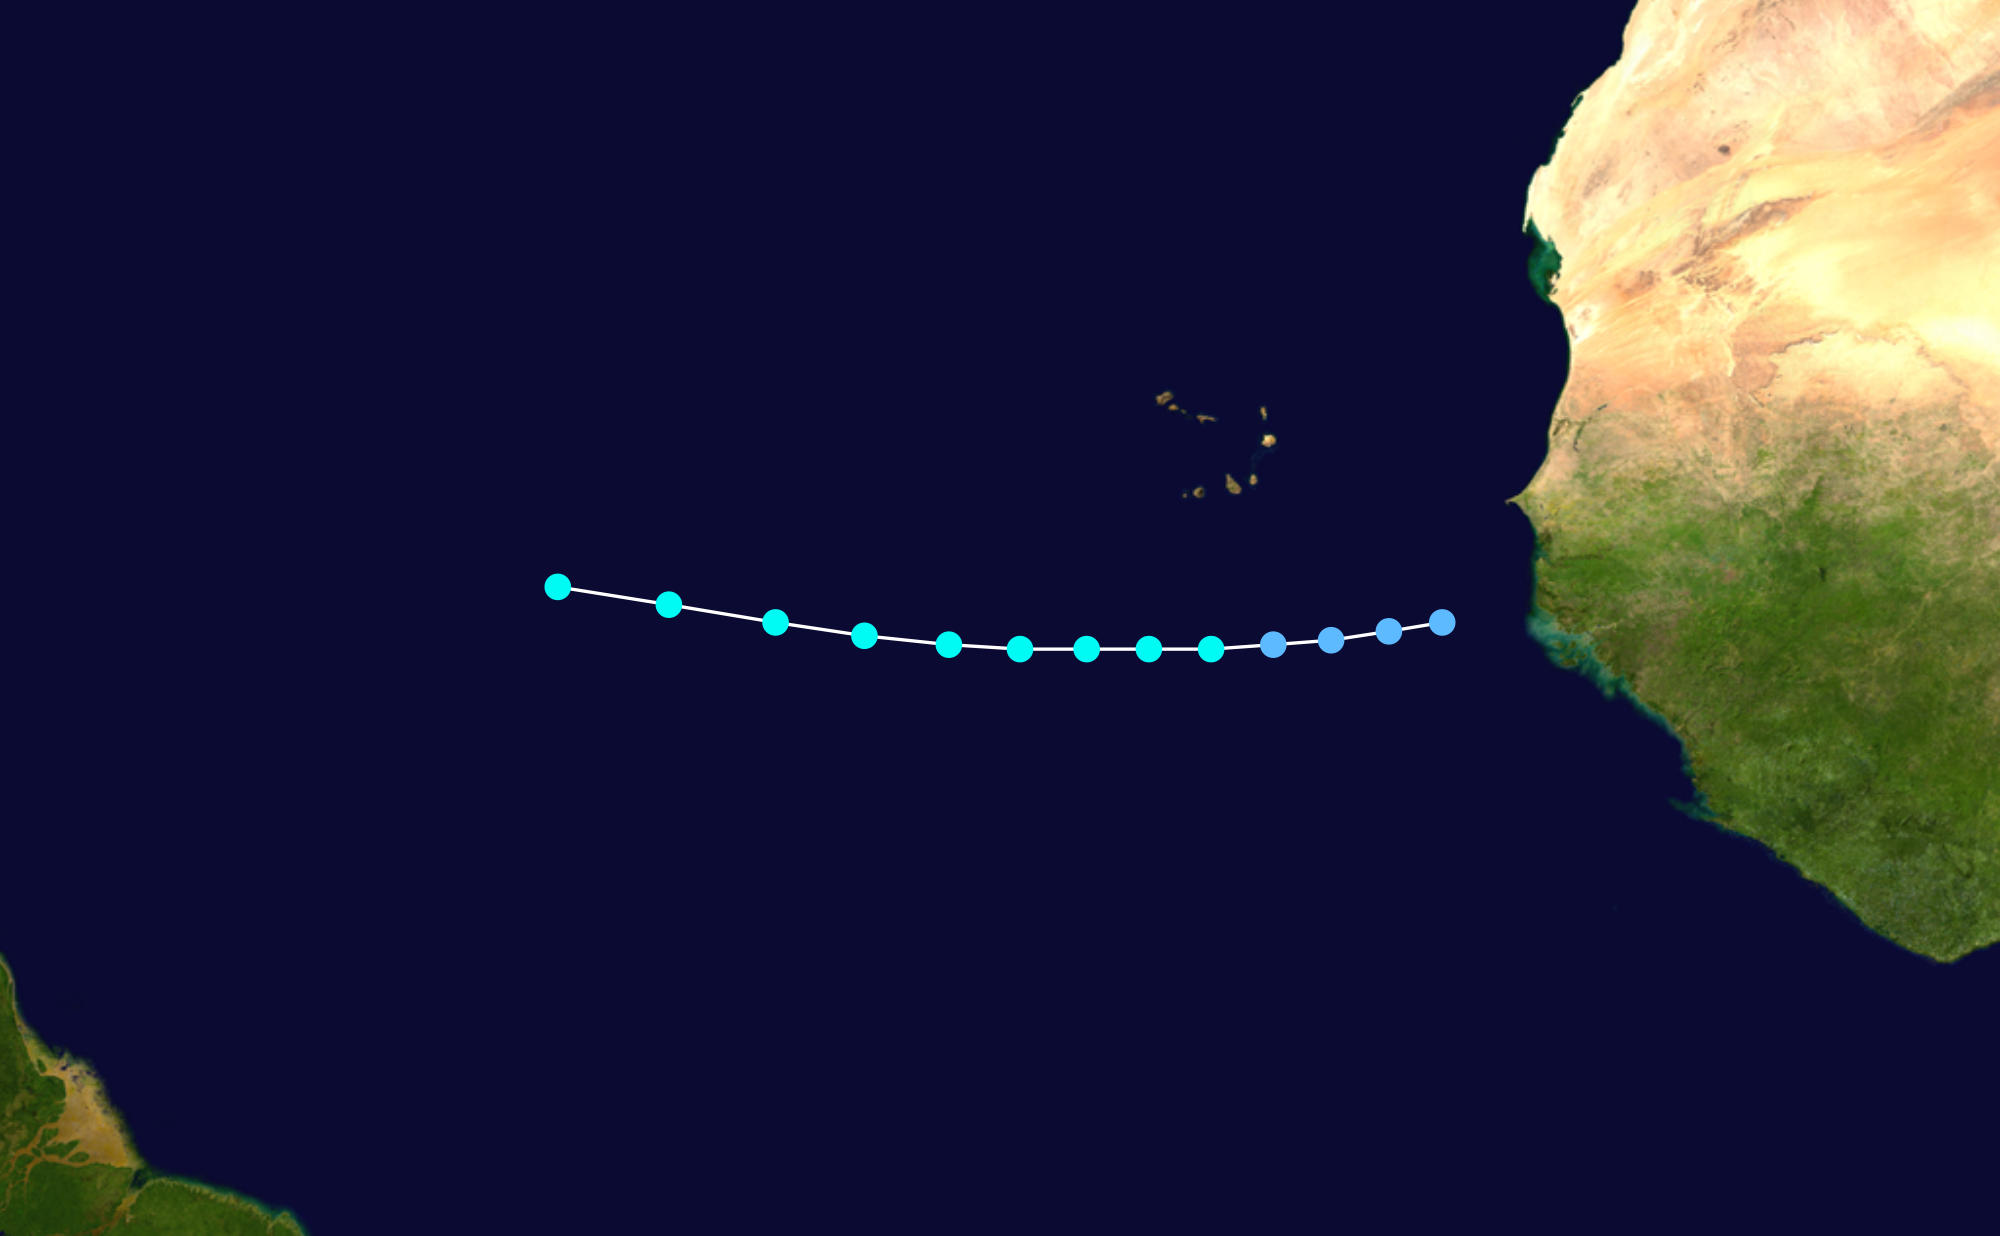
A tropical wave departed Africa in early September. The wave began organizing and on September 4, became a tropical depression. The depression continued to develop, and it became Tropical Storm Ana on September 5, the first tropical storm of the season. This gave 2015 the latest date for a season's first tropical storm since 1941. After its naming, Ana drifted westward, peaking in intensity with winds of 50 miles per hour (mph) before weakening. The storm later dissipated on September 7 without striking land.
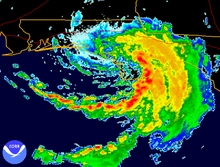
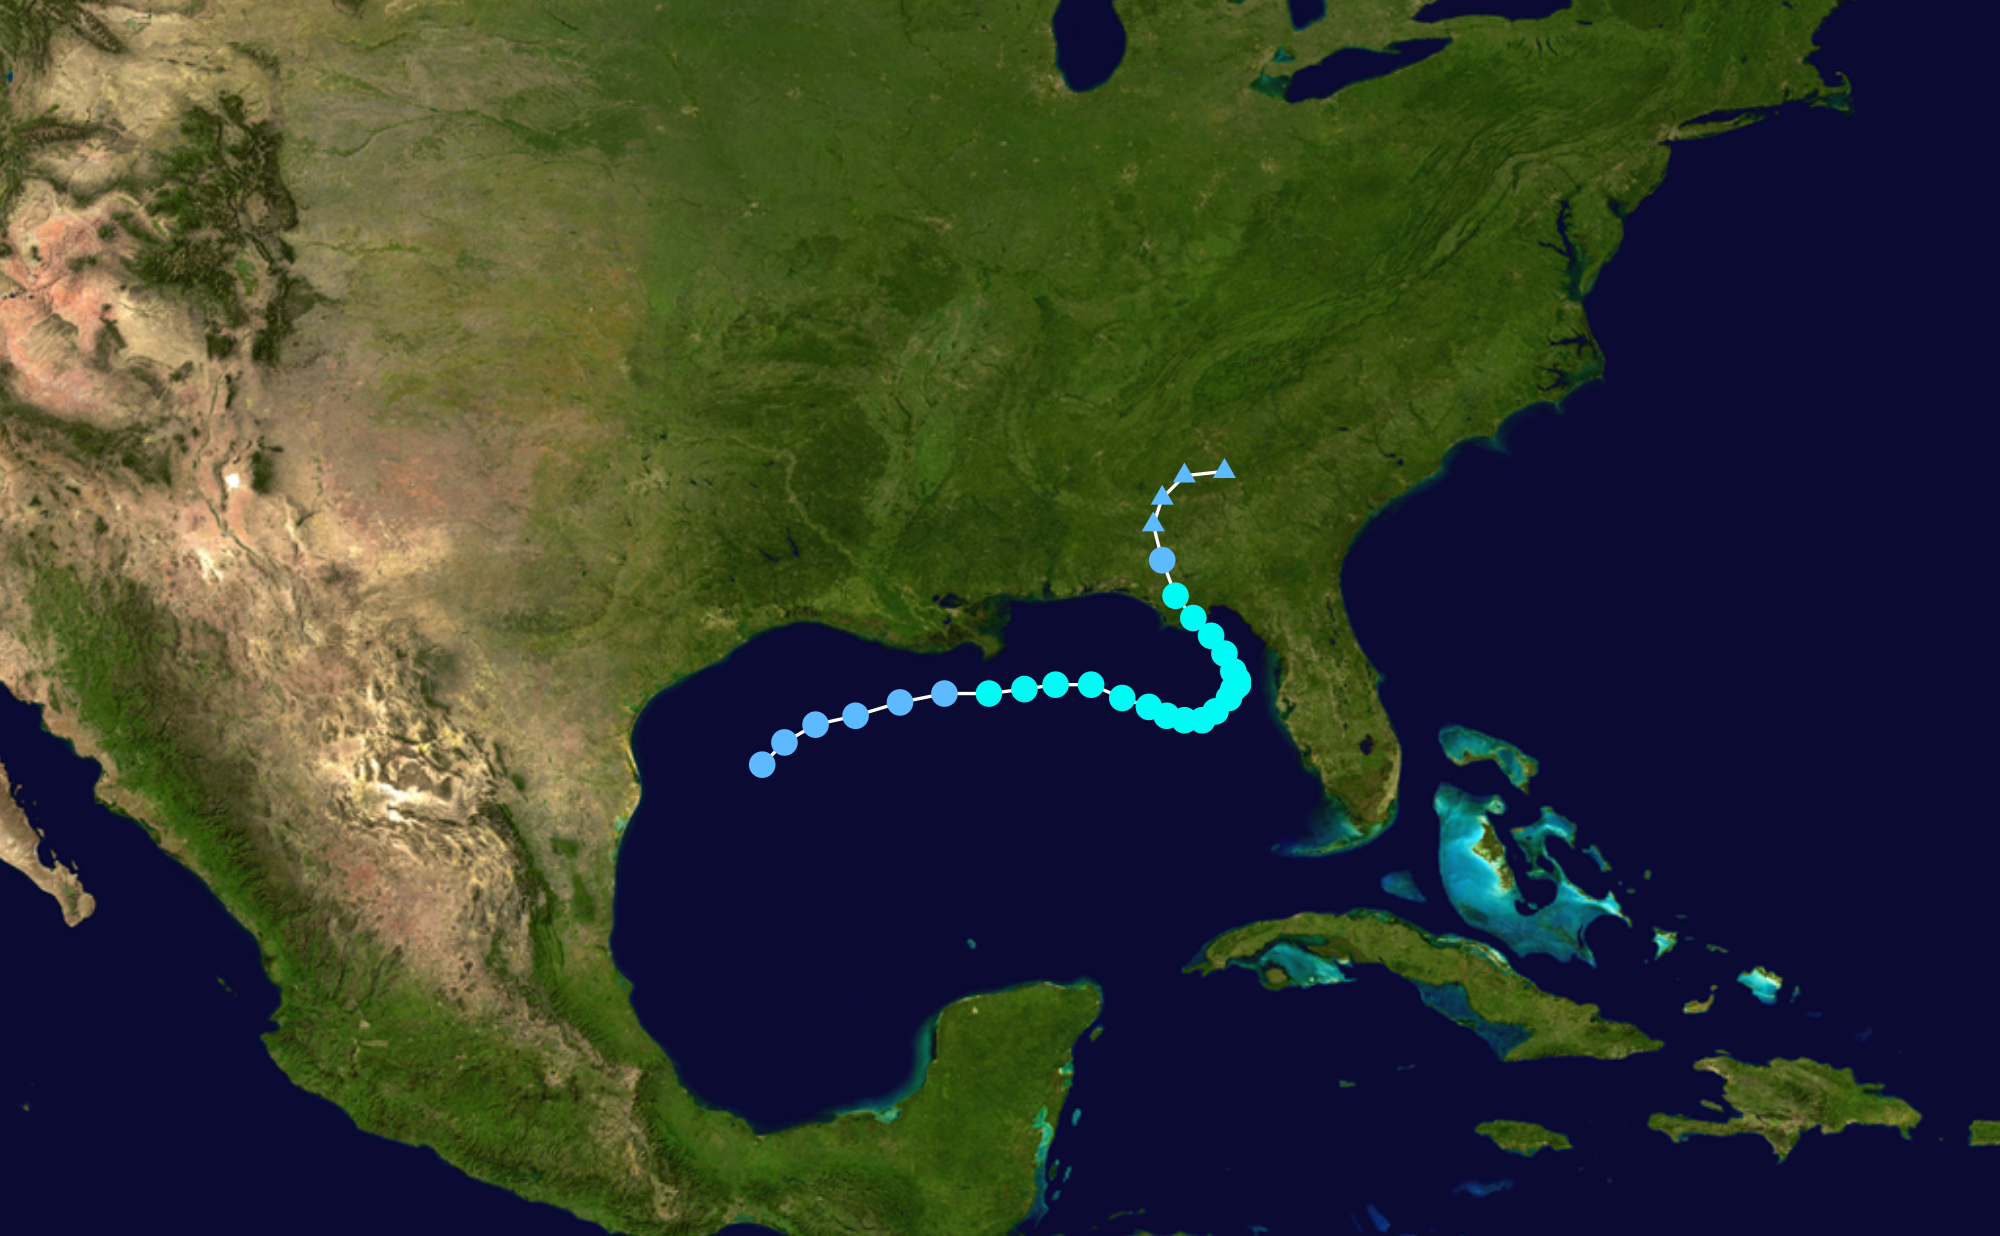
Hurricane Bill[]
| Category 3 hurricane (SSHWS) | |
  | |
| Duration | September 8 – September 16 |
|---|---|
| Peak intensity | 115 mph (185 km/h) (1-min) 967 mbar (hPa) |
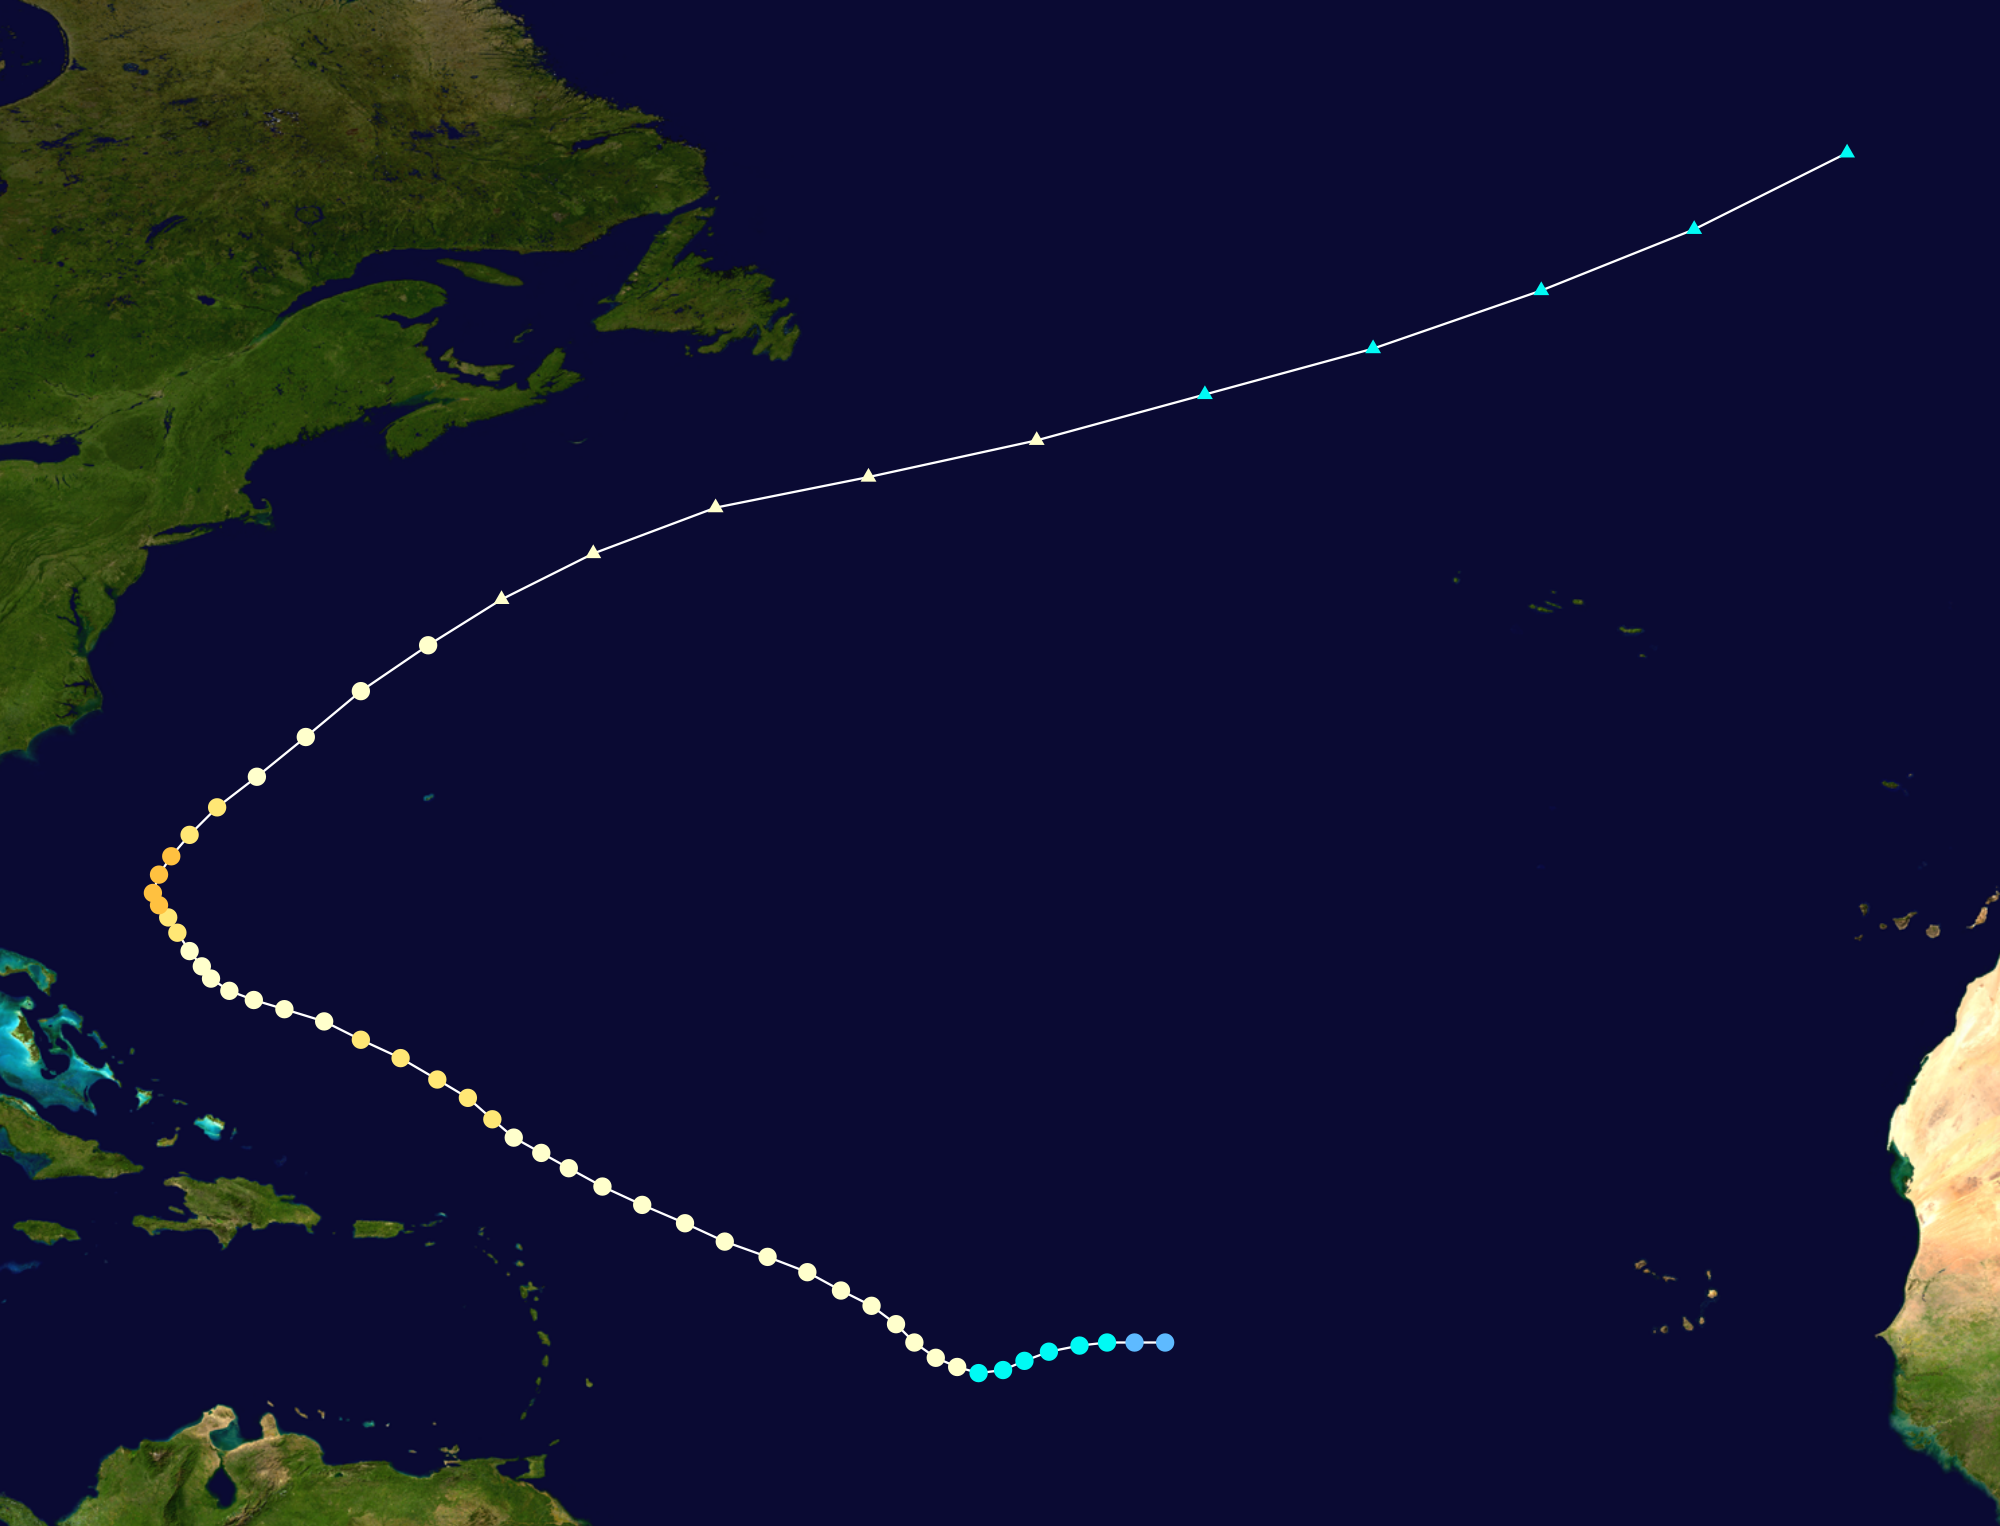
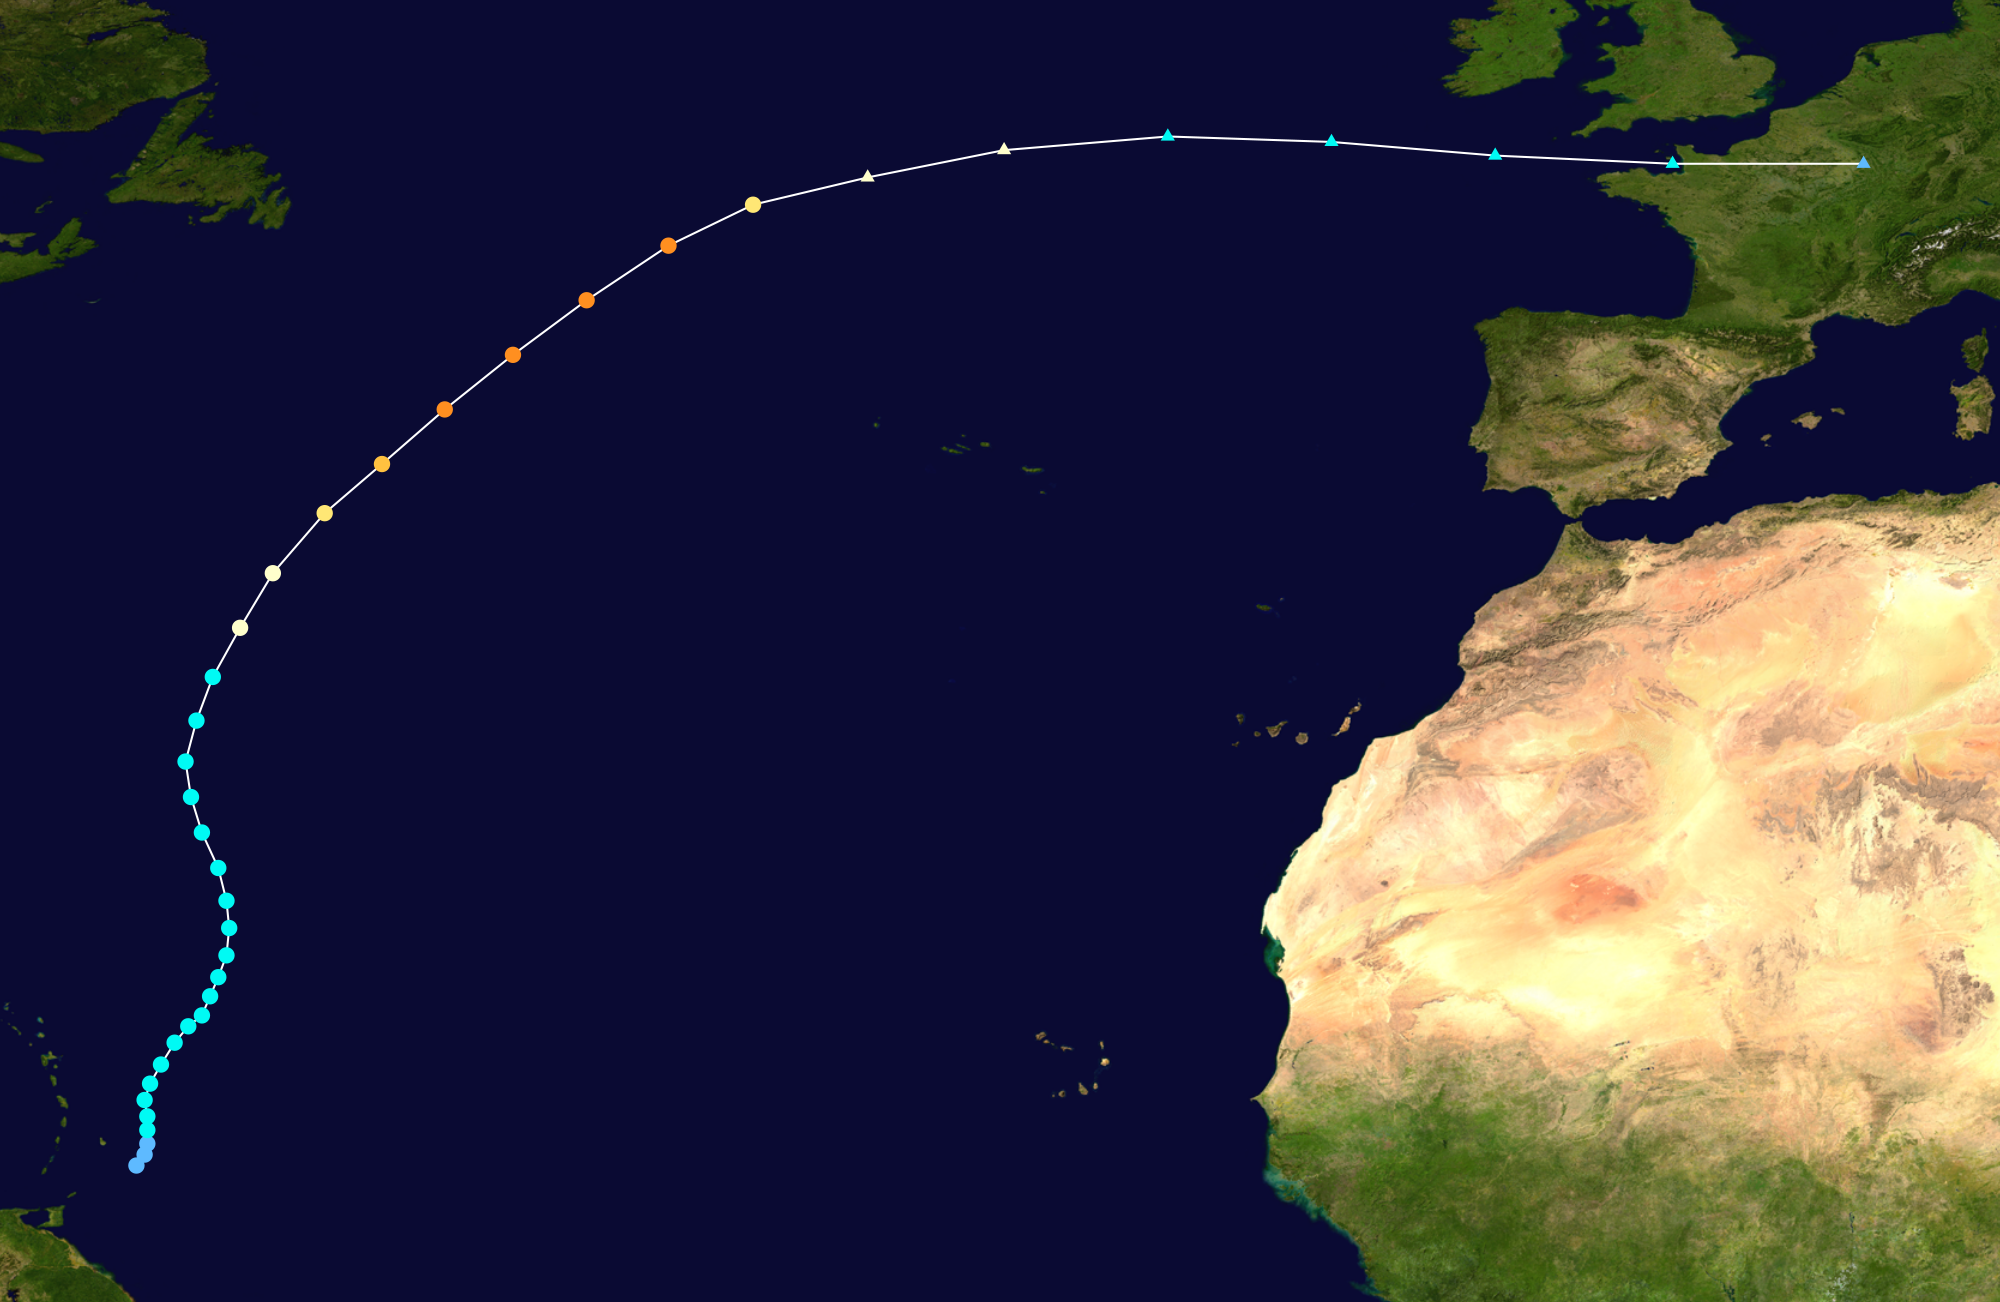
Hurricane Claudette[]
| Category 4 hurricane (SSHWS) | |
 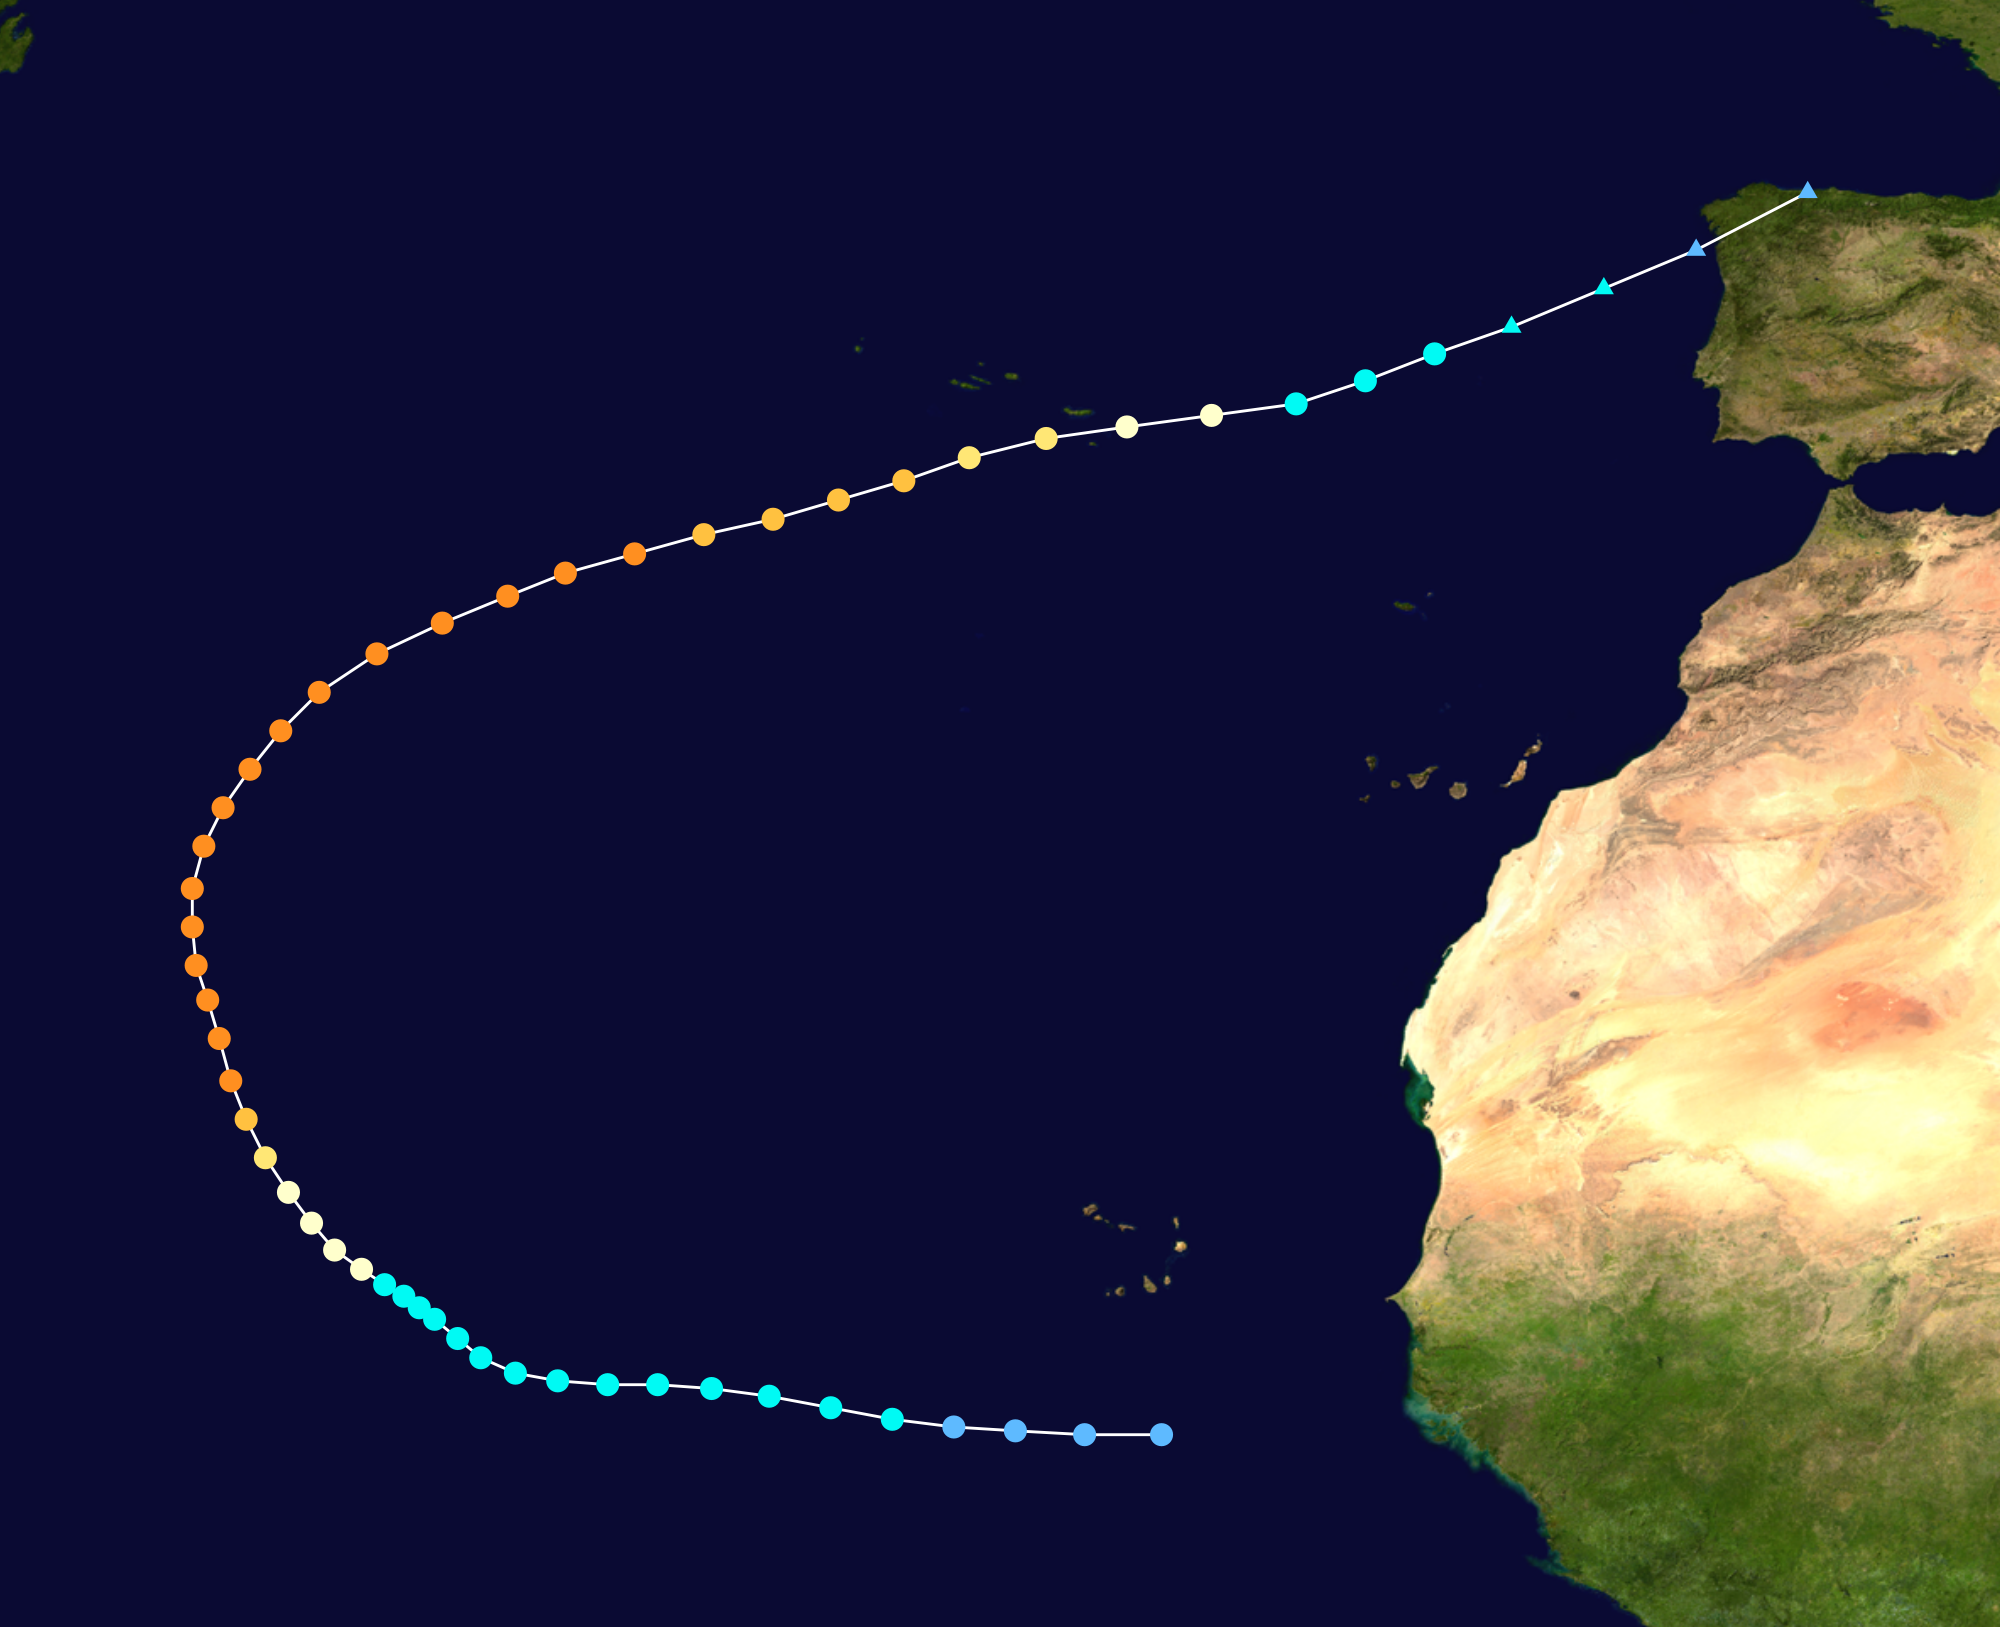 | |
| Duration | September 15 – September 27 |
|---|---|
| Peak intensity | 155 mph (250 km/h) (1-min) 919 mbar (hPa) |
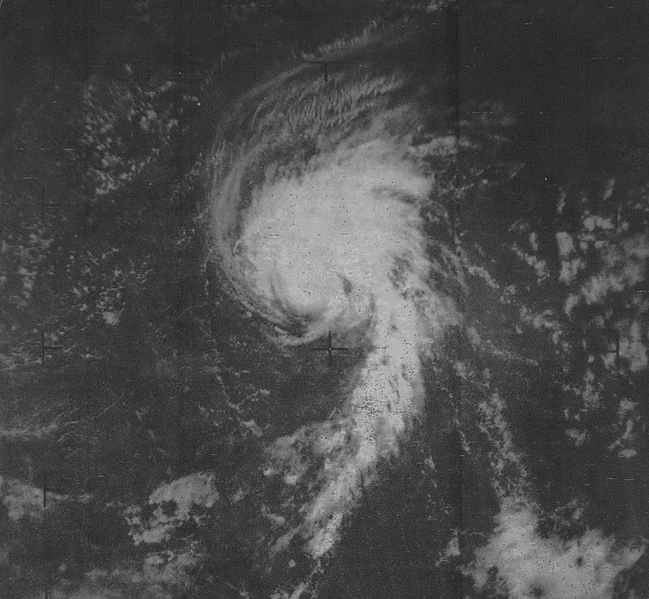
Hurricane Danny[]
| Category 5 hurricane (SSHWS) | |
  | |
| Duration | September 17 – September 26 |
|---|---|
| Peak intensity | 165 mph (270 km/h) (1-min) 912 mbar (hPa) |
Hurricane Erika[]
| Category 2 hurricane (SSHWS) | |
  | |
| Duration | September 23 – September 30 |
|---|---|
| Peak intensity | 110 mph (175 km/h) (1-min) 964 mbar (hPa) |
Hurricane Fred[]
| Category 1 hurricane (SSHWS) | |
  | |
| Duration | September 25 – October 2 |
|---|---|
| Peak intensity | 85 mph (135 km/h) (1-min) 987 mbar (hPa) |
Subtropical Storm Grace[]
| Subtropical storm (SSHWS) | |
  | |
| Duration | September 26 – September 30 |
|---|---|
| Peak intensity | 50 mph (80 km/h) (1-min) 997 mbar (hPa) |
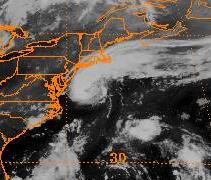
Hurricane Henri[]
| Category 4 hurricane (SSHWS) | |
  | |
| Duration | October 4 – October 16 |
|---|---|
| Peak intensity | 145 mph (230 km/h) (1-min) 921 mbar (hPa) |
Hurricane Ida[]
| Category 2 hurricane (SSHWS) | |
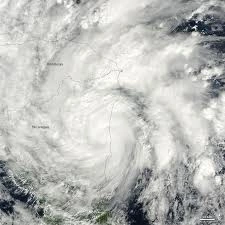  | |
| Duration | October 8 – October 14 |
|---|---|
| Peak intensity | 100 mph (160 km/h) (1-min) 973 mbar (hPa) |
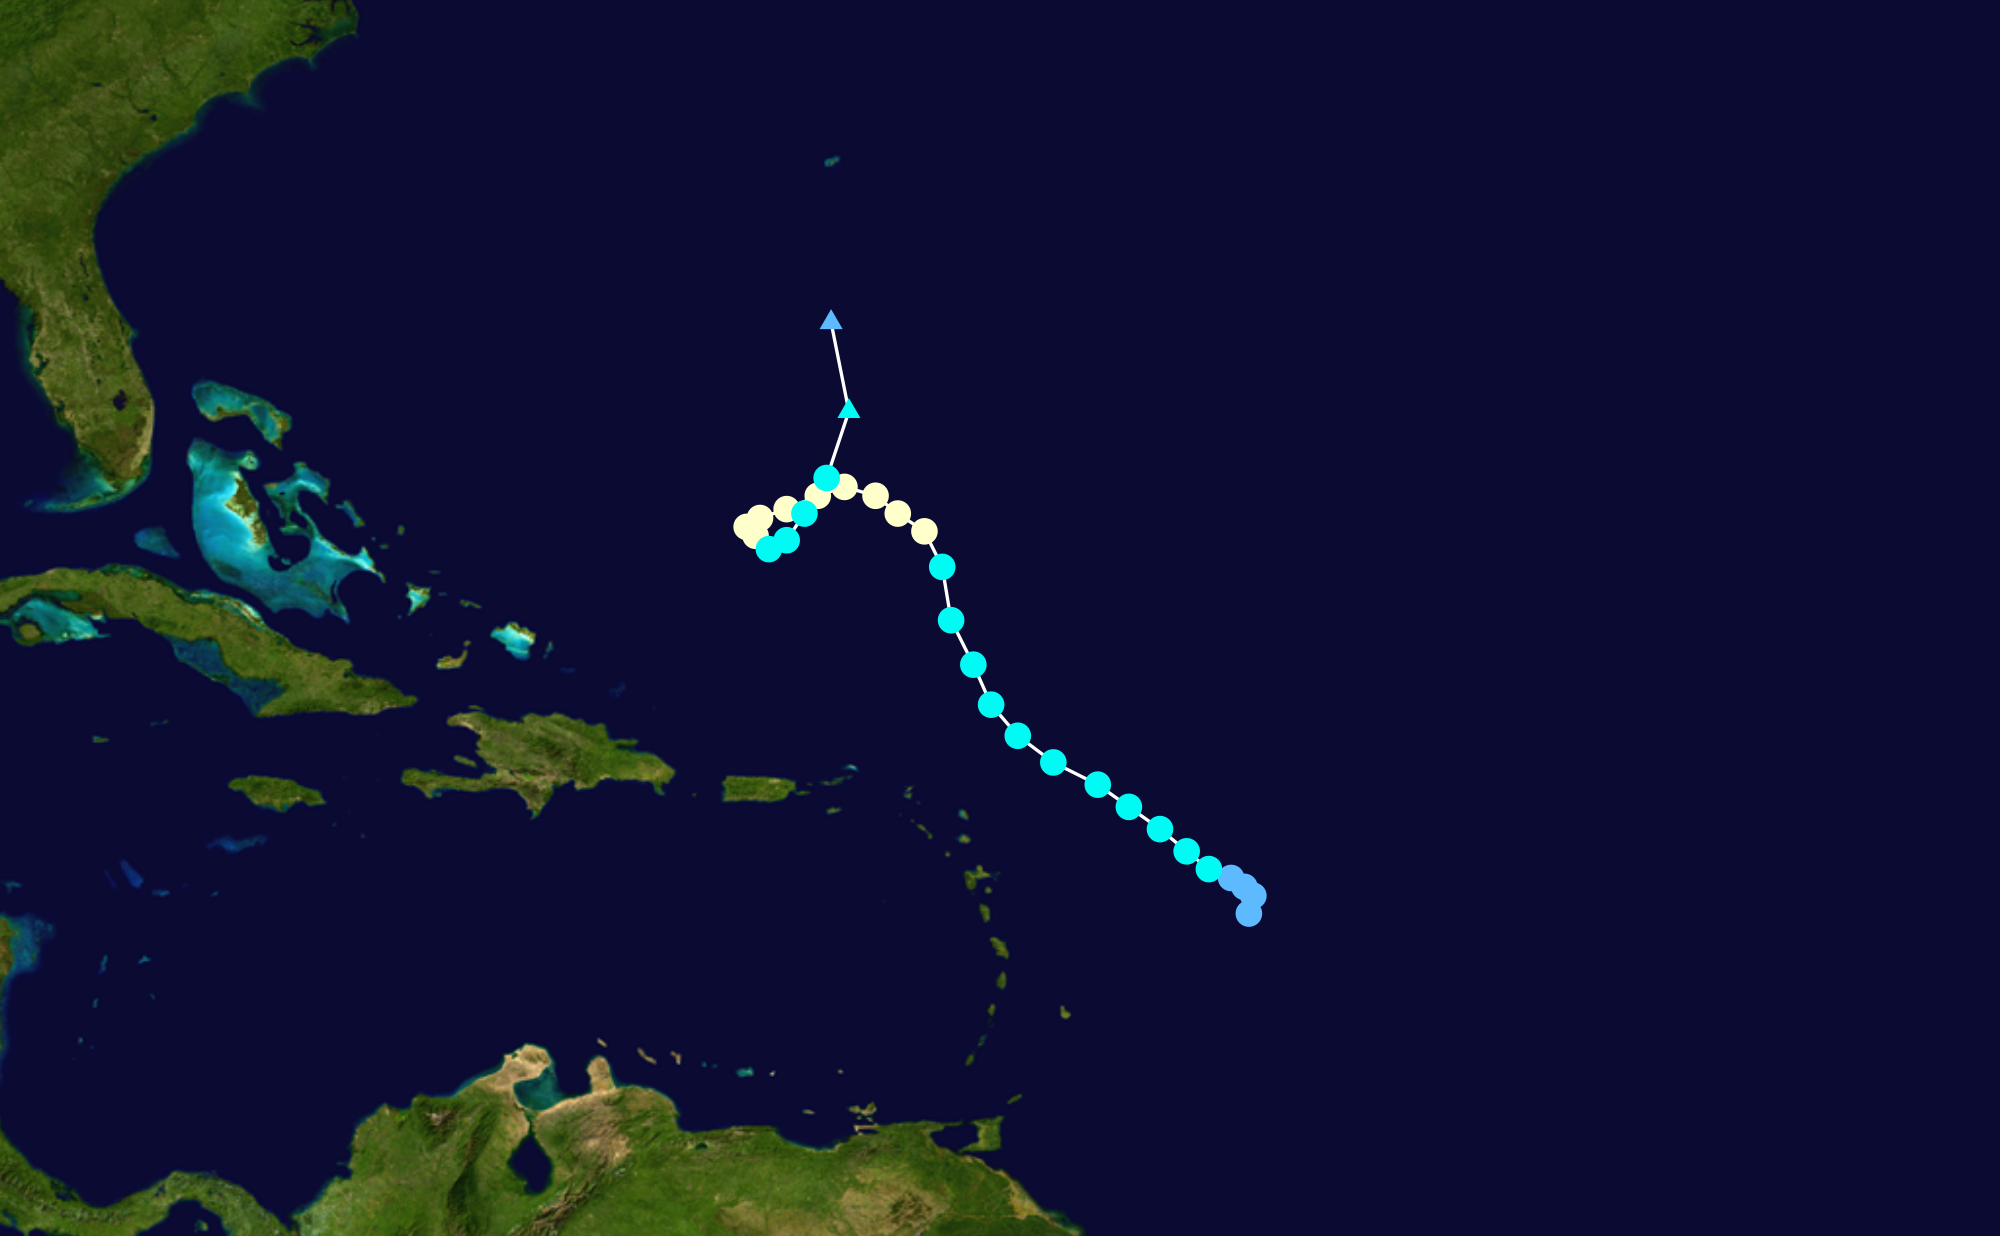
Tropical Storm Joaquin[]
| Tropical storm (SSHWS) | |
  | |
| Duration | October 15 – October 17 |
|---|---|
| Peak intensity | 45 mph (70 km/h) (1-min) 1002 mbar (hPa) |
Tropical Storm Larry[]
| Tropical storm (SSHWS) | |
  | |
| Duration | October 19 – October 25 |
|---|---|
| Peak intensity | 65 mph (100 km/h) (1-min) 993 mbar (hPa) |
Hurricane Kate[]
| Category 3 hurricane (SSHWS) | |
  | |
| Duration | October 20 – November 2 |
|---|---|
| Peak intensity | 120 mph (195 km/h) (1-min) 949 mbar (hPa) |
Tropical Storm Mindy[]
| Tropical storm (SSHWS) | |
  | |
| Duration | October 21 – October 27 |
|---|---|
| Peak intensity | 65 mph (100 km/h) (1-min) 993 mbar (hPa) |
Hurricane Nicholas[]
| Category 4 hurricane (SSHWS) | |
  | |
| Duration | November 4 – November 13 |
|---|---|
| Peak intensity | 140 mph (220 km/h) (1-min) 938 mbar (hPa) |
Hurricane Odette[]
| Category 1 hurricane (SSHWS) | |
  | |
| Duration | November 15 – November 22 |
|---|---|
| Peak intensity | 90 mph (150 km/h) (1-min) 981 mbar (hPa) |
Hurricane Peter[]
| Category 1 hurricane (SSHWS) | |
  | |
| Duration | November 25 – November 29 |
|---|---|
| Peak intensity | 85 mph (140 km/h) (1-min) 966 mbar (hPa) |
Season effects[]
This is a table of all of the storms that formed in the 2015 Atlantic hurricane season. It includes their duration, names, landfall(s) damages, and death totals. Deaths in parentheses are additional and indirect (an example of an indirect death would be a traffic accident), but were still related to that storm. Damage and deaths include totals while the storm was extratropical, a wave, or a low, and all of the damage figures are in 2015 USD.
| Storm name |
Dates active | Storm category at peak intensity | Max wind (mph (km/h)) |
Min. press. (mbar (inHg)) |
Landfall(s) | Damage (millions USD) |
Deaths | |||
|---|---|---|---|---|---|---|---|---|---|---|
| Where | When | Wind
(mph (km/h)) | ||||||||
| One | January 14 - January 18 |
Subtropical depression | 30 (45) | 1005 (29.68) | None | 0 | 0 | |||
| Two | August 30 - August 31 |
Tropical depression | 35 (55) | 1003 (29.62) | None | 0 | 0 | |||
| Ana | September 4 - September 7 |
Tropical storm | 50 (85) | 996 (29.41) | None | 0 | 0 | |||
| Bill | September 8 - September 16 |
Category 3 hurricane | 115 (185) | 967 (28.56) | Veracruz, Veracruz, Mexico |
September 14 | 115 (185) | 2,400 | 812 (204) | |
| Claudette | September 15 - September 27 |
Category 4 hurricane | 155 (250) | 919 (27.14) | Azores (Direct Hit) |
September 26 | 100 (160) | 0 | 0 | |
| Danny | September 17 - September 26 |
Category 5 hurricane | 165 (270) | 912 (26.93) | None | 0 | 0 | |||
| Erika | September 23 - September 30 |
Category 2 hurricane | 110 (175) | 964 (28.47) | None | 0 | 0 | |||
| Fred | September 25 - October 2 |
Category 1 hurricane | 85 (135) | 987 (29.15) | None | 0 | 0 | |||
| Grace | September 26 - October 1 |
Subtropical storm | 50 (80) | 997 (29.44) | None | Minimal | 0 (1) | |||
| Henri | October 4 - October 16 |
Category 4 hurricane | 145 (230) | 921 (27.20) | Puerto Rico | October 7 | 65 (100) | 100,000 | 740 (264) | |
| Bald Head Island, North Carolina | October 14 | 140 (225) | ||||||||
| Fisherman Island, Virginia | October 15 | 85 (140) | ||||||||
| Battery Park, New York City, New York | October 15 | 80 (130) | ||||||||
| Ida | October 8 - October 14 |
Category 2 hurricane | 100 (160) | 973 (28.73) | Tasbapauni, Nicaragua | October 13 | 100 (160) | 200 | 3 (3) | |
| Joaquin | October 15 - October 17 |
Tropical storm | 45 (70) | 1002 (29.59) | None | 0 | 0 | |||
| Larry | October 19 - October 25 |
Tropical storm | 65 (100) | 993 (29.32) | Newport, Rhode Island | October 24 | 40 (65) | 1,800 | 0 (1) | |
| Kate | October 20 - November 2 |
Category 3 hurricane | 120 (195) | 949 (28.02) | None | 0 | 0 | |||
| Mindy | October 21 - October 27 |
Tropical storm | 65 (100) | 993 (29.32) | St. Vincent Island, Florida | October 27 | 45 (70) | 1,200 | 1 (0) | |
| Nicholas | November 4 - November 13 |
Category 4 hurricane | 140 (220) | 938 (27.70) | None | 200 | 2 (0) | |||
| Odette | November 15 - November 22 |
Category 1 hurricane | 90 (150) | 981 (28.97) | None | 100 | 0 (1) | |||
| Peter | November 25 - November 29 |
Category 1 hurricane | 85 (140) | 966 (28.53) | None | 0 | 0 | |||
| Season Aggregates | ||||||||||
| 18 cyclones | January 14-November 29 | 165 (270) | 912 (26.93) | 8 landfalls | 105,900 | 1,558 (473) | ||||
Storm names[]
The following names were used to name storms that reached tropical or subtropical storm intensity in the North Atlantic Ocean during 2015. This list was the same naming list used in the 2009 season. A storm was named Joaquin for the first time in 2015. Joaquin replaced the name of a devestating hurricane that hit Halifax, Nova Scotia in 2003, Juan, but it was not used in 2009. Names that were allocated for the season but were not used are marked in gray.
|
|
|
Retirement[]
In the spring of 2016, at Session XXXVIII of the World Meteorological Organization (WMO)'s Regional Association Hurricane Committee, the World Meteorological Organization (WMO) retired the names Bill, Henri, Larry, and Mindy from List I of the Atlantic hurricane naming lists. Their replacements for the 2021 season will be Benito, Hadley, Levi, and Mora, respectively. Despite reports from Central America saying it caused memorable damage, the name Ida was not retired. Danny was a rare example of a Category 5 hurricane not getting its name retired because it did not affect land.
List for 2021[]
|
|
|