The 2114 Atlantic hurricane season originally started June 1st, 2114 and ended November 30th, 2114, but ran year-round due to storms forming in January and December.
Of Course, the formation of tropical cyclones is possible at any time of the year.
Seasonal forecasts[]
| Source | Date | Named
storms |
Hurricanes | Major
hurricanes | |
| NOAA | May 29, 2114 | 11 | 5 | 2 | |
| ––––––––––––––––––––––––––––––––––––––––––––––––––––––– | |||||
| Actual activity | 8 | 5 | 3 | ||
Season Summary[]
The 2114 Atlantic hurricane season was a somewhat below Average season despite Neutral Conditions.
It saw 9 Depressions, 8 Storms, 5 Hurricanes and 3 Major.
In Total, the season caused $100 billion (2016 USD) and killed 1,492.
Storms[]
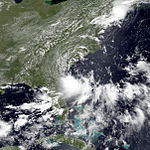
Tropical Storm Arturo[]
| Tropical storm (SSHWS) | |
  | |
| Duration | January 19 – January 22 |
|---|---|
| Peak intensity | 40 mph (65 km/h) (1-min) 1000 mbar (hPa) |
Tropical Depression Two[]
| Tropical depression (SSHWS) | |
  | |
| Duration | January 29 – January 31 |
|---|---|
| Peak intensity | 35 mph (55 km/h) (1-min) 1004 mbar (hPa) |
Tropical Storm Bianca[]
| Tropical storm (SSHWS) | |
  | |
| Duration | May 27 – May 31 |
|---|---|
| Peak intensity | 60 mph (95 km/h) (1-min) 995 mbar (hPa) |
Hurricane Craig[]
| Category 2 hurricane (SSHWS) | |
  | |
| Duration | July 4 – July 13 |
|---|---|
| Peak intensity | 105 mph (165 km/h) (1-min) 962 mbar (hPa) |
Hurricane Dina[]
| Category 1 hurricane (SSHWS) | |
  | |
| Duration | August 1 – August 6 |
|---|---|
| Peak intensity | 75 mph (120 km/h) (1-min) 987 mbar (hPa) |
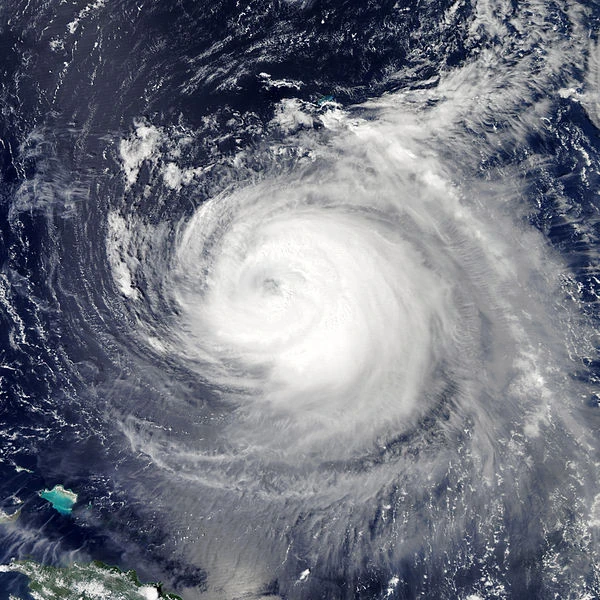
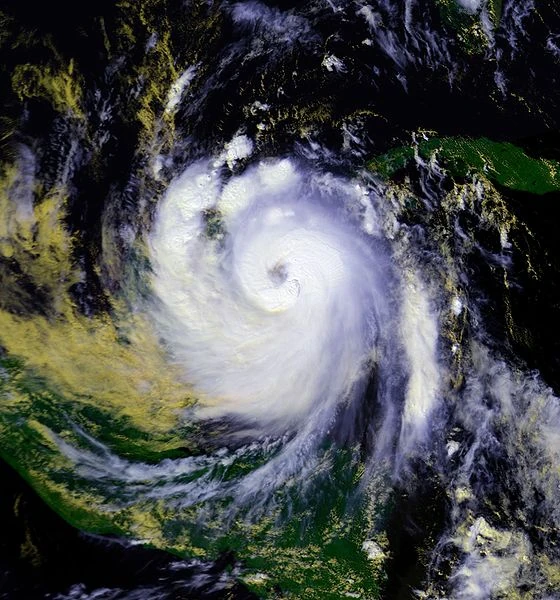
Hurricane Elmer[]
| Category 4 hurricane (SSHWS) | |
  | |
| Duration | August 31 – September 15 |
|---|---|
| Peak intensity | 145 mph (230 km/h) (1-min) 934 mbar (hPa) |
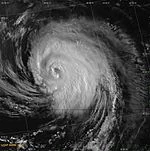
Hurricane Fionna[]
| Category 4 hurricane (SSHWS) | |
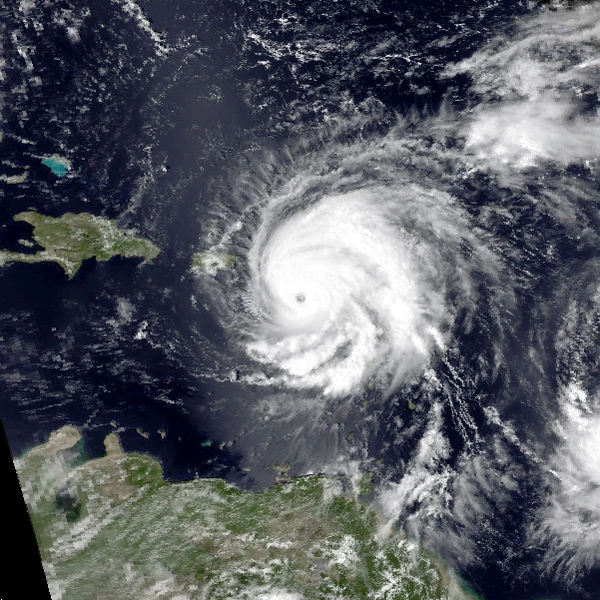  | |
| Duration | September 30 – October 19 |
|---|---|
| Peak intensity | 145 mph (230 km/h) (1-min) 934 mbar (hPa) |
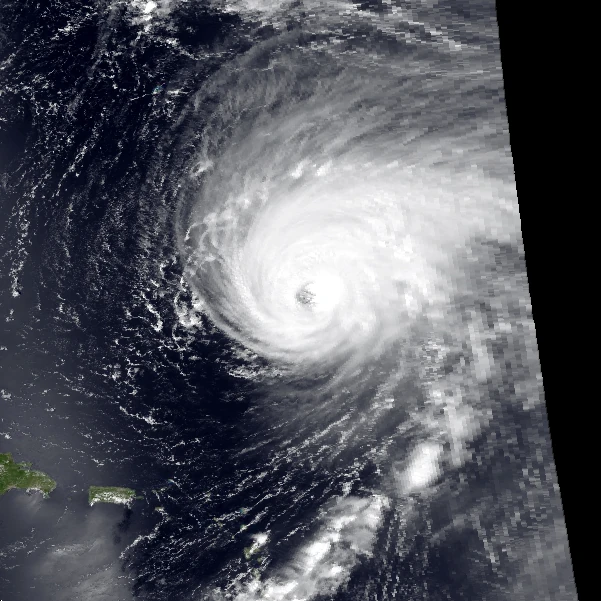
Hurricane Grant[]
| Category 3 hurricane (SSHWS) | |
  | |
| Duration | October 31 – November 10 |
|---|---|
| Peak intensity | 125 mph (205 km/h) (1-min) 945 mbar (hPa) |
Tropical Storm Hailey[]
| Tropical storm (SSHWS) | |
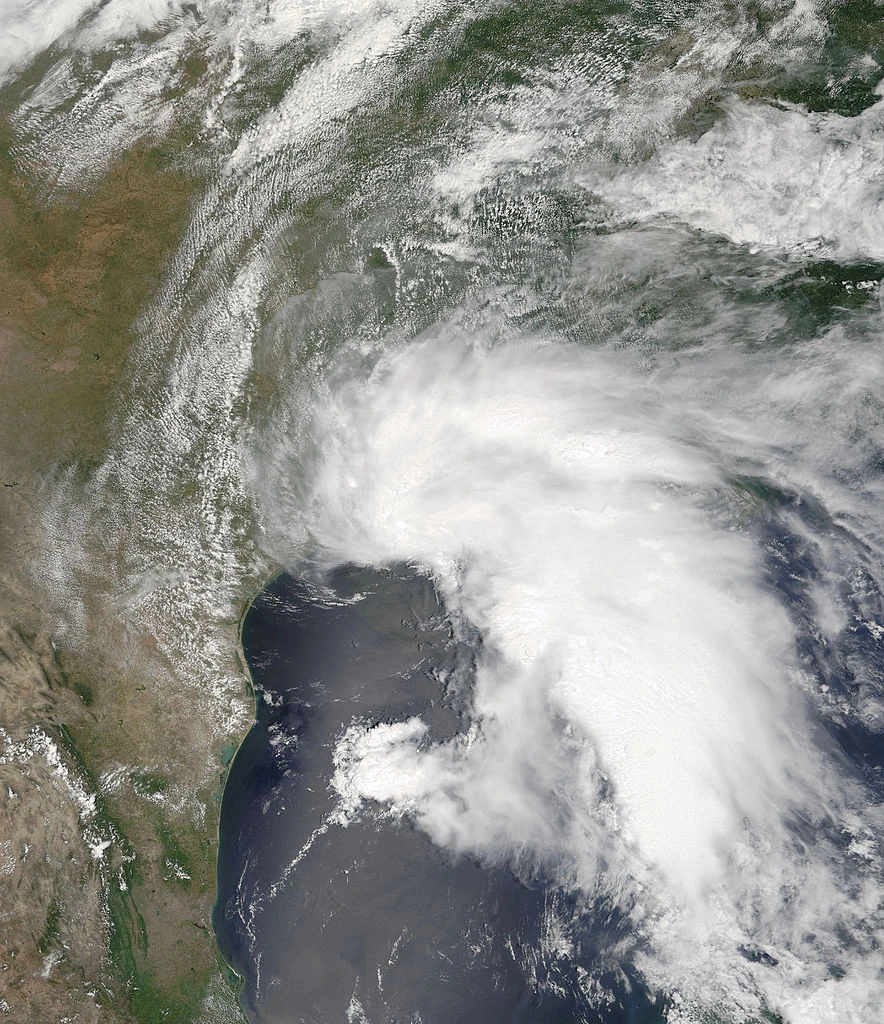  | |
| Duration | December 21 – December 26 |
|---|---|
| Peak intensity | 70 mph (110 km/h) (1-min) 988 mbar (hPa) |
Timeline[]

Accumulated Cyclone Energy (ACE) Rating[]
| ACE (104 kt2) – Storm: Source | |||||
|---|---|---|---|---|---|
| 1 | 45.0 | Fionna | 12 | 0.00 | Storm |
| 2 | 40.0 | Elmer | 13 | 0.00 | Storm |
| 3 | 20.1 | Grant | 14 | 0.00 | Storm |
| 4 | 12.9 | Craig | 15 | 0.00 | Storm |
| 5 | 7.00 | Dina | 16 | 0.00 | Storm |
| 6 | 5.22 | Hailey | 17 | 0.00 | Storm |
| 7 | 4.44 | Bianca | 18 | 0.00 | Storm |
| 8 | 1.90 | Arturo | 19 | 0.00 | Storm |
| 9 | 0.00 | Storm | 20 | 0.00 | Storm |
| 10 | 0.00 | Storm | 21 | 0.00 | Storm |
| 11 | 0.00 | Storm | 22 | 0.00 | Storm |
| Total=136.56 | |||||
ACE is the result of a storm's winds multiplied by how long it lasted for, so storms or subtropical storms (Originally not included up until 2012) that at lasted a long time , as well as particularly strong hurricanes , have higher ACE totals. Tropical Depressions are not included in season total.