The 2008 Atlantic hurricane season began on June 1, 2008 and ended November 30th, 2008.
Seasonal forecasts[]
| Source | Date | Named
storms |
Hurricanes | Major
hurricanes | |
| NOAA | May 10, 2007 | 18 | 10 | 5 | |
| ––––––––––––––––––––––––––––––––––––––––––––––––––––––– | |||||
| Actual activity | 0 | 0 | 0 | ||
Season Summary[]
Storms[]
|
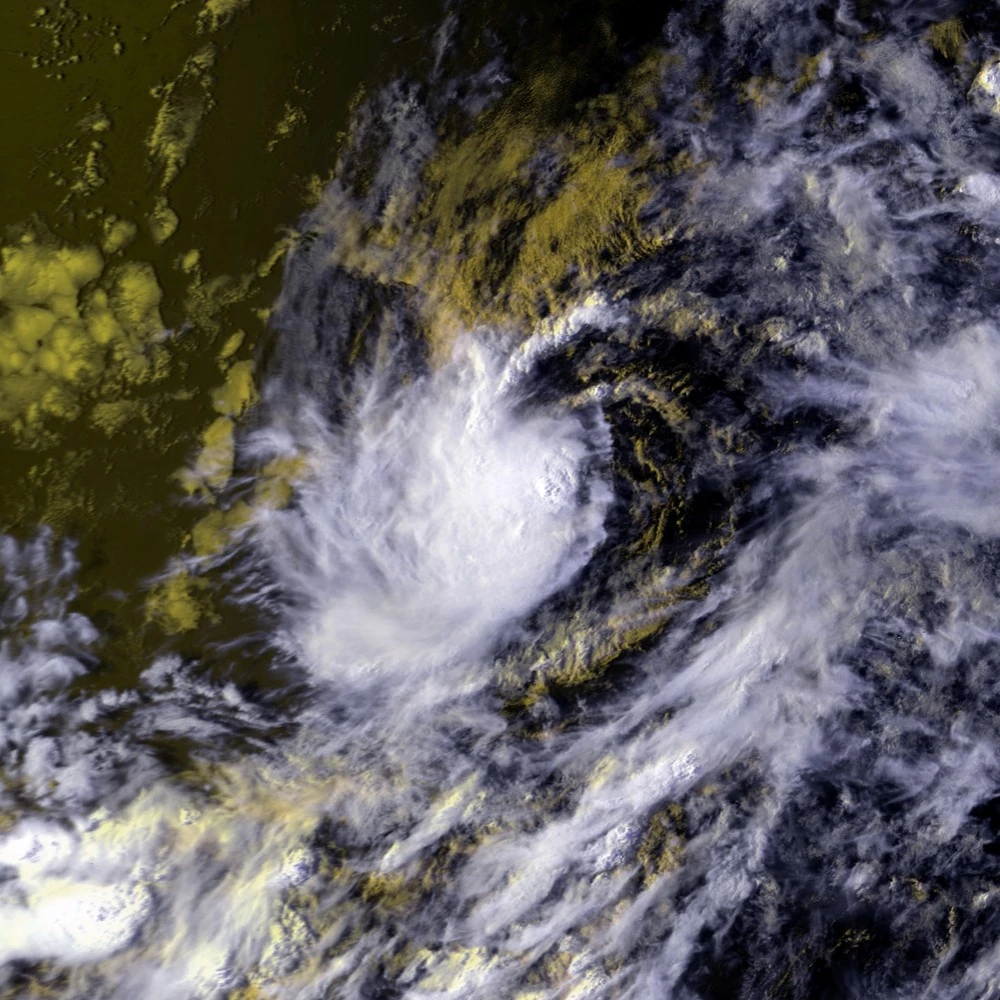
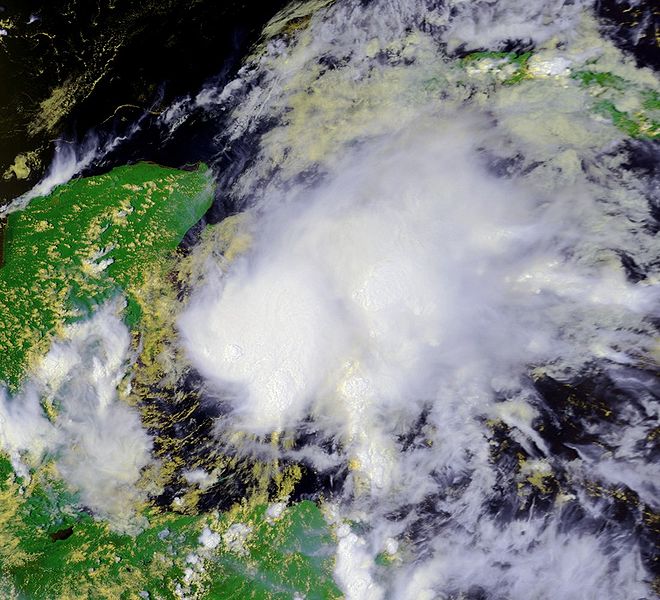
Tropical Storm Arthur[]
| Tropical storm (SSHWS) | |
 | |
| Duration | June 3 – June 7 |
|---|---|
| Peak intensity | 50 mph (85 km/h) (1-min) 996 mbar (hPa) |
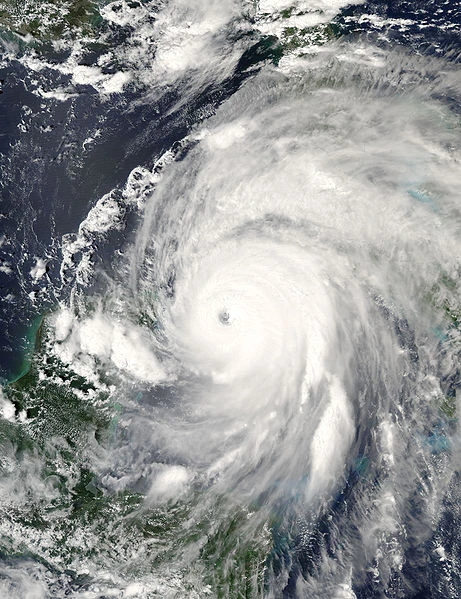
Hurricane Bertha[]
| Category 4 hurricane (SSHWS) | |
 | |
| Duration | June 30 – July 15 |
|---|---|
| Peak intensity | 145 mph (230 km/h) (1-min) 934 mbar (hPa) |
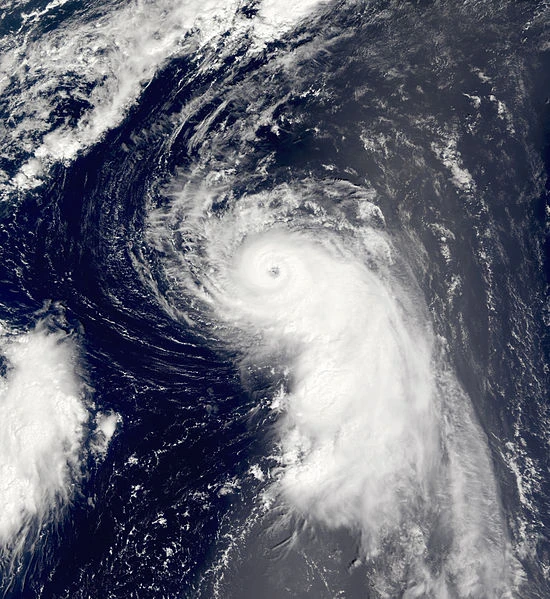
Hurricane Cristobal[]
| Category 2 hurricane (SSHWS) | |
 | |
| Duration | July 4 – July 11 |
|---|---|
| Peak intensity | 105 mph (165 km/h) (1-min) 962 mbar (hPa) |
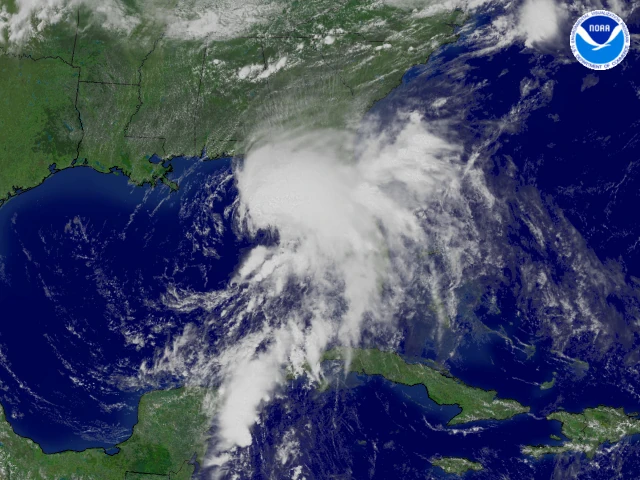
Tropical Storm Dolly[]
| Tropical storm (SSHWS) | |
 | |
| Duration | July 14 – July 19 |
|---|---|
| Peak intensity | 50 mph (85 km/h) (1-min) 1000 mbar (hPa) |
Tropical Storm Edouard[]
| Tropical storm (SSHWS) | |
 | |
| Duration | July 31 – August 5 |
|---|---|
| Peak intensity | 70 mph (110 km/h) (1-min) 986 mbar (hPa) |
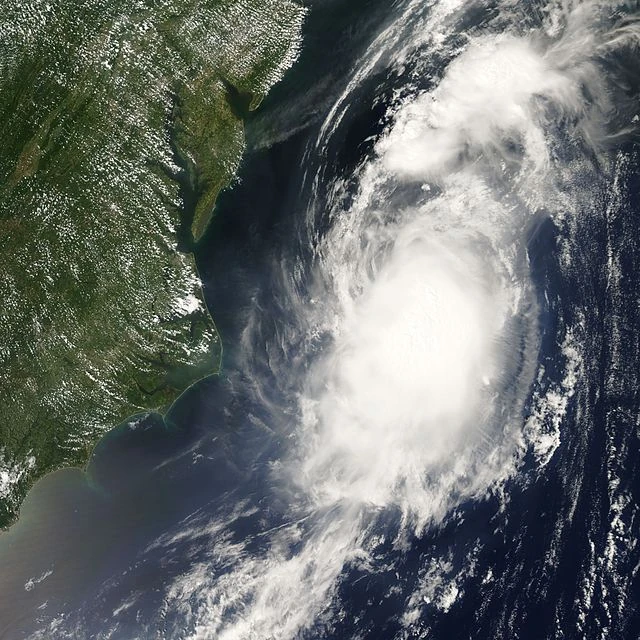
Hurricane Fay[]
| Category 4 hurricane (SSHWS) | |
 | |
| Duration | August 6 – August 18 |
|---|---|
| Peak intensity | 135 mph (215 km/h) (1-min) 940 mbar (hPa) |
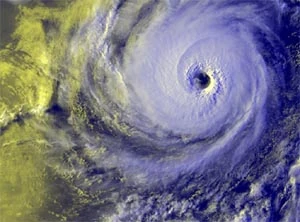
Hurricane Gustav[]
| Category 5 hurricane (SSHWS) | |
 | |
| Duration | August 10 – August 24 |
|---|---|
| Peak intensity | 165 mph (270 km/h) (1-min) 911 mbar (hPa) |
Hurricane Hanna[]
| Category 3 hurricane (SSHWS) | |
 | |
| Duration | August 15 – August 31 |
|---|---|
| Peak intensity | 115 mph (185 km/h) (1-min) 960 mbar (hPa) |
Hurricane Ike[]
| Category 5 hurricane (SSHWS) | |
 | |
| Duration | August 16 – September 3 |
|---|---|
| Peak intensity | 175 mph (280 km/h) (1-min) 909 mbar (hPa) |
Hurricane Josephine[]
| Category 2 hurricane (SSHWS) | |
 | |
| Duration | August 21 – September 4 |
|---|---|
| Peak intensity | 110 mph (175 km/h) (1-min) 958 mbar (hPa) |
Hurricane Kyle[]
| Category 3 hurricane (SSHWS) | |
 | |
| Duration | August 26 – September 4 |
|---|---|
| Peak intensity | 125 mph (205 km/h) (1-min) 943 mbar (hPa) |
Tropical Storm Laura[]
| Tropical storm (SSHWS) | |
 | |
| Duration | August 30 – September 4 |
|---|---|
| Peak intensity | 70 mph (110 km/h) (1-min) 985 mbar (hPa) |
Timeline[]

Storm names[]
The following names will be used to name tropical and subtropical cyclones in the 2008 season.
|
|
|
Accumulated Cyclone Energy (ACE) Rating[]
| ACE (104 kt2) – Storm: Source | |||||
|---|---|---|---|---|---|
| 1 | 0.00 | Storm | 12 | 0.00 | Storm |
| 2 | 0.00 | Storm | 13 | 0.00 | Storm |
| 3 | 0.00 | Storm | 14 | 0.00 | Storm |
| 4 | 0.00 | Storm | 15 | 0.00 | Storm |
| 5 | 0.00 | Storm | 16 | 0.00 | Storm |
| 6 | 0.00 | Storm | 17 | 0.00 | Storm |
| 7 | 0.00 | Storm | 18 | 0.00 | Storm |
| 8 | 0.00 | Storm | 19 | 0.00 | Storm |
| 9 | 0.00 | Storm | 20 | 0.00 | Storm |
| 10 | 0.00 | Storm | 21 | 0.00 | Storm |
| 11 | 0.00 | Storm | 22 | 0.00 | Storm |
| Total=0.0 | |||||
ACE is the result of a storm's winds multiplied by how long it lasted for, so storms or subtropical storms (Originally not included up until 2012) that at lasted a long time , as well as particularly strong hurricanes , have higher ACE totals. Tropical Depressions are not included in season total.
Season effects[]
This is a table of the storms and their effects in the 2008 Atlantic hurricane season. This table includes the storm's names, duration, peak intensity, Areas affected (bold indicates made landfall in that region at least once), damages, and death totals. Deaths in parentheses are additional and indirect (an example of an indirect death would be a traffic accident), but are still storm-related. Damage and deaths include totals while the storm was extratropical, a wave or a low. All of the damage figures are in 2015 USD (the listed damage figure is in millions).
| Storm name |
Dates active | Storm category at peak intensity |
Max 1-min wind mph (km/h) |
Min. press. (mbar) |
Areas affected | Damage (USD) |
Deaths |
|---|---|---|---|---|---|---|---|
| Storm | June 0 – June 0 | Tropical depression | 0 (0) | 0 | None | 0 | 0 |