The 2014 Pacific hurricane season was tied with 1983, 1984, and 1990 for the fourth most active Pacific hurricane season on record in terms of total storms. All 21 tropical cyclones developed within the National Hurricane Center (NHC)'s area of warning responsibility, containing the Pacific Ocean east of 140°W. Although no depressions formed within the Central Pacific Hurricane Center (CPHC)'s area of warning responsibility (140°W to the International Date Line), twelve storms existed within the region, an all time record. The season began on May 15, 2014 for the NHC area of jurisdiction and on June 1, 2014 for the CPHC area of jurisdiction, and ended on November 30, 2014 for both regions. These dates conventionally delimit the time tropical cyclones form in the Eastern Pacific basin.
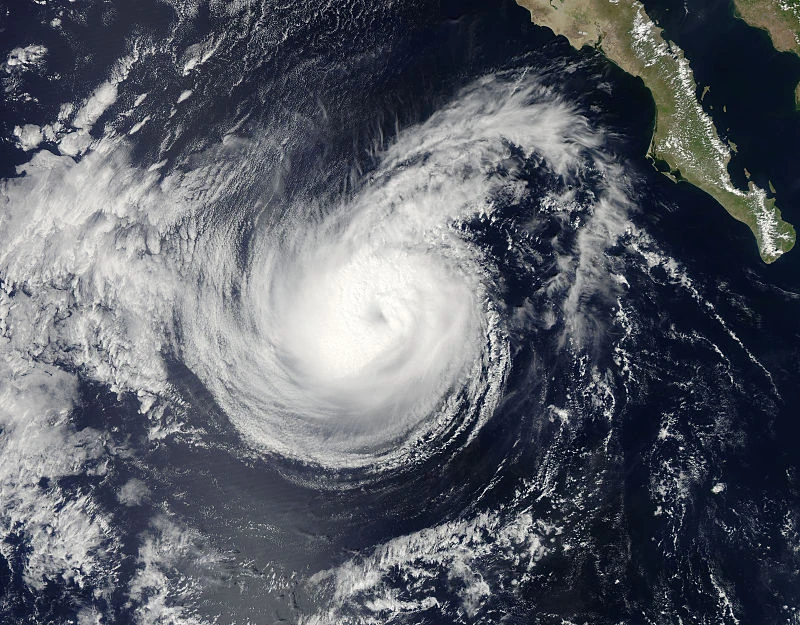
The strongest and storm was Hurricane Elida, which reached Category 5 intensity (or 160 mile per hour (mph) winds and a 899 millibar (mb) pressure). It did not harm land in any way. The longest-lasting storm was Hurricane Vance, lasting 16.25 days. Unusually, no damage or direct deaths were caused this year.
Seasonal forecasts[]
| Source | Date | Named storms |
Hurricanes | Major hurricanes | |
| Average (1971–2006) | 15.3 | 8.8 | 4.2 | ||
| Record high activity | 28 | 18 | 10 (tie) | ||
| Record low activity | 8 (tie) | 3 | 0 (tie) | ||
| ––––––––––––––––––––––––––––––––––––––––––––––––––––––– | |||||
| NOAA | May 26, 2014 | 15-21 | 10-13 | 7-9 | |
| ––––––––––––––––––––––––––––––––––––––––––––––––––––––– | |||||
| Actual activity | 21 | 18 | 10 | ||
On May 26, the Climate Prediction Center released its pre-season outlook. The scientists stated a 15% chance of a below-normal season, a 25% chance of a near-normal season and a 60% chance of an above-normal season. The climatologists expected 15–21 named storms, with 10–13 becoming hurricanes, and 7–9 becoming major hurricanes. The below-normal activity forecast was because of decreased wind shear and a high expectation of El Niño conditions throughout the summer.
Season summary[]
|
The 2014 Pacific hurricane season was among the most active Pacific hurricanes ever recorded. This was mainly caused by the strongest El Niño recorded since 1997, which was responsible for warming sea sea surface temperatures as high as three degrees (Farenheit) above normal. Two additional unusual features were observed in the 2014 Pacific hurricane season: all but three of the depressions (Tropical Storms Cristina, Lowell, and Trudy) that formed this year became hurricanes (18, two ahead of the previous record set in 1990 and 1992) with 10 further intensifying into major (Category 3 on the Saffir-Simpson Hurricane Scale) hurricanes. Also, no storms made landfall this year, partly caused by a trough sitting over the United States West Coast steered almost all of the detected tropical waves out to sea.
The year began with two tropical storms (Amanda and Boris) forming in May, with both intensifying into hurricanes. This marked the first time since the start of the satellite era in 1971 two hurricanes formed in May and two tropical storms formed in May for three consecutive years. Although neither Amanda nor Boris had any land effects while tropical, Boris's extratropical remnants made landfall near Tacoma, Washington as Mount Saint Helens violently erupted, causing rain clouds to mix with the ash clouds and form deadly lahars, killing dozens of people.
June saw the formation of four tropical storms (Cristina, Douglas, Elida, and Fausto). Two of the storms, Douglas and Elida, intensified into hurricanes that ultimately became major hurricanes, marking the first time since 2010 two major hurricanes formed in June. However, none of the June storms affected any land.
July was even more active. Although July, like June, saw four tropical storms form (Genevieve, Hernan, Iselle, and Julio), all four intensified into hurricanes, with Genevieve, Iselle, and Julio further became major hurricanes. In addition, Fausto reached its peak intensity in July. Of all the storms, though, only Genevieve had any impacts on land, by bringing a trace of rain to Baja California Sur. As the month ended, 10 total storms, nine hurricanes, and six major hurricanes had developed, which forecasters described as the possibility of a hyperactive year.
August continued the trend of an above normal season. Five storms (Karina, Lowell, Marie, Norbert, and Odile) developed, with all the storms except Lowell becoming hurricanes. In addition, Julio lasted two days into the month. Two of the hurricanes, Marie and Norbert, eventually became long-lived, intense major hurricanes. Norbert became the first storm since Hurricane Jimena in 2003 to exist in the Eastern, Central, and Western Pacific basins as one storm. Despite the intensity of several storms, only Lowell and Norbert affected land, by bringing overcast clouds and rough wave action to Mexico and Hawaii, respectively.
Activity in September began to slow down, partly because El Niño conditions were faltering. Only three storms formed in September (Polo, Rachel, and Simon), but all three storms became hurricanes. In addition, Hurricanes Norbert and Odile lasted into the month. Polo went on to become a massive major hurricane. Luckily, none of the September storms affected land.
October was also quiet compared to the previous months. A total of two storms, Tropical Storm Trudy and Hurricane Vance, were able to complete tropical cyclogenesis. Hurricane Simon also lasted six days into the month. This also marked the first October since 2010 without a major hurricane. However, Vance lasted an unusually long time for an October system.
November ended the season with a rare, long-lasting hurricane, Winnie (although Hurricane Vance lasted two days into November). It peaked as a minor hurricane, and it was the second strongest Northeastern Pacific November tropical cyclone ever recorded since 1971 (behind Hurricane Kenneth in 2011) and the longest-lasting, eclipsing Hurricane Sergio in 2006.
The season generated an above normal accumulated cyclone energy (ACE) of 274, the second highest ACE on record (surpassed only by 1992).
Timeline[]

List of storms[]
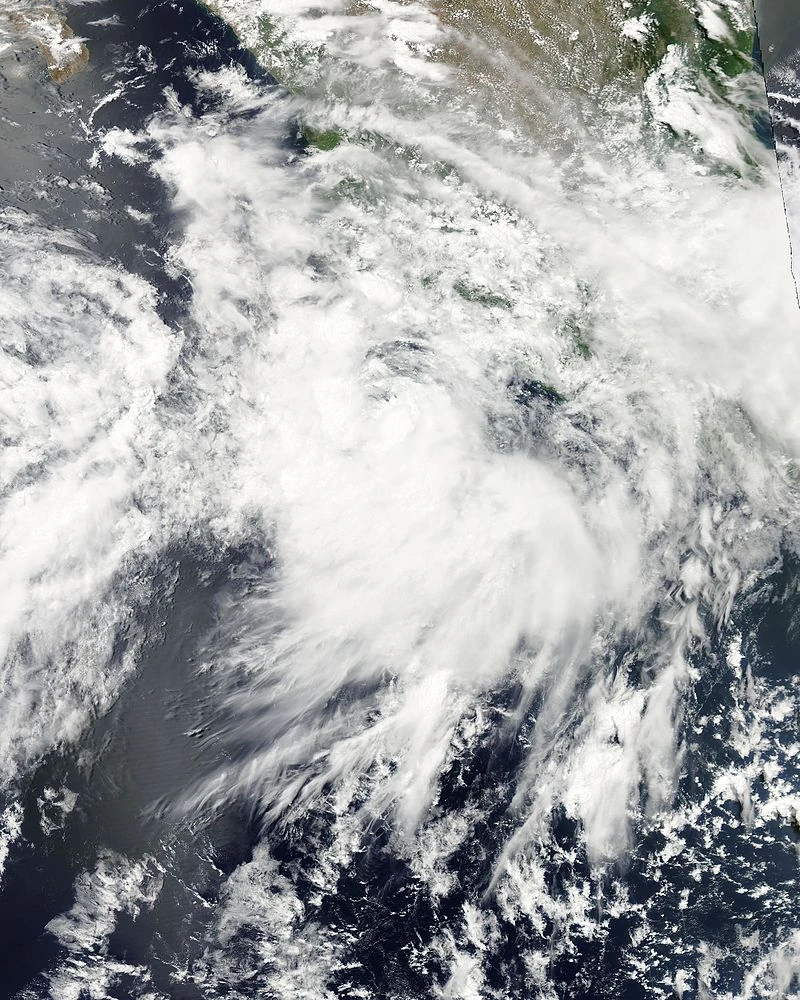
Hurricane Amanda[]
| Category 1 hurricane (SSHWS) | |
 | |
| Duration | May 17 – May 22 |
|---|---|
| Peak intensity | 85 mph (140 km/h) (1-min) 987 mbar (hPa) |
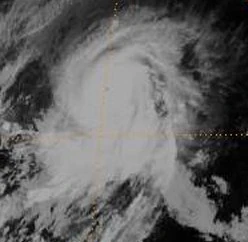
Hurricane Boris[]
| Category 1 hurricane (SSHWS) | |
 | |
| Duration | May 24 – June 3 (Extratropical after May 28) |
|---|---|
| Peak intensity | 90 mph (150 km/h) (1-min) 981 mbar (hPa) |
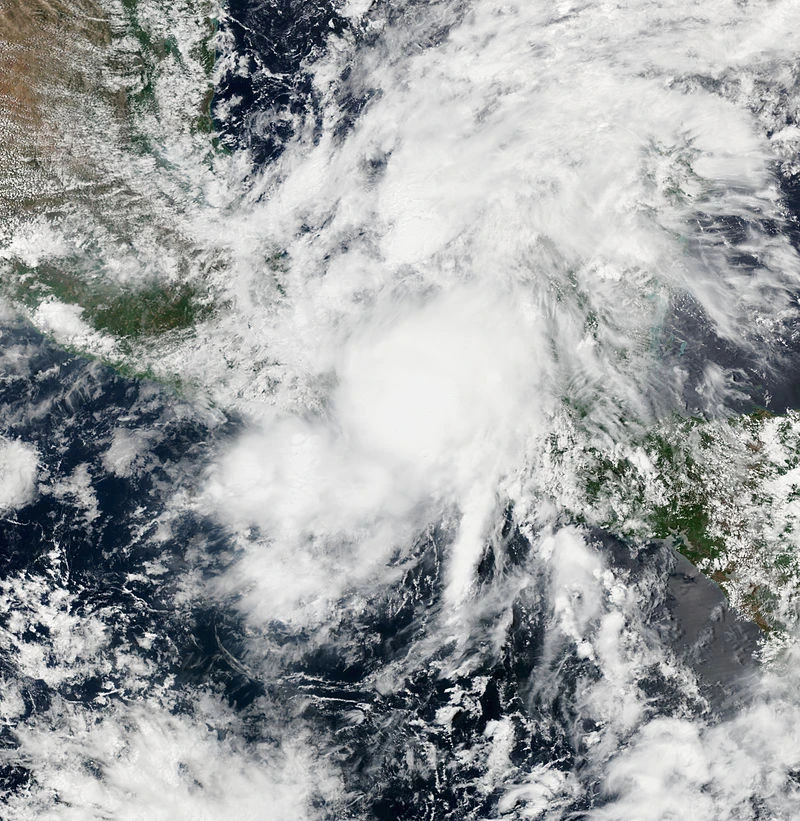
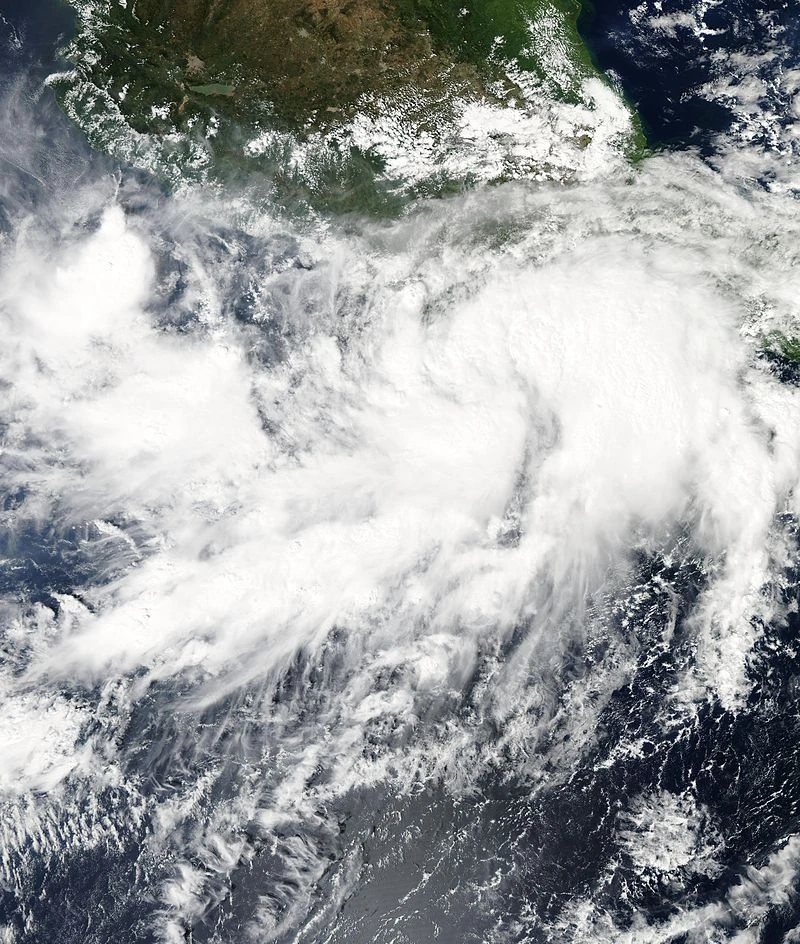
Tropical Storm Cristina[]
| Tropical storm (SSHWS) | |
 | |
| Duration | June 6 – June 9 |
|---|---|
| Peak intensity | 70 mph (110 km/h) (1-min) 992 mbar (hPa) |
Hurricane Douglas[]
| Category 4 hurricane (SSHWS) | |
 | |
| Duration | June 18 – June 29 |
|---|---|
| Peak intensity | 150 mph (240 km/h) (1-min) 922 mbar (hPa) |
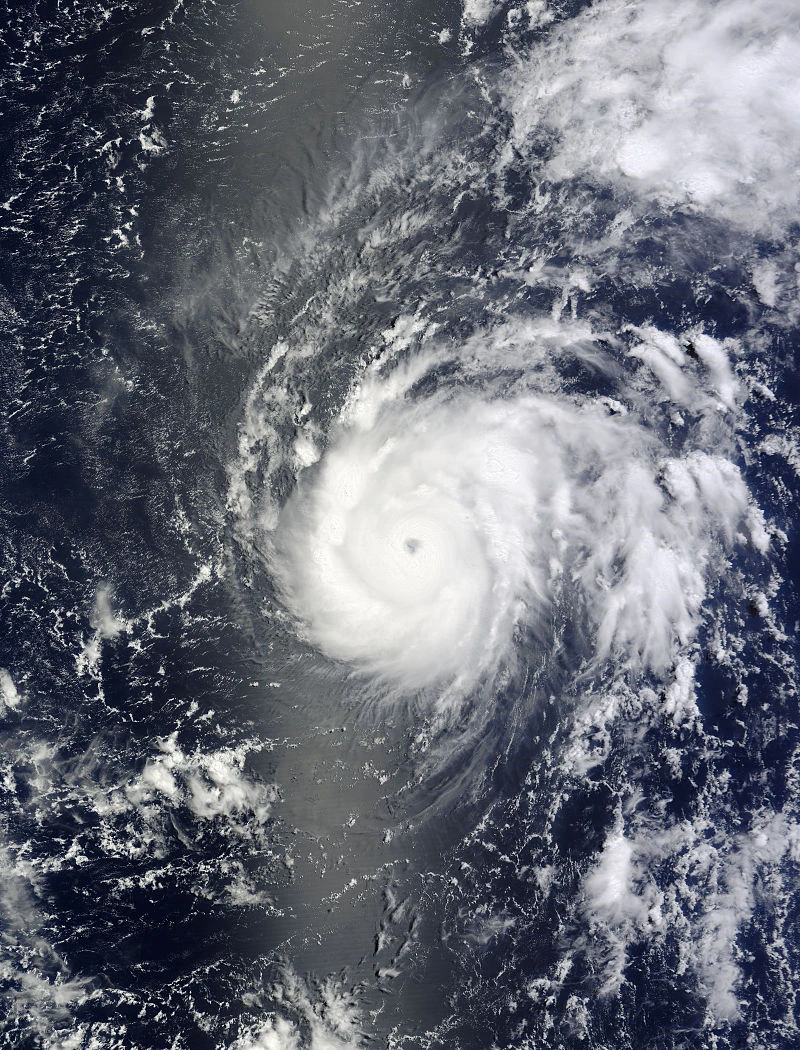
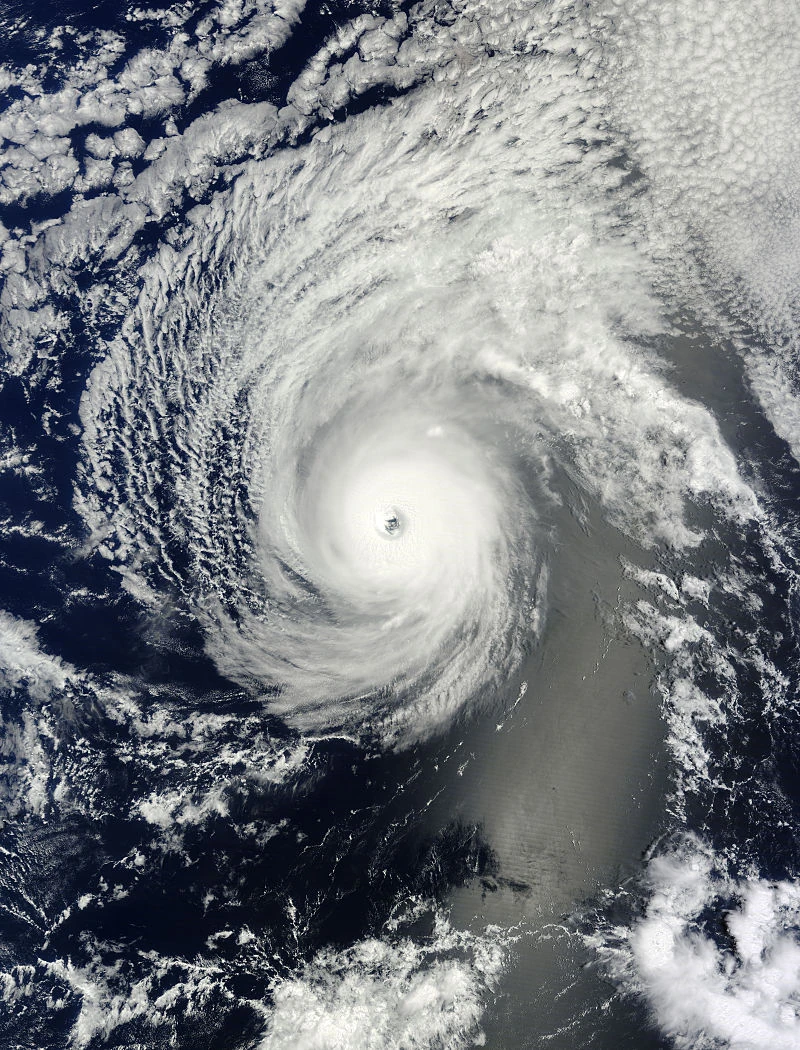
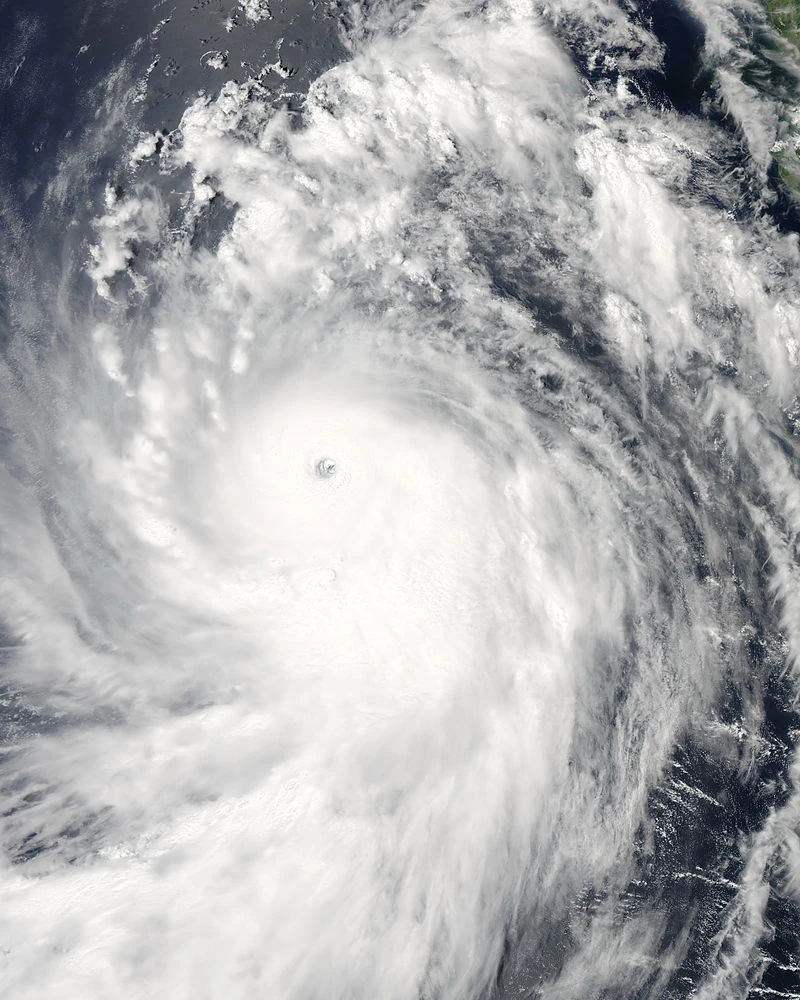
Hurricane Elida[]
| Category 5 hurricane (SSHWS) | |
 | |
| Duration | June 20 – July 4 |
|---|---|
| Peak intensity | 160 mph (260 km/h) (1-min) 899 mbar (hPa) |
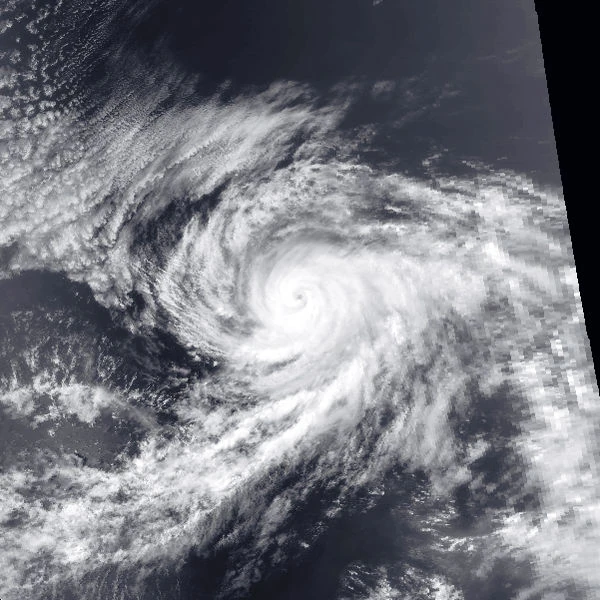
Hurricane Fausto[]
| Category 4 hurricane (SSHWS) | |
 | |
| Duration | June 30 – July 11 |
|---|---|
| Peak intensity | 145 mph (230 km/h) (1-min) 924 mbar (hPa) |
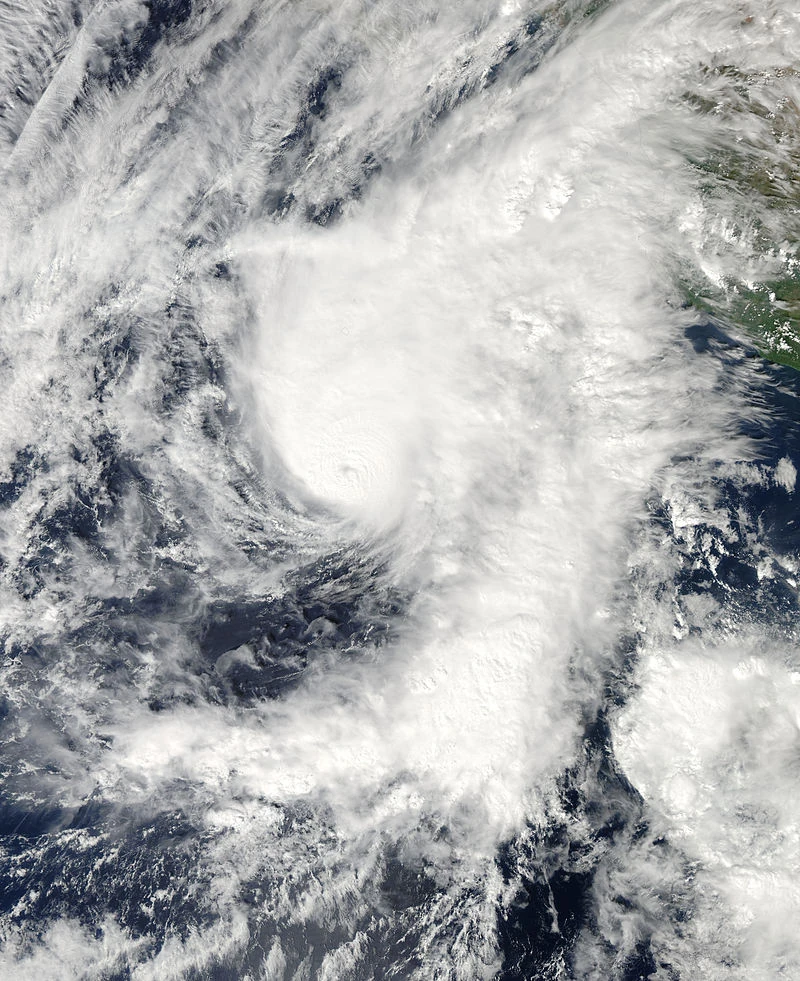
Hurricane Genevieve[]
| Category 3 hurricane (SSHWS) | |
 | |
| Duration | July 4 – July 12 |
|---|---|
| Peak intensity | 125 mph (200 km/h) (1-min) 945 mbar (hPa) |
Hurricane Hernan[]
| Category 1 hurricane (SSHWS) | |
 | |
| Duration | July 8 – July 13 |
|---|---|
| Peak intensity | 80 mph (130 km/h) (1-min) 987 mbar (hPa) |
Hurricane Iselle[]
| Category 3 hurricane (SSHWS) | |
 | |
| Duration | July 17 – July 24 |
|---|---|
| Peak intensity | 120 mph (190 km/h) (1-min) 955 mbar (hPa) |
Hurricane Julio[]
| Category 3 hurricane (SSHWS) | |
 | |
| Duration | July 23 – August 2 |
|---|---|
| Peak intensity | 120 mph (195 km/h) (1-min) 949 mbar (hPa) |
Hurricane Karina[]
| Category 2 hurricane (SSHWS) | |
 | |
| Duration | August 3 – August 11 |
|---|---|
| Peak intensity | 105 mph (165 km/h) (1-min) 967 mbar (hPa) |
Tropical Storm Lowell[]
| Tropical storm (SSHWS) | |
 | |
| Duration | August 5 – August 7 |
|---|---|
| Peak intensity | 65 mph (100 km/h) (1-min) 994 mbar (hPa) |
Hurricane Marie[]
| Category 3 hurricane (SSHWS) | |
 | |
| Duration | August 14 – August 25 |
|---|---|
| Peak intensity | 120 mph (195 km/h) (1-min) 946 mbar (hPa) |
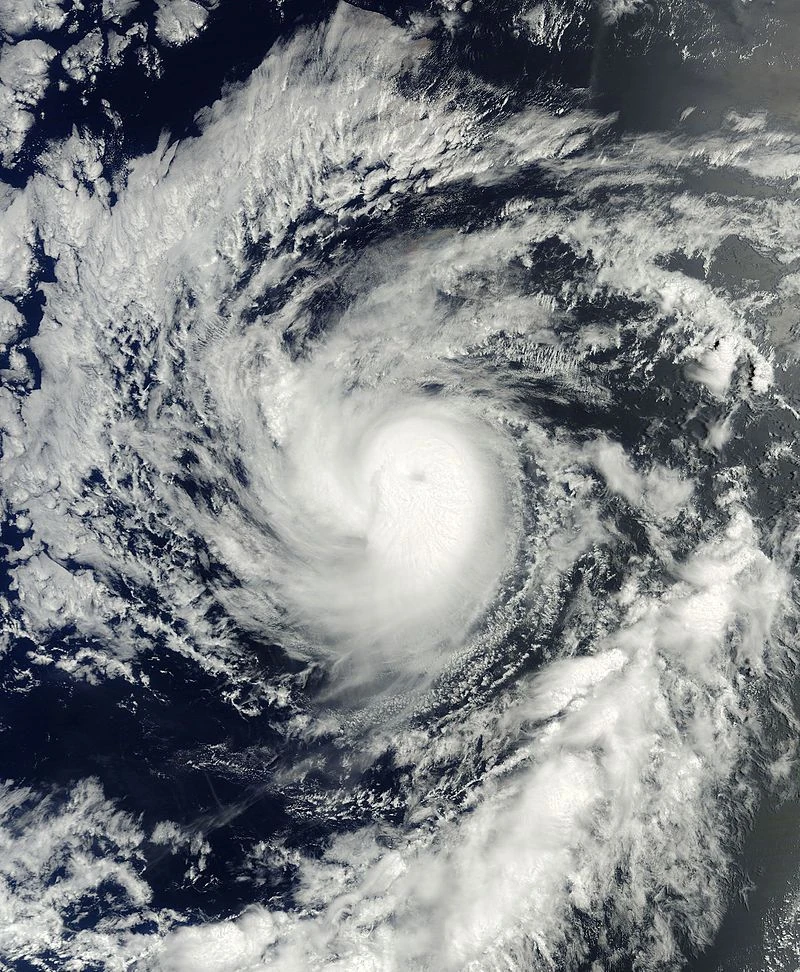
Hurricane Norbert[]
| Category 4 hurricane (SSHWS) | |
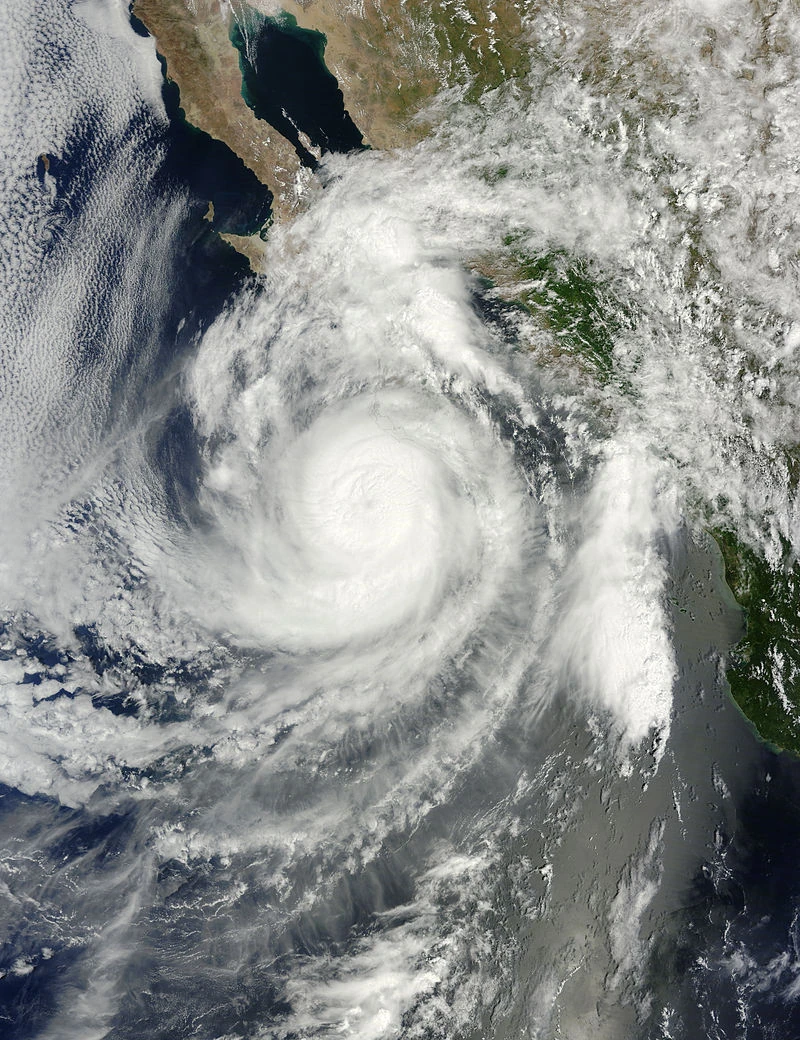 | |
| Duration | August 22 – September 2 (Crossed into the Western Pacific) |
|---|---|
| Peak intensity | 150 mph (240 km/h) (1-min) 918 mbar (hPa) |
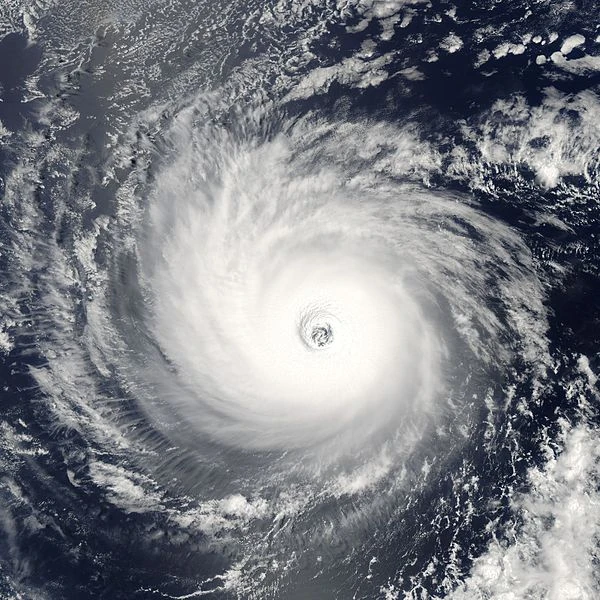
Hurricane Odile[]
| Category 5 hurricane (SSHWS) | |
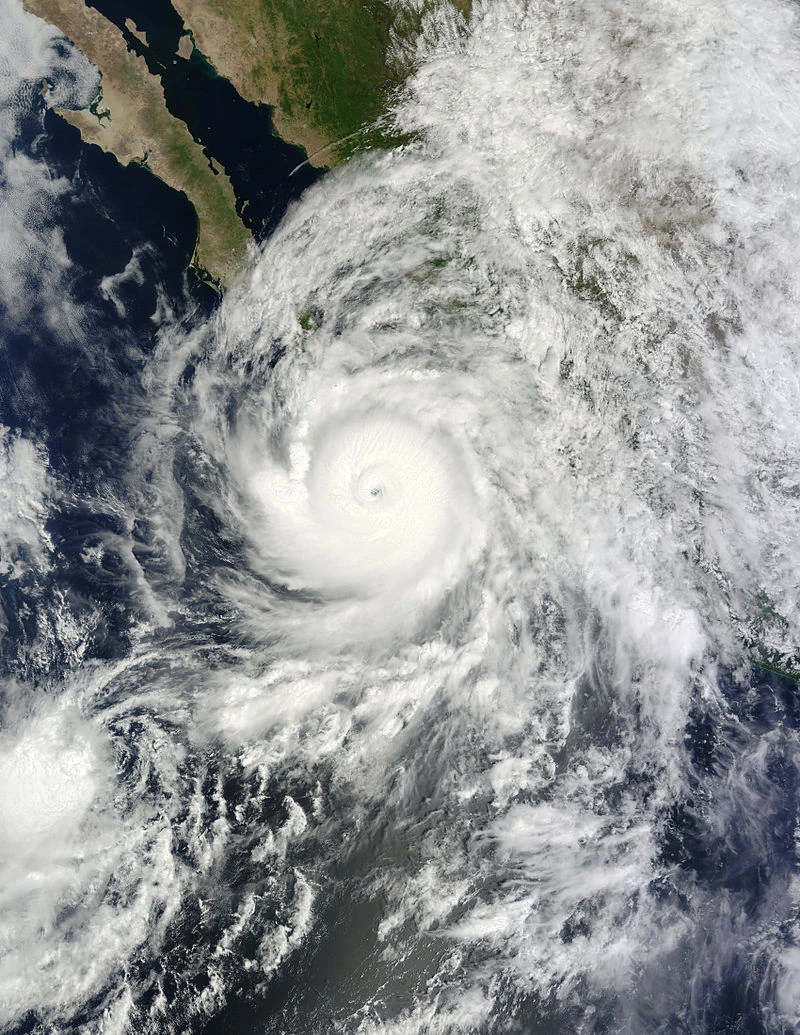 | |
| Duration | August 27 – September 13 |
|---|---|
| Peak intensity | 175 mph (280 km/h) (1-min) 904 mbar (hPa) |
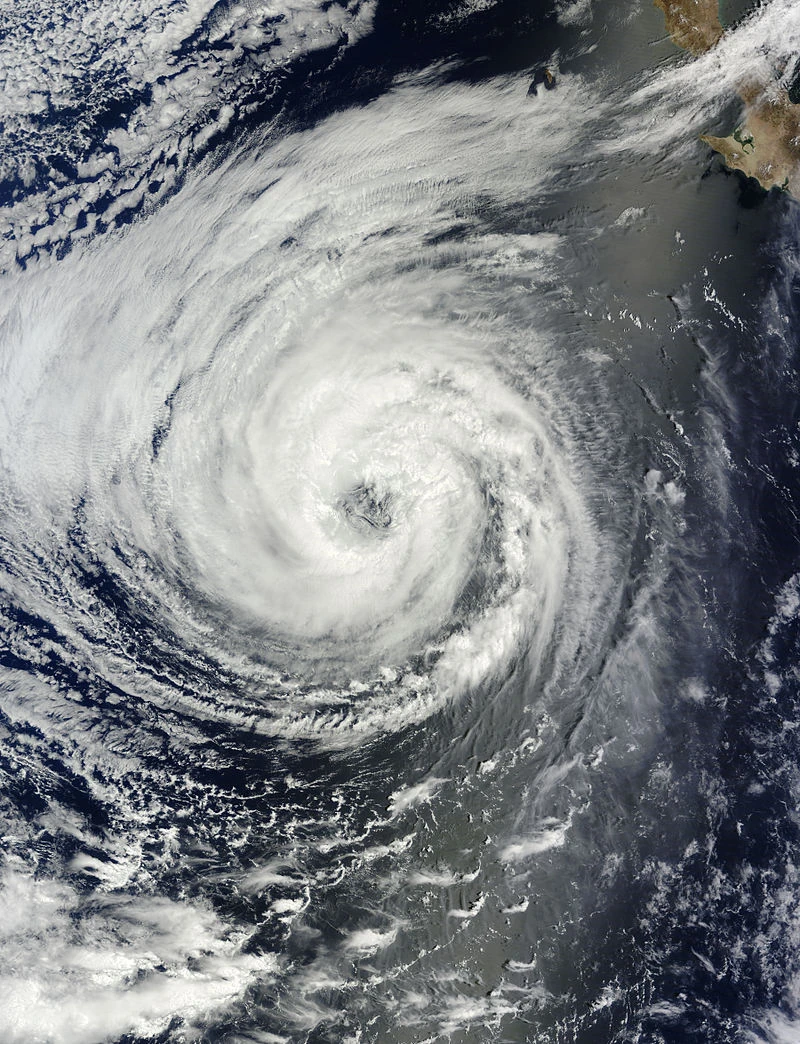
Hurricane Polo[]
| Category 3 hurricane (SSHWS) | |
 | |
| Duration | September 8 – September 24 (Extratropical after September 19) |
|---|---|
| Peak intensity | 120 mph (190 km/h) (1-min) 936 mbar (hPa) |
Hurricane Rachel[]
| Category 1 hurricane (SSHWS) | |
 | |
| Duration | September 16 – September 23 |
|---|---|
| Peak intensity | 80 mph (125 km/h) (1-min) 990 mbar (hPa) |
Hurricane Simon[]
| Category 2 hurricane (SSHWS) | |
 | |
| Duration | September 27 – October 6 |
|---|---|
| Peak intensity | 105 mph (165 km/h) (1-min) 954 mbar (hPa) |
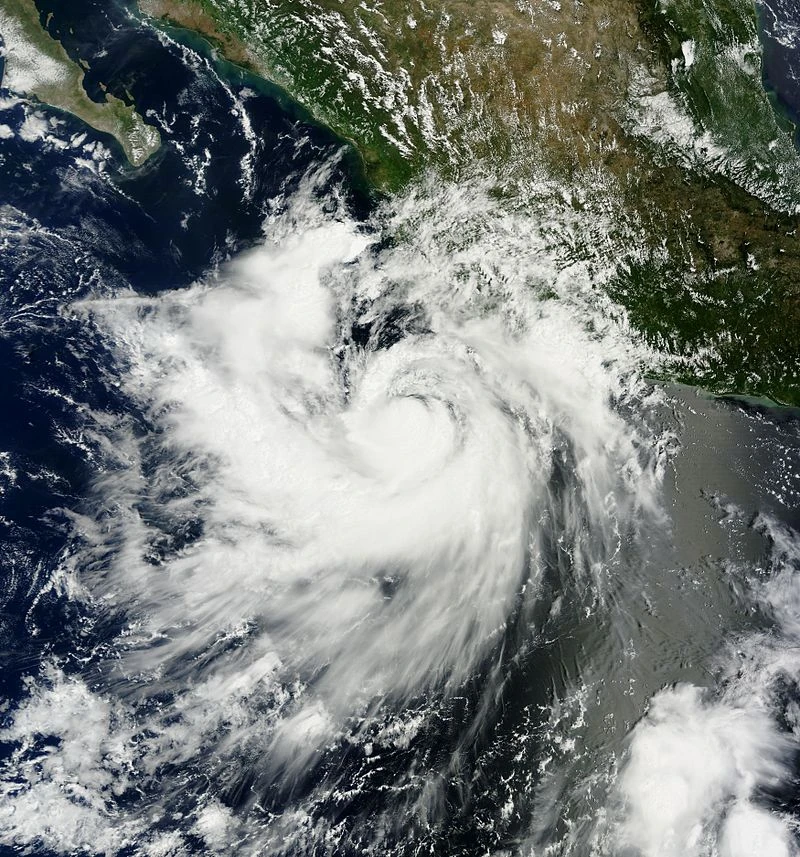
Tropical Storm Trudy[]
| Tropical storm (SSHWS) | |
 | |
| Duration | October 12 – October 14 |
|---|---|
| Peak intensity | 50 mph (85 km/h) (1-min) 998 mbar (hPa) |
Hurricane Vance[]
| Category 2 hurricane (SSHWS) | |
 | |
| Duration | October 16 – November 2 |
|---|---|
| Peak intensity | 105 mph (170 km/h) (1-min) 975 mbar (hPa) |
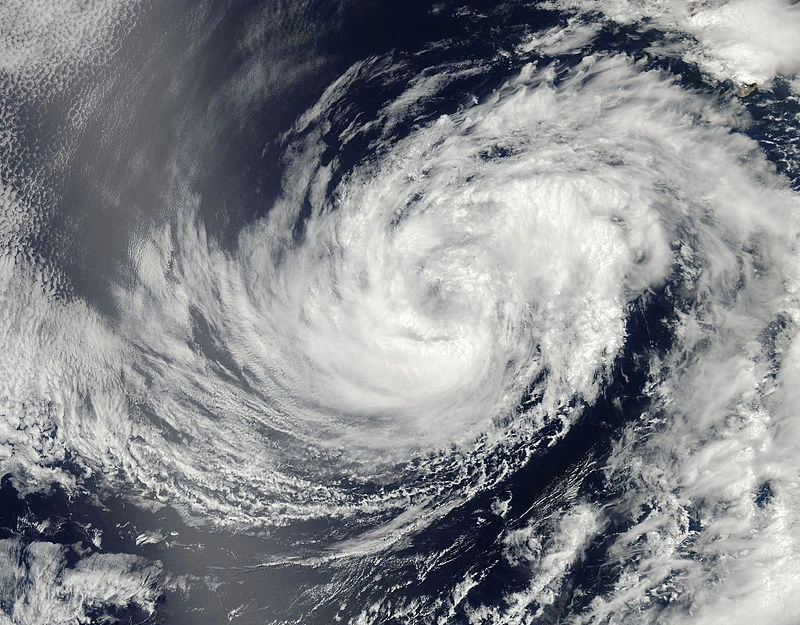
Hurricane Winnie[]
| Category 2 hurricane (SSHWS) | |
 | |
| Duration | November 6 – November 18 |
|---|---|
| Peak intensity | 110 mph (175 km/h) (1-min) 963 mbar (hPa) |
Season effects[]
This is a table of the storms and their effects in the 2014 Pacific hurricane season. This table includes the storm's names, duration, peak intensity, landfalls, damages, and death totals. Deaths in parentheses are additional and indirect (an example of an indirect death would be a traffic accident), but are still storm-related. Damage and deaths include totals while the storm was extratropical, a wave or a low. All of the damage figures are in 2014 USD.
| Storm name |
Dates active | Storm category at peak intensity | Max wind (mph) |
Min. press. (mbar) |
Landfall(s) | Damage (millions USD) |
Deaths | |||
|---|---|---|---|---|---|---|---|---|---|---|
| Where | When | Wind
(mph) | ||||||||
| Amanda | May 17 - May 22 |
Category 1 hurricane | 85 | 987 | None | 0 | 0 | |||
| Boris | May 24 - May 29 |
Category 1 hurricane | 90 | 981 | None | 0 | 0 (300) | |||
| Cristina | June 6 - June 9 |
Tropical storm | 70 | 992 | None | 0 | 0 | |||
| Douglas | June 18 - June 29 |
Category 4 hurricane | 150 | 922 | None | 0 | 0 | |||
| Elida | June 20 - July 4 |
Category 5 hurricane | 160 | 899 | None | 0 | 0 | |||
| Fausto | June 30 - July 11 |
Category 4 hurricane | 145 | 924 | None | 0 | 0 | |||
| Genevieve | July 4 - July 12 |
Category 3 hurricane | 125 | 945 | None | 0 | 0 | |||
| Hernan | July 8 - July 13 |
Category 1 hurricane | 80 | 987 | None | 0 | 0 | |||
| Iselle | July 17 - July 24 |
Category 3 hurricane | 120 | 955 | None | 0 | 0 | |||
| Julio | July 23 - August 2 |
Category 3 hurricane | 120 | 949 | None | 0 | 0 | |||
| Karina | August 3 - August 11 |
Category 2 hurricane | 105 | 967 | None | 0 | 0 | |||
| Lowell | August 5 - August 7 |
Tropical storm | 65 | 994 | None | 0 | 0 | |||
| Marie | August 14 - August 25 |
Category 3 hurricane | 120 | 946 | None | 0 | 0 | |||
| Norbert | August 22 - September 2 |
Category 4 hurricane | 150 | 918 | None | 0 | 0 | |||
| Odile | August 27 - September 13 |
Category 5 hurricane | 175 | 904 | None | 0 | 0 | |||
| Polo | September 8 - September 19 |
Category 3 hurricane | 120 | 936 | None | 0 | 0 | |||
| Rachel | September 16 - September 23 |
Category 1 hurricane | 80 | 990 | None | 0 | 0 | |||
| Simon | September 27 - October 6 |
Category 2 hurricane | 105 | 954 | None | 0 | 0 | |||
| Trudy | October 12 - October 14 |
Tropical storm | 50 | 998 | None | 0 | 0 | |||
| Vance | October 16 - November 2 |
Category 2 hurricane | 105 | 975 | None | 0 | 0 | |||
| Winnie | November 6 - November 18 |
Category 2 hurricane | 110 | 963 | None | 0 | 0 | |||
| Season Aggregates | ||||||||||
| 21 cyclones |
May 17 - November 18 |
175 | 899 | No landfalls | 0 | 0 (300) | ||||
Storm names[]
- See also: List of retired Pacific hurricane names
Within the Northeastern Pacific Ocean, if a storm reaches tropical or subtropical storm intensity, it is assigned a name from one of six lists used by the National Hurricane Center. This particular naming list was the same one used in the 2008 season, except for Amanda, which replaced Alma, and was used to name a storm for the first time in 2014. Names that were allocated for the season but not used are marked in gray.
|
|
|
Central Pacific[]
In the Central Pacific Ocean, if a storm reaches tropical or subtropical storm intensity, it is given a name from a series of four rotating lists used there. Due to the lack of any storms forming in the basin during 2014, no names were required.
Retirement[]
Due to the lack of any destructive storms, no names were retired. Therefore, this same naming list will be reused in the 2020 season.