I'm allowing anyone to publish in this as long as they are expanding on what I did previously.
"This is the beginning of a new revolution." - Philip J. Klotzbach, Colorado State University
Watch the animation of this season here: https://www.youtube.com/watch?v=3maMADsjLwA
The 2023 Atlantic hurricane season was the most destructive and active season on record. In the year of 2023, the season produced 30 named (sub)tropical storms, 20 hurricanes and 8 major hurricanes, mainly from the cause of a late forming La Niña just 2 months prior to the start of the season. It broke several records, including most active season (in terms of accumulated cylone energy), most hurricanes, major hurricanes and named storms in a single season, and abnormal formations. As usual, an Atlantic hurricane season offically begins on June 1 and continues till November 30. However, this season began on May 2, 2023, producing an unnamed subtropical storm, (identifed as a storm during re-analysis in 2024), and ending late on December 19, 2023 with the dissipation of Subtropcial Storm Theta. The season battled through with a record-breaking 8 major hurricanes, 4 of which peaking at Category 5 hurricanes on the Saffir-Simpson Hurricane Scale Out of the four, Hurricane Iron was the largest, strongest, and longest lived hurricane of the year, that topped off the charts at 200 mph (325 km/h), 867 mbar (hPa), and lived for 21.5 days.
Out of any season since records began in 1851, the 2023 Atlantic hurricane season is by far the most significant. The National Hurricane Center had stated that the amount of activity in the season had a striking occurrence from the result of a large shift of climate change. As a result of a low hurricane season the year before, the season had called for large ranges of storms and hurricanes, calculating 17-23 named storms, 8-13 hurricanes, and 2-6 major hurricanes in the pre- season outlooks. However, after the dissipation of Hurricane Deena, climatologists began monitoring a large shift in warmer sea surface temperatures and lesser wind shear. Furthermore, a strong, late forming La Niña took over its complete form in mid-August, (began its formation in March), meaning that the effects of La Niña were going to be intense and considerable.
Despite the large number of storms making landfall to the United States, no hurricanes made landfall as a major hurricane.
Seasonal forecasts[]
| Source | Date | Named storms |
Hurricanes | Major hurricanes |
|
| Average (1981–2010) | 12.1 | 6.4 | 2.7 | ||
| Record high activity | 30 | 20 | 8 | ||
| Record low activity | 4 | 2 | 0† | ||
| ––––––––––––––––––––––––––––––––––––––––––––––––––––––– | |||||
| TSR | December 7, 2022 | 17 | 9 | 4 | |
| WSI | December 22, 2022 | 17 | 9 | 5 | |
| CSU | January 10, 2023 | 19 | 10 | 5 | |
| NCSU | April 12, 2023 | 18-24 | 8-13 | 2-6 | |
| UKMO | May 15, 2023 | 18* | 8* | N/A | |
| NOAA | May 24, 2023 | 18-22 | 9-12 | 4-6 | |
| FSU COAPS | May 30, 2023 | 18-21 | 6-10 | N/A | |
| CSU | June 3, 2023 | 19 | 10 | 5 | |
| TSR | June 7, 2023 | 18 | 9 | 4 | |
| WSI | July 10, 2023 | 18 | 11 | 5 | |
| CSU | August 4, 2023 | 19 | 12 | 4 | |
| NOAA | August 12, 2023 | 19-25 | 10-14 | 4-6 | |
| CSU | August 21, 2023 | 23 | 15 | 6 | |
| NOAA | August 28, 2023 | 27 | 18 | 10 | |
| ––––––––––––––––––––––––––––––––––––––––––––––––––––––– | |||||
| Actual activity |
30 | 20 | 8 | ||
| † Most recent of several such occurrences. (See all)
* June–November only | |||||
In advance of, and during, each hurricane season, several forecasts of hurricane activity are issued by national meteorological services, scientific agencies, and noted hurricane experts. These include forecasters from the United States National Oceanic and Atmospheric Administration (NOAA)'s National Hurricane and Climate Prediction Center's, Philip J. Klotzbach, William M. Gray and their associates at Colorado State University (CSU), Tropical Storm Risk, and the United Kingdom's Met Office. The forecasts include weekly and monthly changes in significant factors that help determine the number of tropical storms, hurricanes, and major hurricanes within a particular year. As stated by NOAA and CSU, an average Atlantic hurricane season between 1981 and 2010 contains roughly 12 tropical storms, six hurricanes, three major hurricanes, and an Accumulated Cyclone Energy (ACE) Index of 66-103 units. NOAA typically categorizes a season as either above-average, average, of below-average based on the cumulative ACE Index; however, the number of tropical storms, hurricanes, and major hurricanes within a hurricane season is considered occasionally as well.
Pre- season forecasts[]
On December 7, 2022, Tropical Storm Risk (TSR), a public consortium consisting of experts on insurance, risk management, and seasonal climate forecasting at University College London, issued an extended-ranged forecast of a hyperactive (above-average) hurricane season.
Mid- season forecasts[]
Season summary[]


Six of the eight major hurricanes. Top shows Hurricanes Jemima, Owen, and Deena. Side shows Hurricanes Sonya and Chester. Large photo shows Hurricane Iron.
Storms[]
|
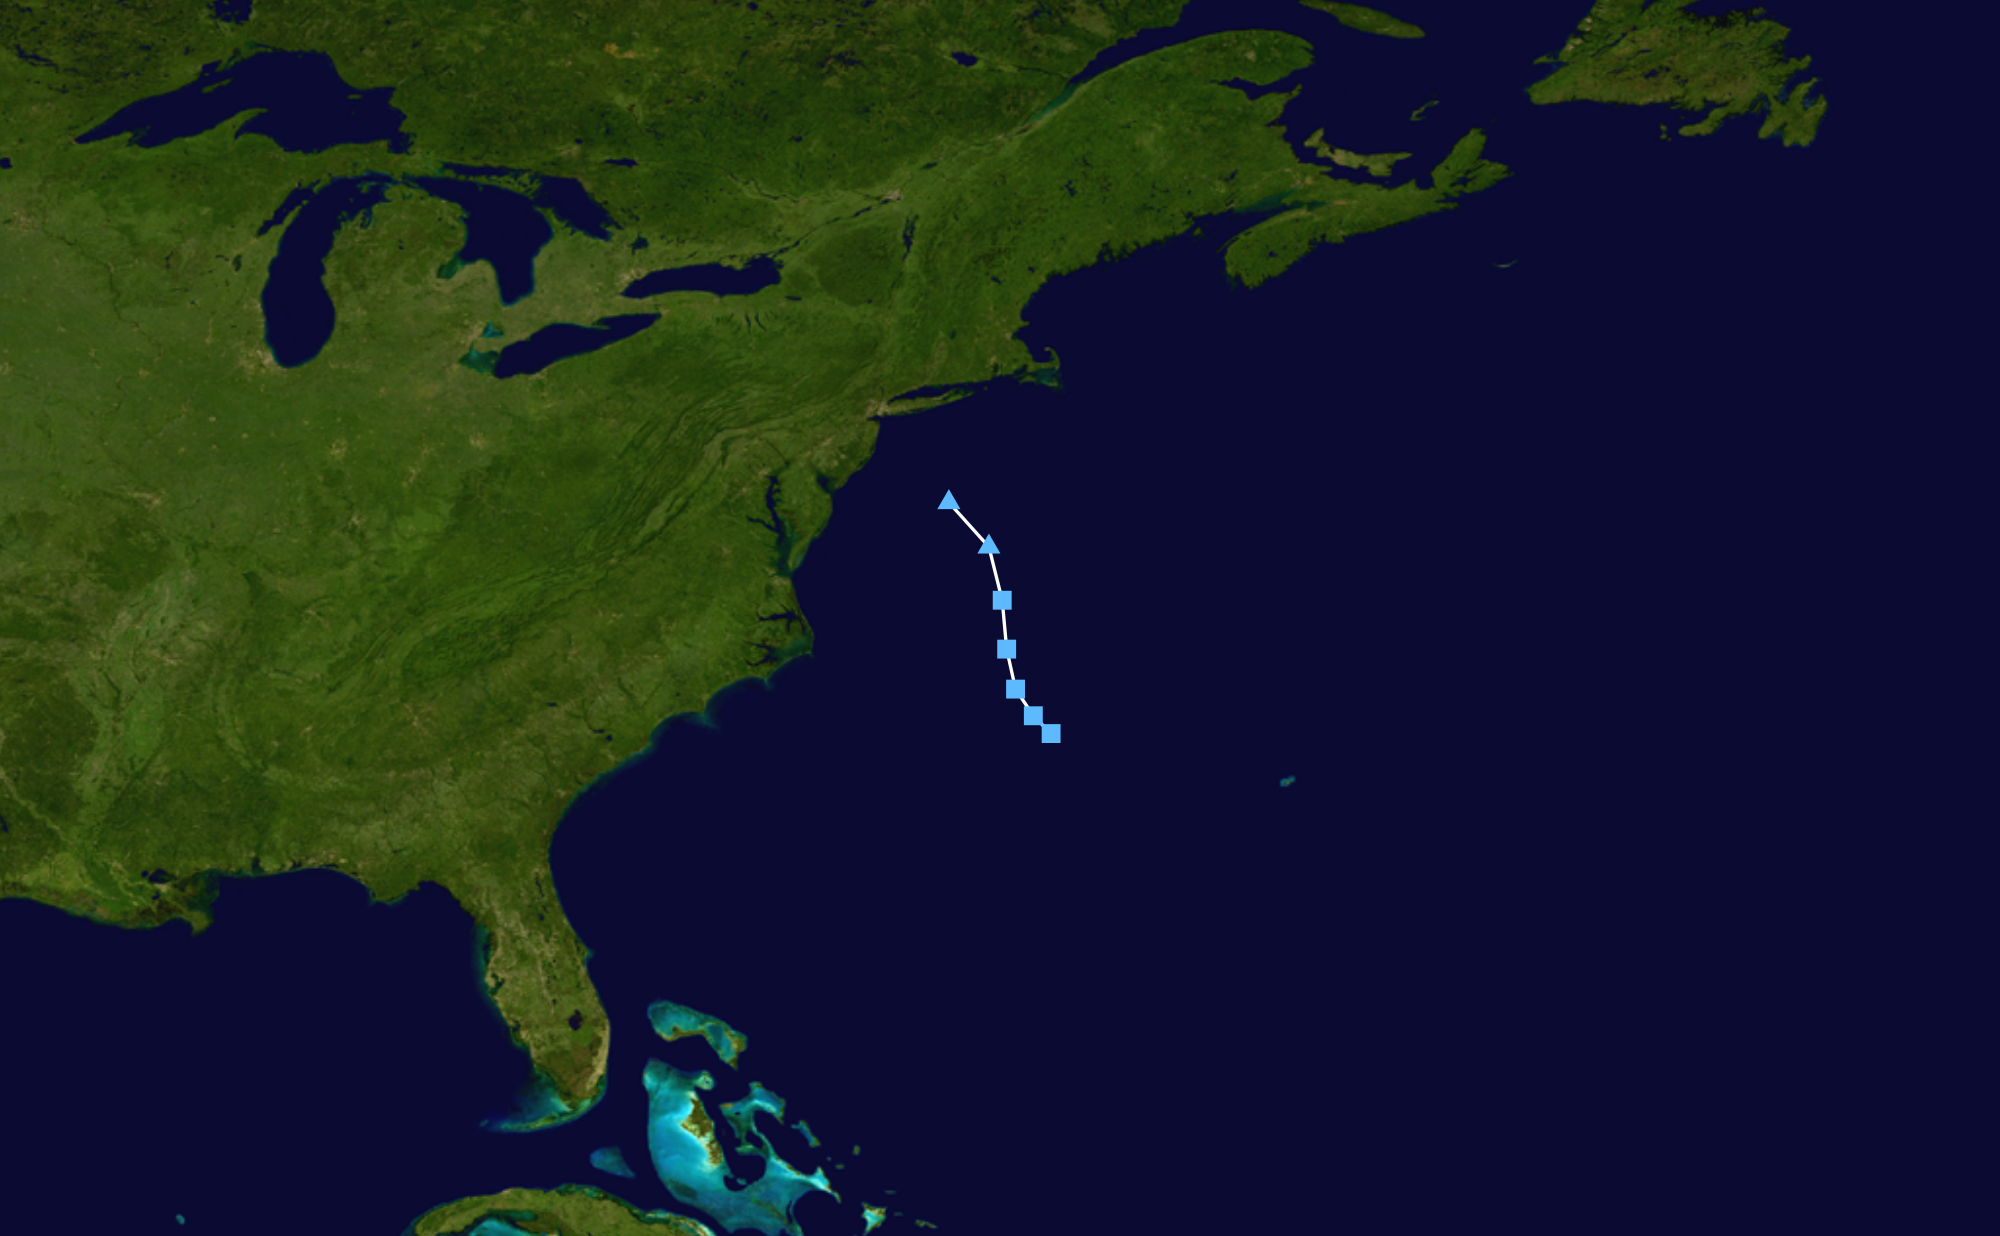
2023 Atlantic Canada subtropical storm[]
| Subtropical storm (SSHWS) | |
  | |
| Duration | May 2 – May 5 |
|---|---|
| Peak intensity | 60 mph (95 km/h) (1-min) 994 mbar (hPa) |
On May 2, the NHC (National Hurricane Center) put out a special weather outlook regarding a low pressure area near Atlantic Canada. They noted the thunderstorms and well defined center, but promised the chances of the system transitioning into tropical or subtropical as near 10 percent. Nova Scotia was placed under warnings however due to the threat the system posed towards it and the system made landfall on May 5. It dissipated soon after as a high pressure system and land interaction tore it apart.
On May 10, following post-season analysis, the NHC determined the storm had been subtropical and was the first season of the storm.
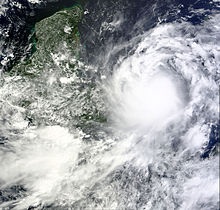
Hurricane Alec[]
| Category 1 hurricane (SSHWS) | |
  | |
| Duration | July 17 – July 21 |
|---|---|
| Peak intensity | 80 mph (130 km/h) (1-min) 987 mbar (hPa) |
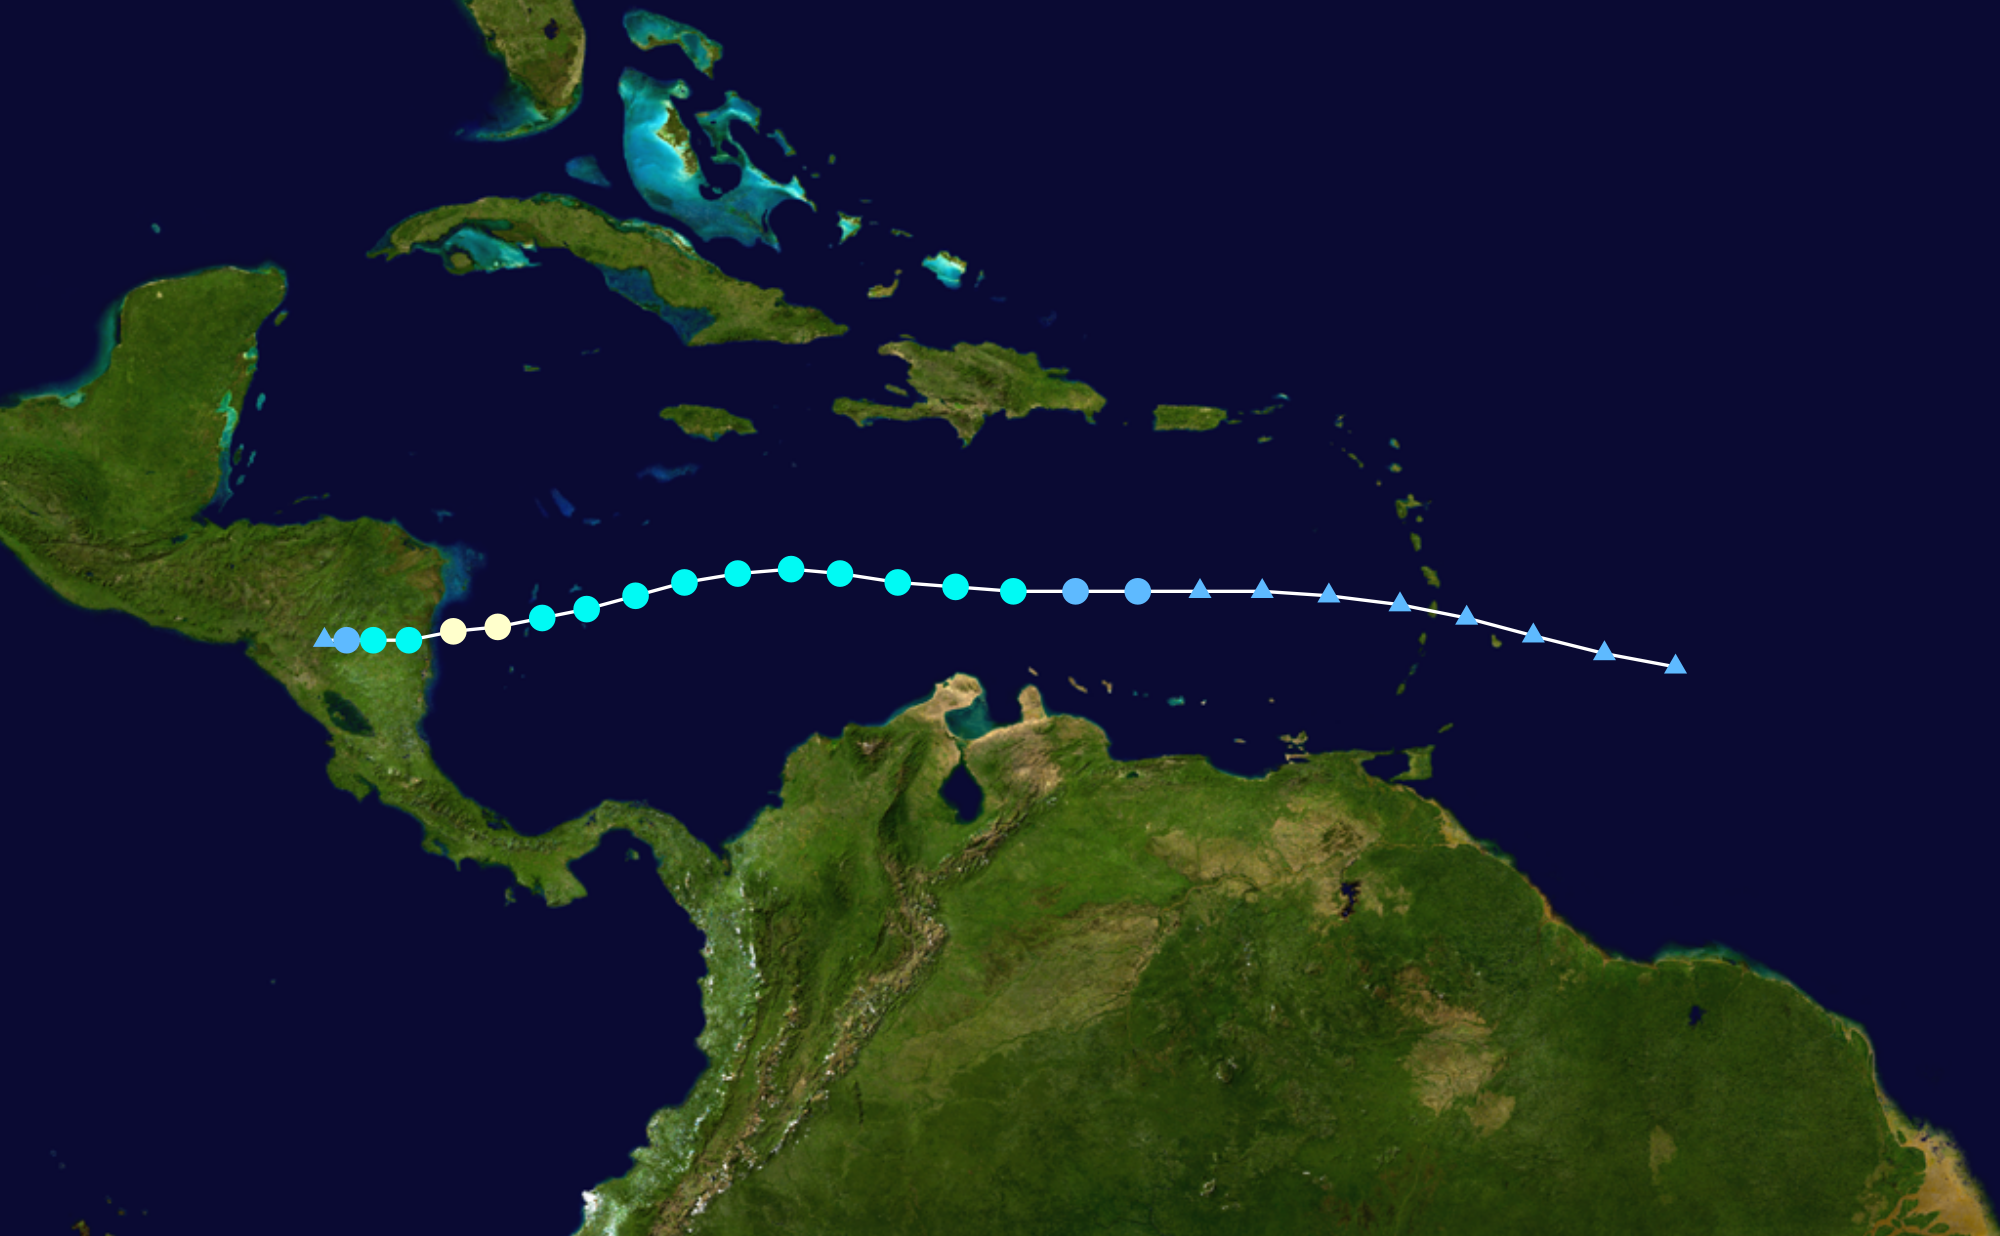
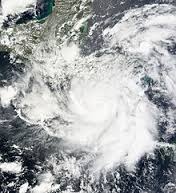
A tropical wave moved off the western coast of Africa on July 8 and began heading west. On July 15, NHC began monitoring the system, stating that convection and environmental conditions are continuing to make the wave favorable for additional development. On July 17 at 0000 UTC, the system formed into Tropical Depression One. Many hours later, dry air and wind shear from the Saharan Air Layer decreased, upgrading the system to Tropical Storm Alec. Alec moved steadily westward as a result of a diminshing low pressure system somewhat ahead of Alec. Alec absorbed most of the low pressure system and had gained further strength. On July 20 at 00:00 UTC, dry air had decreased, allowing Alec to strengthen into a hurricane. However, later on July 20, a hurricane aircraft reported that the cyclone's closed cirrculation had subsided from coming close to land. Thus, Alec had weakened into a tropical storm after making landfall to Nicaragua. Subsequent from the torrential rainfalls and flash flooding that the system produced on land, Alec's cirrculation neared dissipation. On July 21, Alec became post tropical and dissipated in Central America.
During Alec's existence, more than 120,000 people were evacuated from their homes, which were later destroyed from strong currents. Mudslides destroyed an additional 20,000 homes. 7 people were killed from the flash flooding in Puerto Cabazas and $1.5 million 2023 USD was reported in damages.
Tropical Storm Bessie[]
On July 16, the NHC noted the chances for a low pressure system to form. Soon enough, the system spawned. The system responded quickly to warm waters and strengthened to a Subtropical depression. It later became fully tropical and low wind shear allowed it to strengthen into a Tropical storm.
| Tropical storm (SSHWS) | |
  | |
| Duration | July 19 – July 21 |
|---|---|
| Peak intensity | 40 mph (65 km/h) (1-min) 1005 mbar (hPa) |
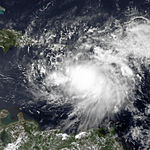
Hurricane Chester[]
| Category 5 hurricane (SSHWS) | |
  | |
| Duration | July 31 – August 11 |
|---|---|
| Peak intensity | 160 mph (260 km/h) (1-min) 913 mbar (hPa) |
Hurricane Deena[]
| Category 4 hurricane (SSHWS) | |
  | |
| Duration | August 2 – August 10 |
|---|---|
| Peak intensity | 150 mph (240 km/h) (1-min) 937 mbar (hPa) |
Tropical Storm Edie[]
- Main article: Tropical Storm Edie (2023)
| Tropical storm (SSHWS) | |
  | |
| Duration | August 14 – August 17 |
|---|---|
| Peak intensity | 60 mph (95 km/h) (1-min) 997 mbar (hPa) |
Tropical Storm Fredine[]
| Tropical storm (SSHWS) | |
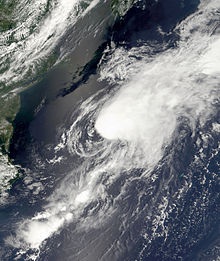  | |
| Duration | August 15 – August 19 |
|---|---|
| Peak intensity | 60 mph (95 km/h) (1-min) 1000 mbar (hPa) |
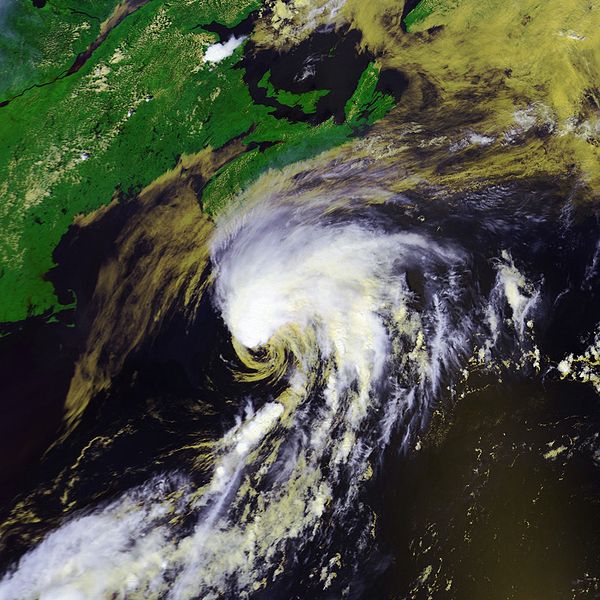
On late August 14, a non-tropical area of low pressure formed near Myrtle Beach, South Carolina. In the hours continued, the low began showing signs of organization and a closed circulation was being monitored. On August 15 at 1800 UTC, the NHC issued the first advisories for Tropical Depression Six. The system moved steadily northeastward, entering a warmer environment. Surface temperatures of the Gulf Stream Current made the system upgrade to Tropical Storm Fredine. On August 16 at 0600 UTC, NHC issued its archive advisory, stating that the system would turn northward and making landfall to Long Island, New York. However the system experienced a change in windspeed, and a fast moving frontal low interacted with Fredine. At that time Fredine was stronger. It then absorbed the frontal low gaining additional windspeed. Thus a change in direction. On August 17, Fredine entered cooler waters losing strength. The system then turned extratropical later that night. The system would continue moving east at a fast pace soon afftecing Ireland before dissipation. During Fredine's time of existence, no fatalities or damages were reported.
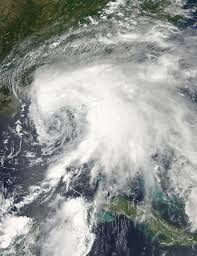
Hurricane Grant[]
| Category 2 hurricane (SSHWS) | |
  | |
| Duration | August 23 – August 30 |
|---|---|
| Peak intensity | 100 mph (155 km/h) (1-min) 962 mbar (hPa) |
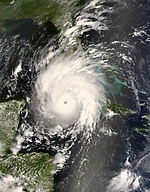
A tropical wave off the Cape Verde Islands began its slow formation on late August 20. Later during the week, NHC began issuing advisories for a small tropical depression 1000 miles east of the Lesser Antilles. The disturbance was upgraded to Tropical Storm Grant on August 24. The system began gathering more steam and strength, however the storm had started to experience disorganization, and the tropical storm had split into two separate storms. This resulting in Grant to downgrade to a depression. However, wind shear had decreased and Grant intensified back into a tropical storm one and half days later. The amount of wind shear was brought down through Grant's path and the storm intensified into a Category 1 hurricane for 8 hours. Grant would eventually become a Category 2 hurricane and make landfall to Turks and Caicos. Dramatic storm surge and strong winds were brought to areas surrounding Grant's path. However, in the early hours of August 29, Hurricane Grant had made landfall to Florida as a Category 1 hurricane. The storm would continue to move inland as a tropical storm and bring localized flooding to the southwestern states, Georgia and South Carolina in particular. Grant would loose strength and upper level winds brought the system to a depression over Kentucky. The system became post-tropical and totally dissipated in the Gulf of St. Lawrence.
Tropical Storm Hana[]
| Tropical storm (SSHWS) | |
  | |
| Duration | August 24 – August 28 |
|---|---|
| Peak intensity | 65 mph (100 km/h) (1-min) 995 mbar (hPa) |
Surface low pressure from splitting Tropical Stom Grant
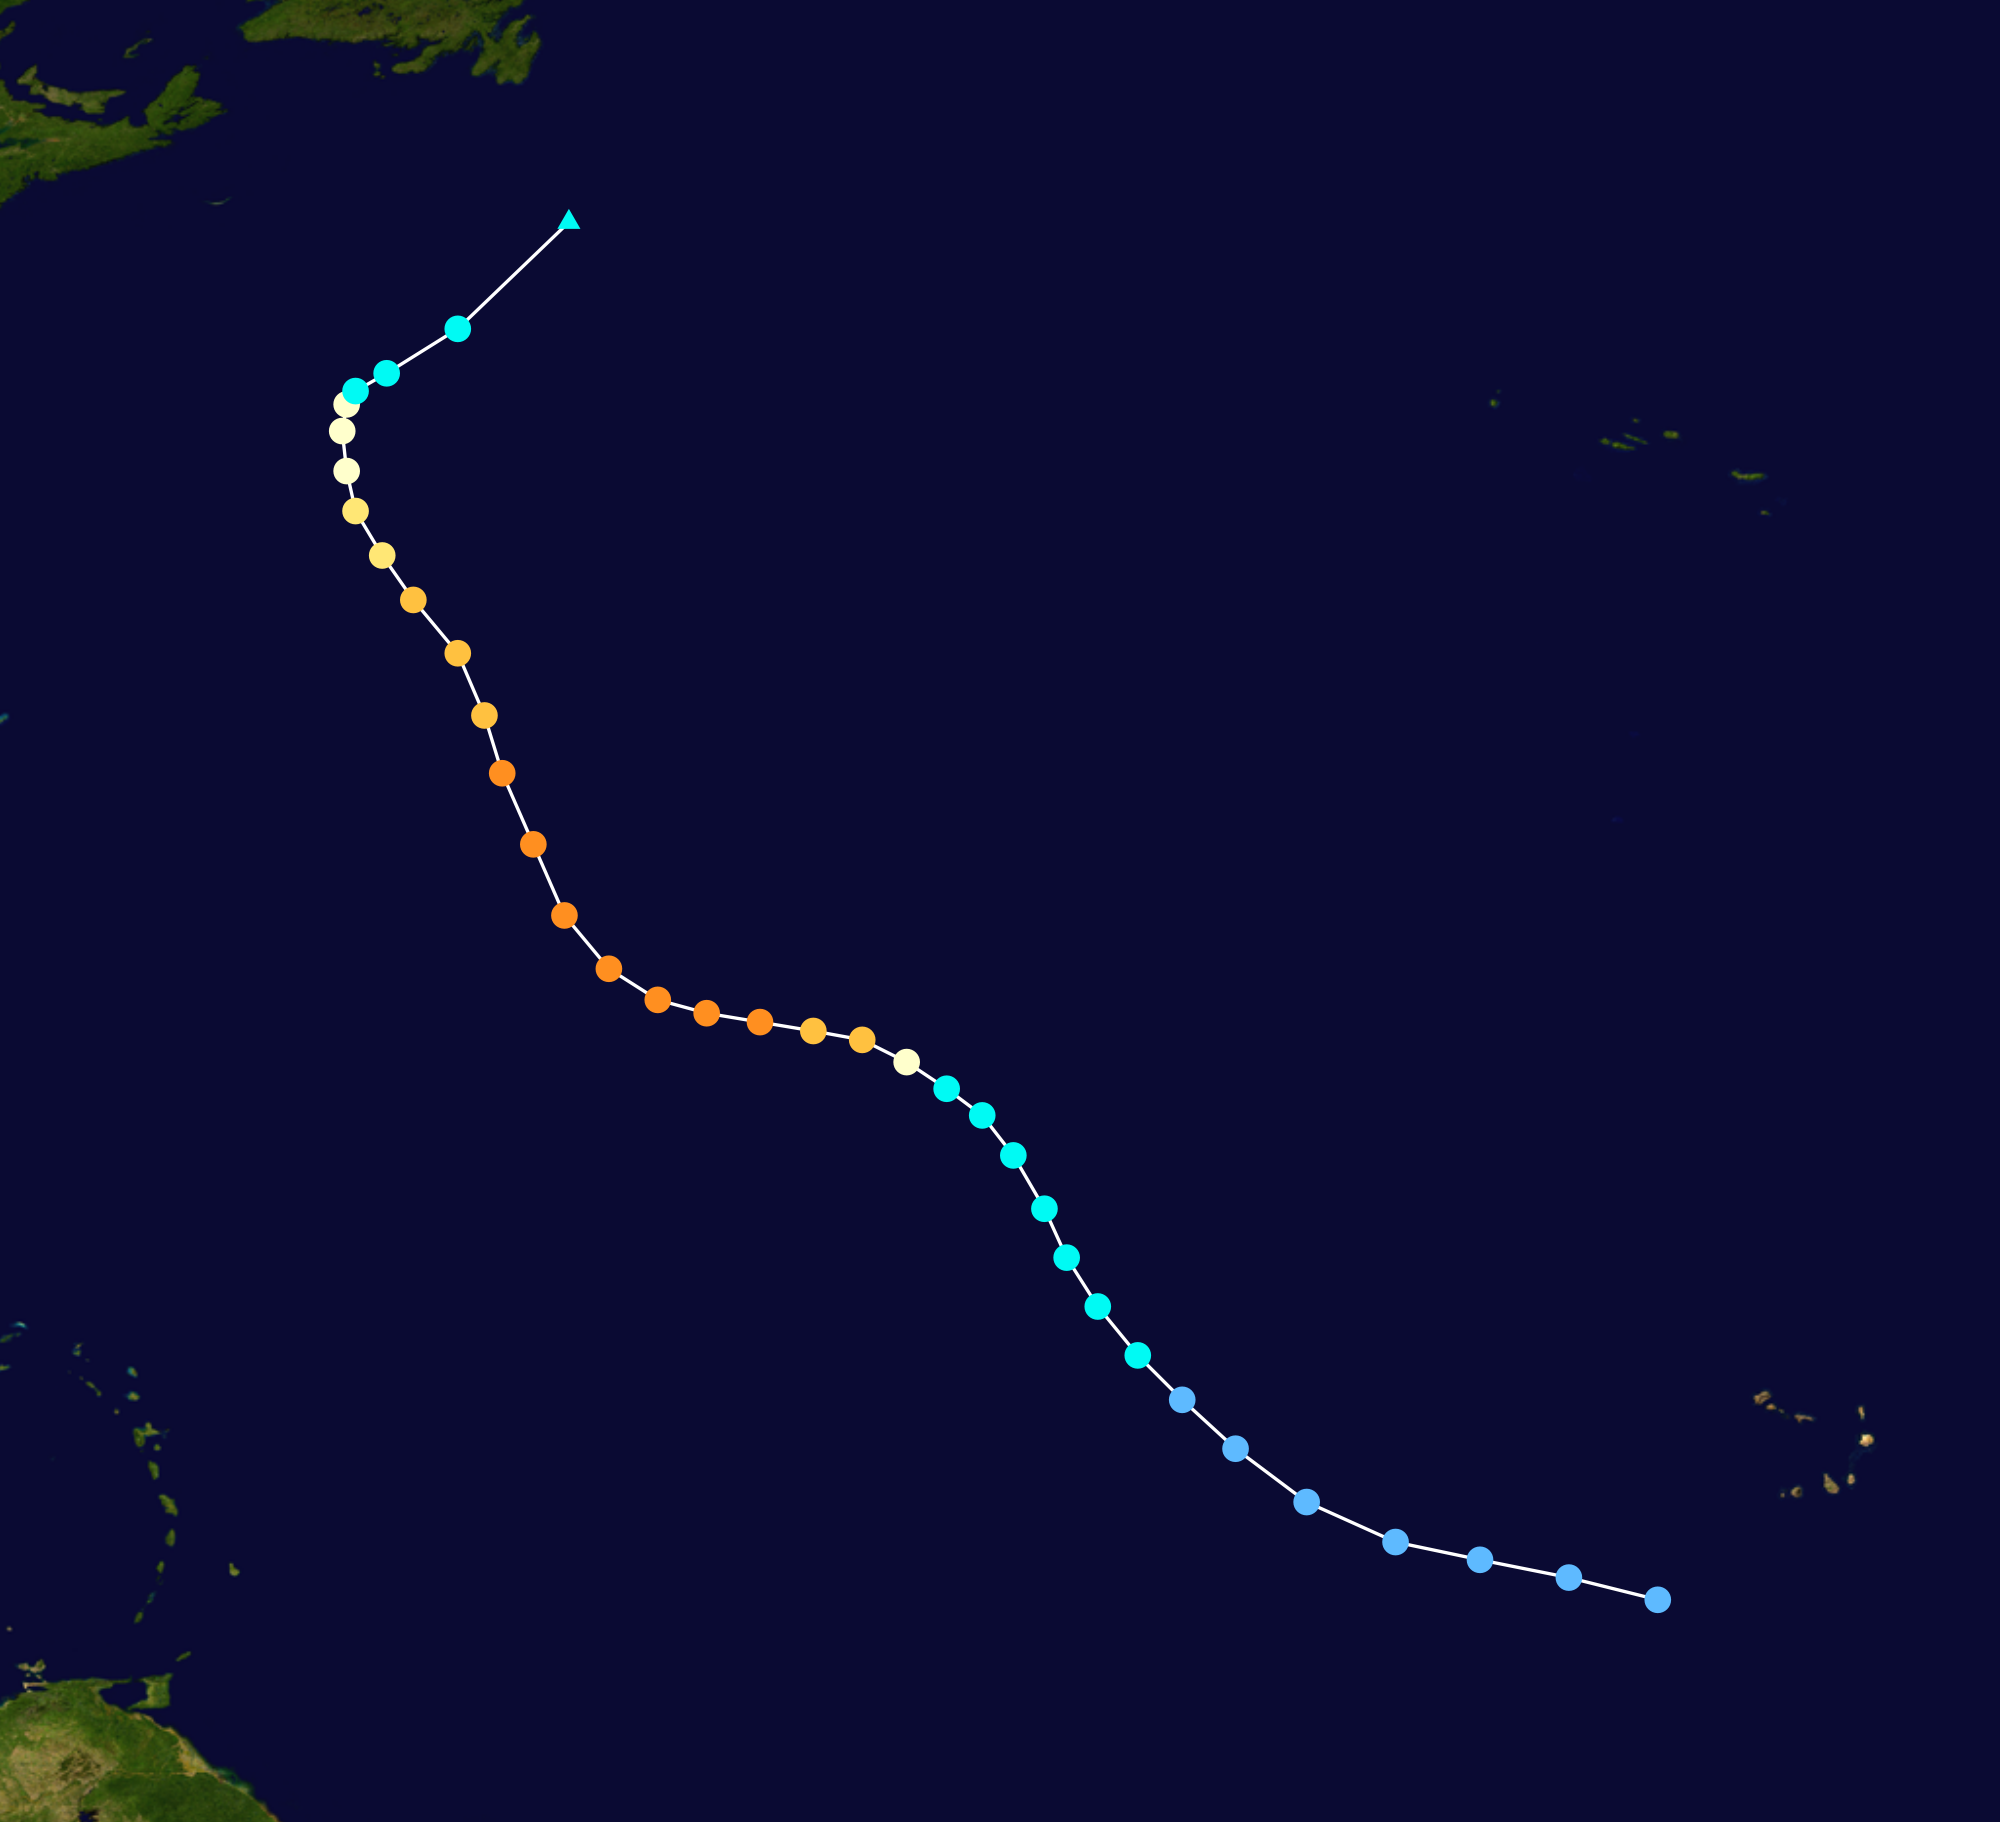
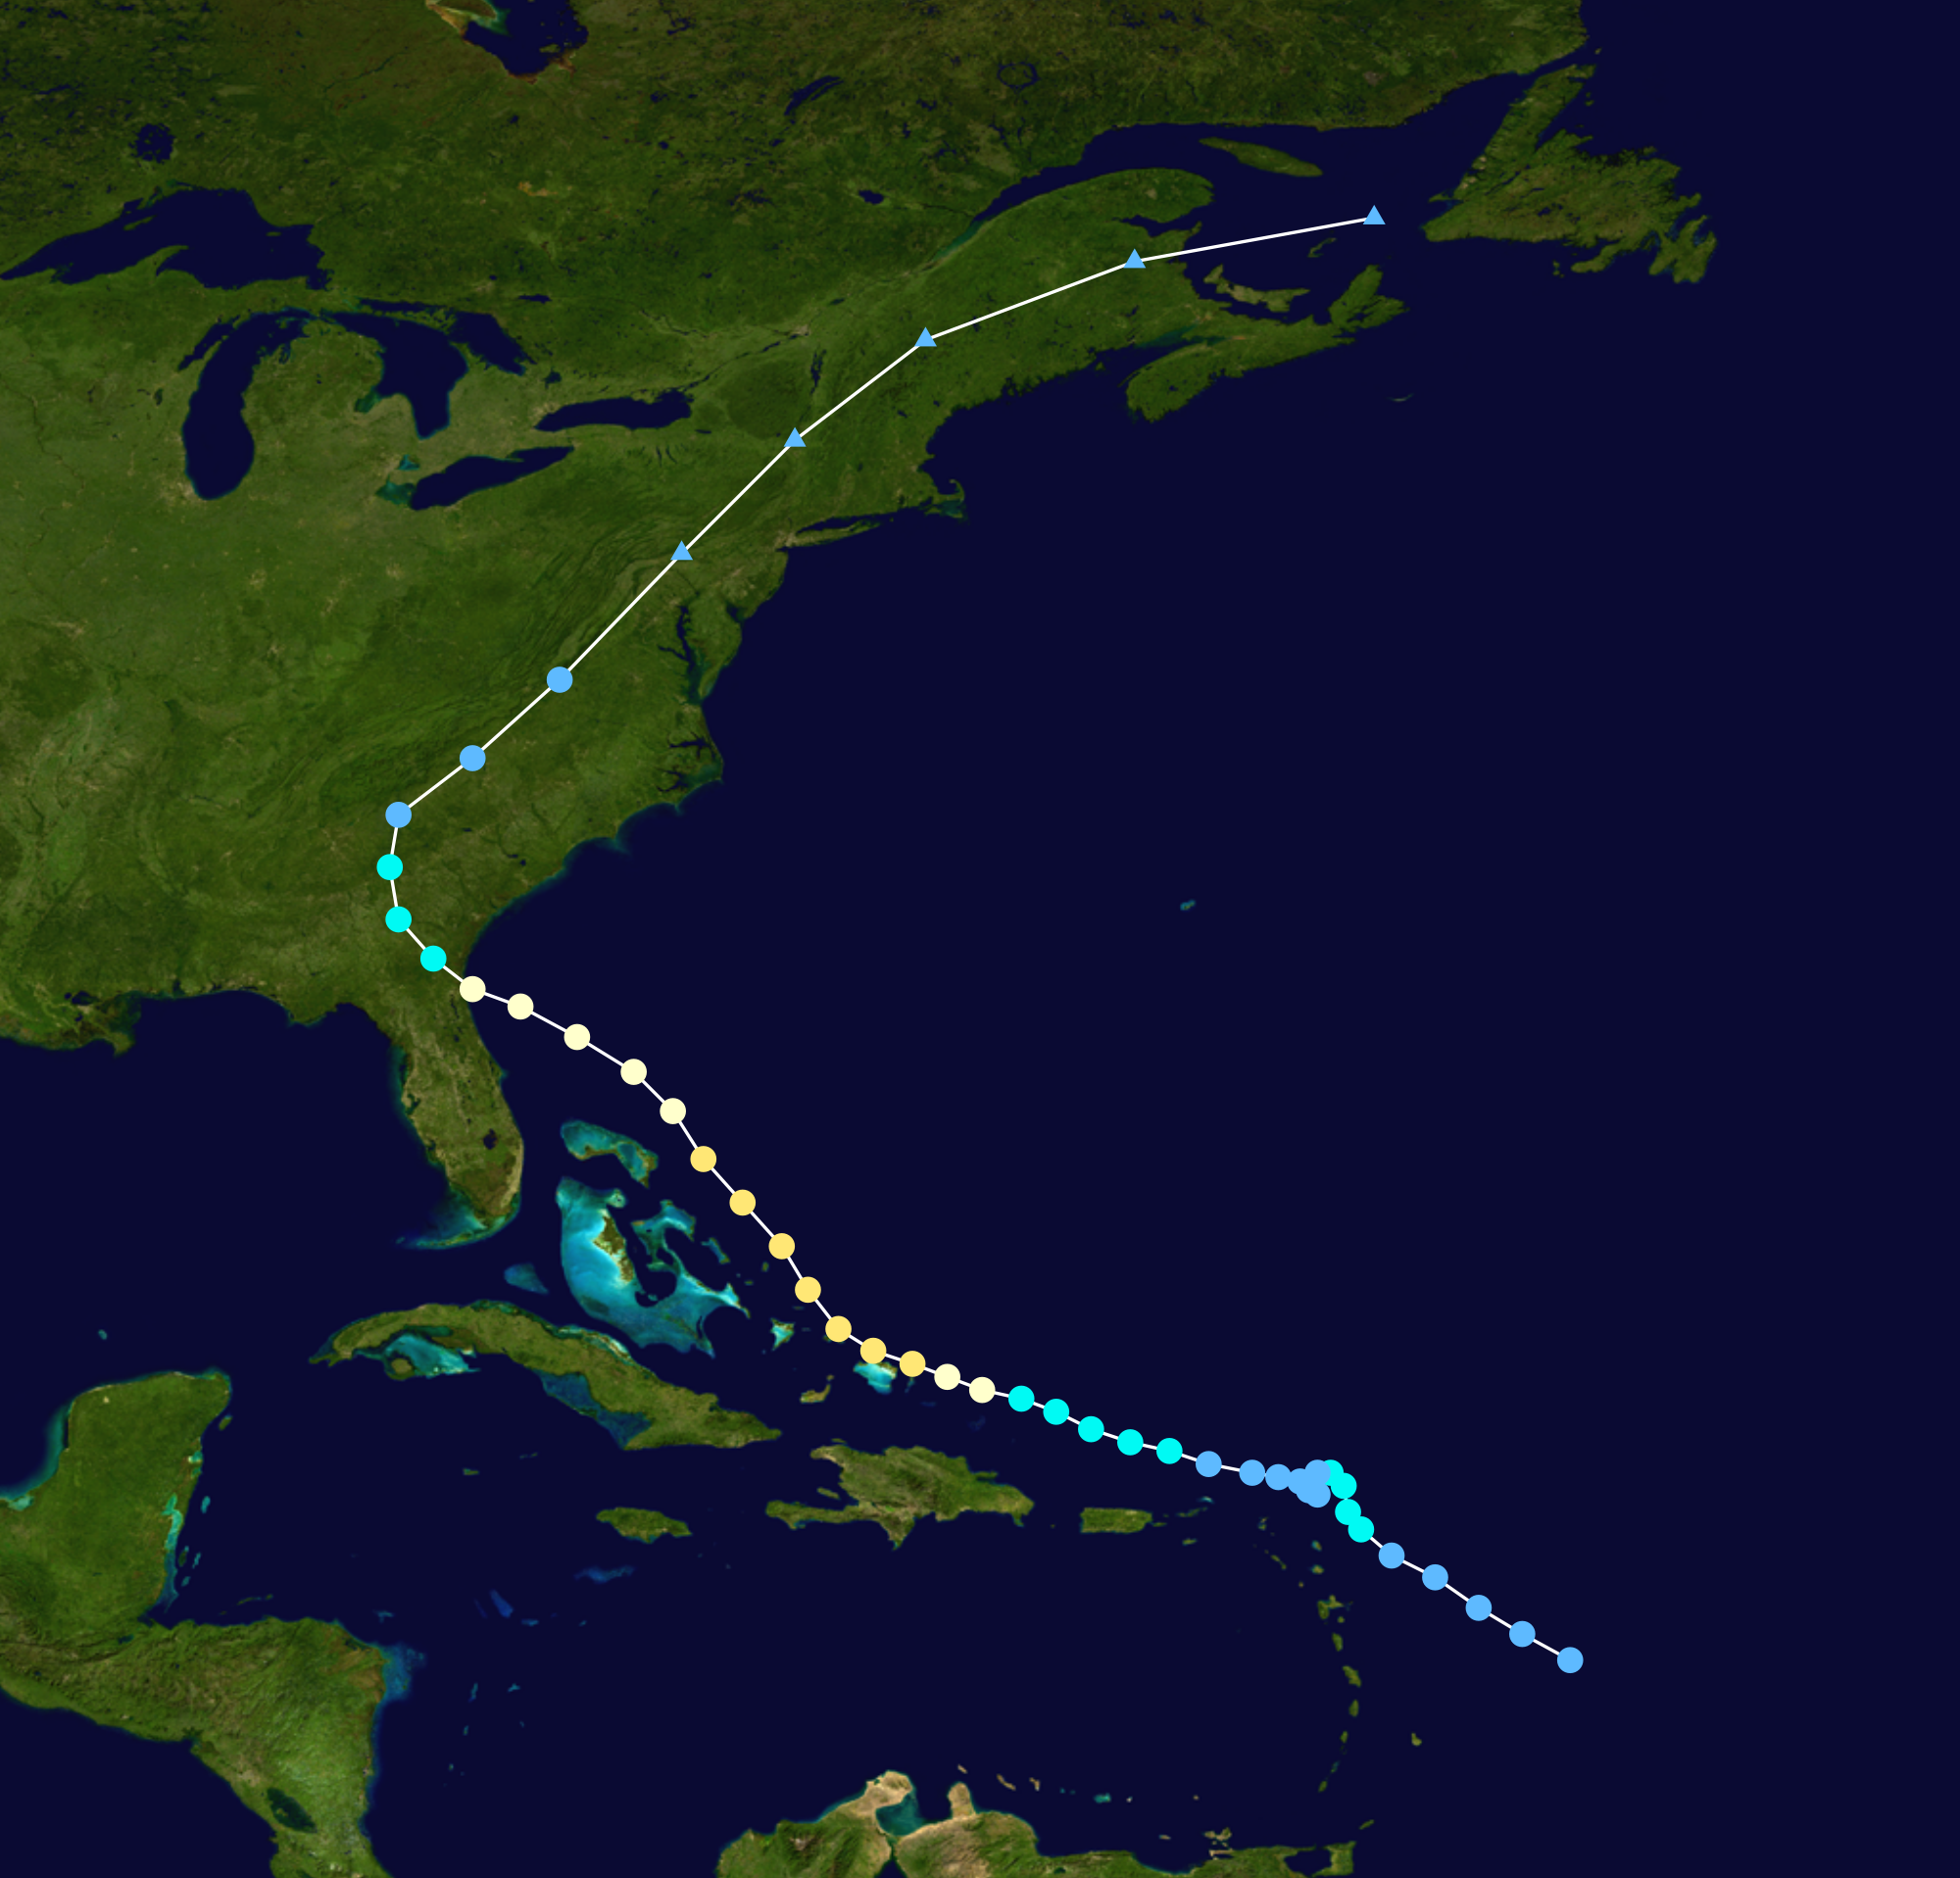
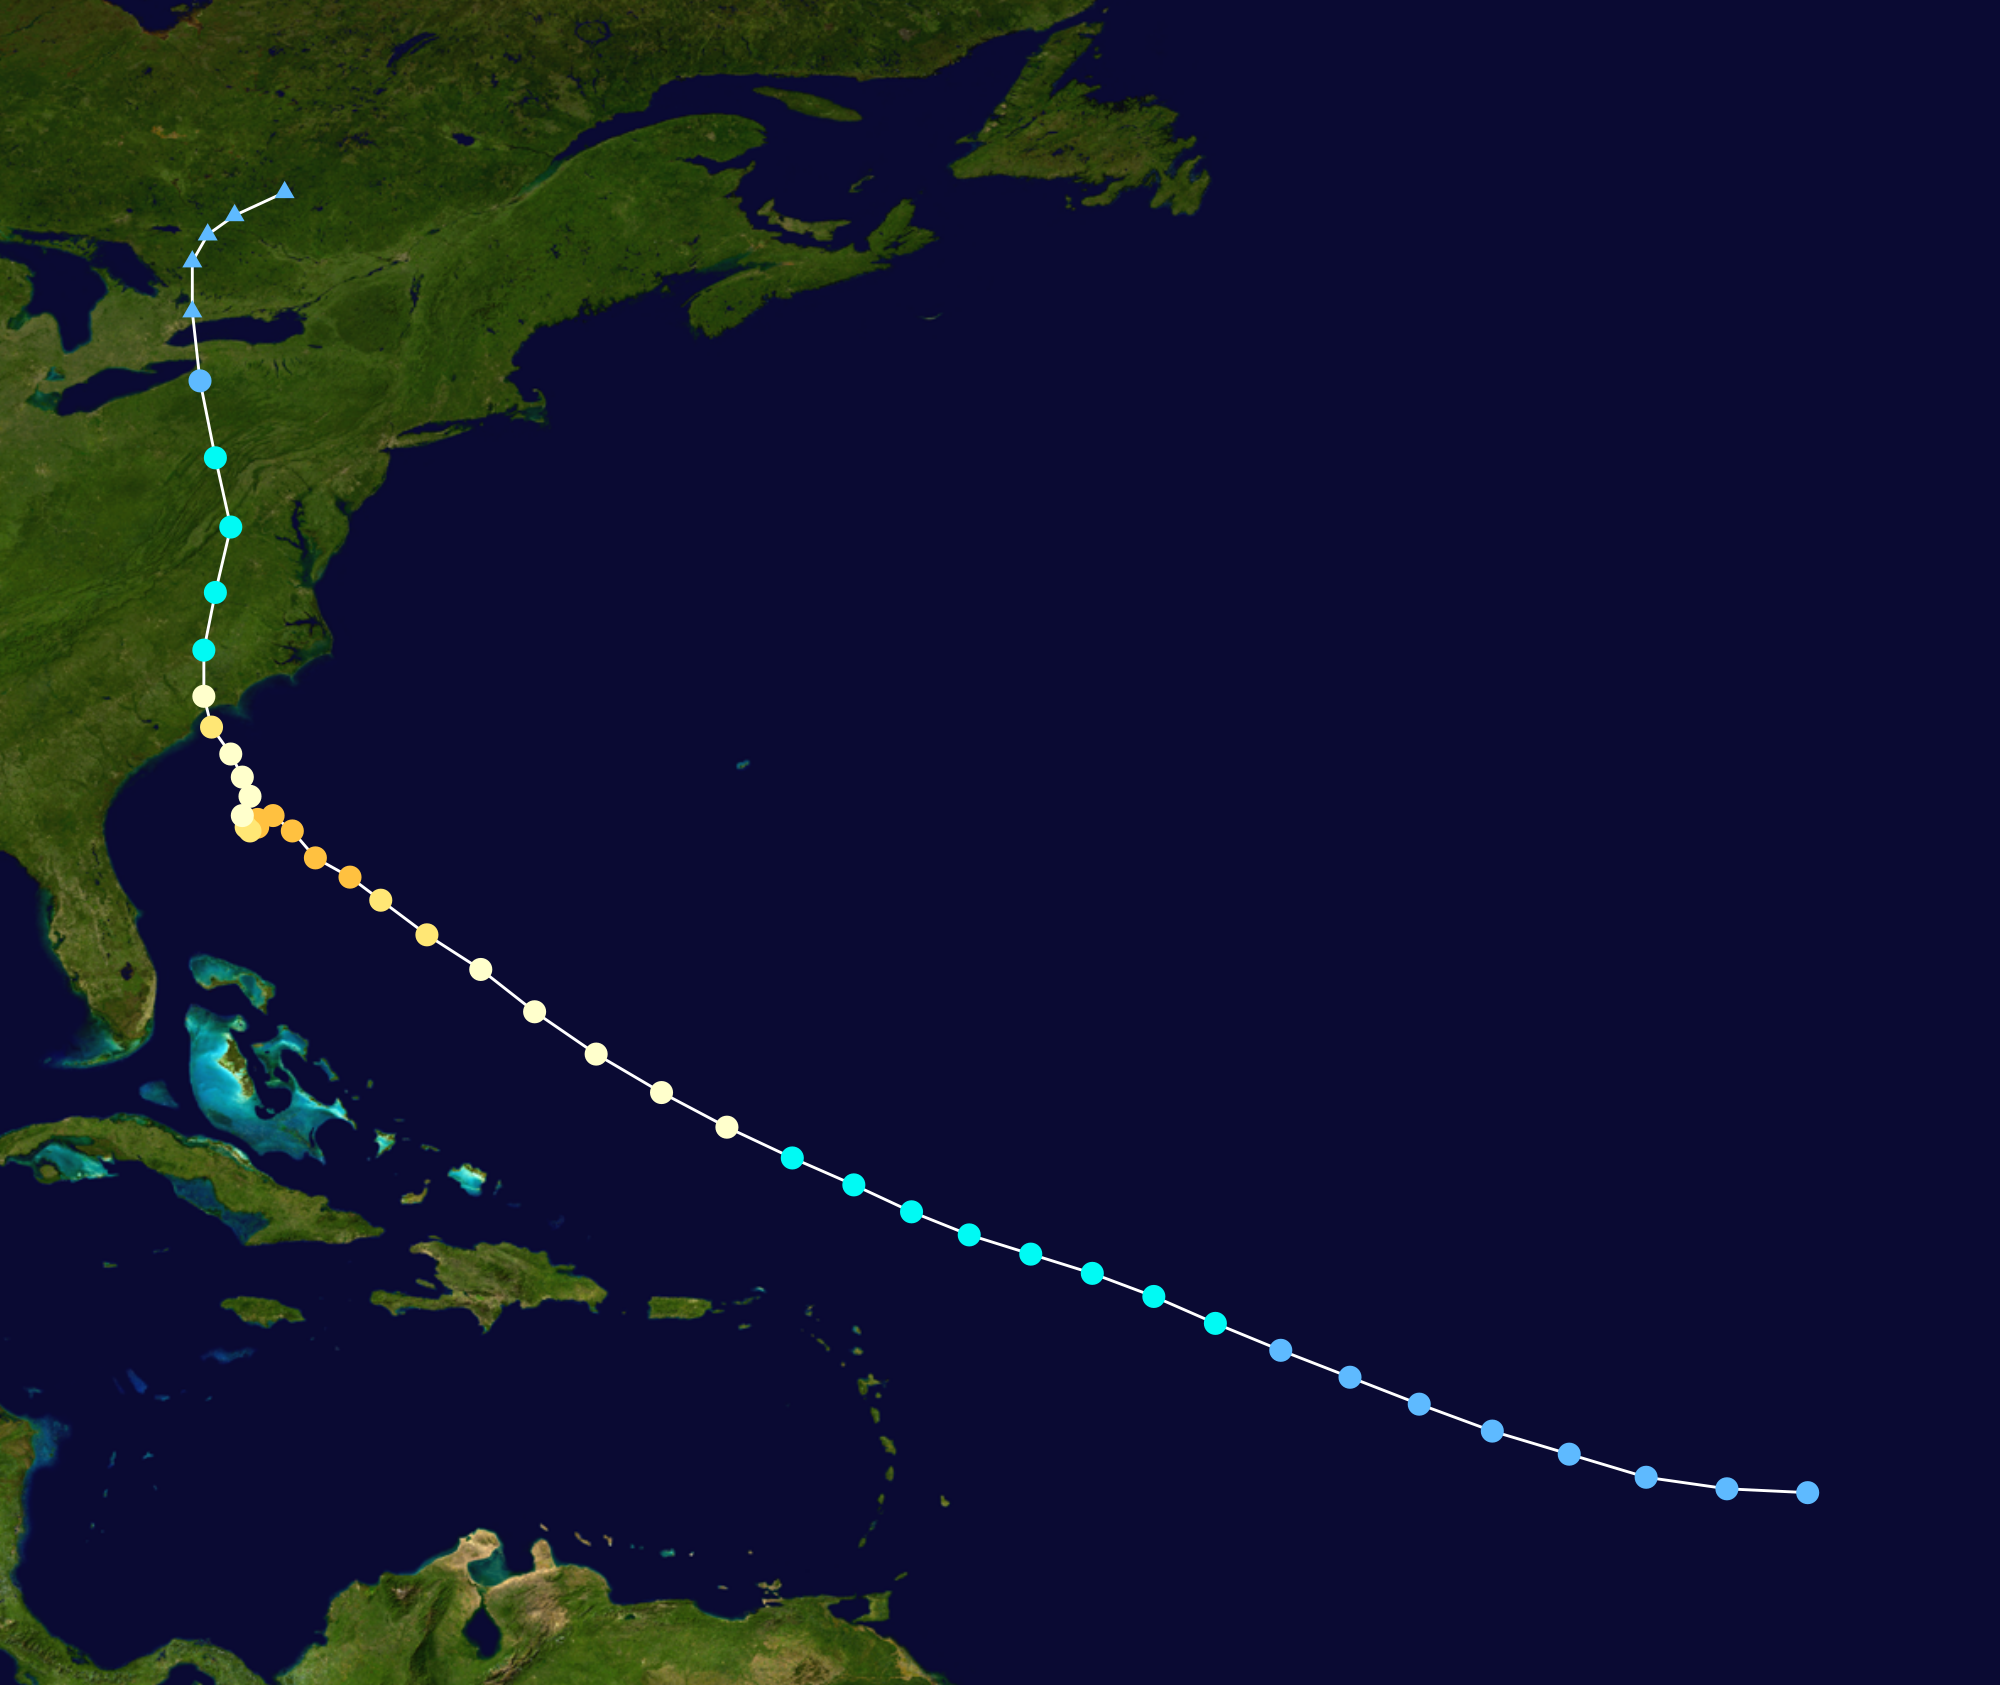
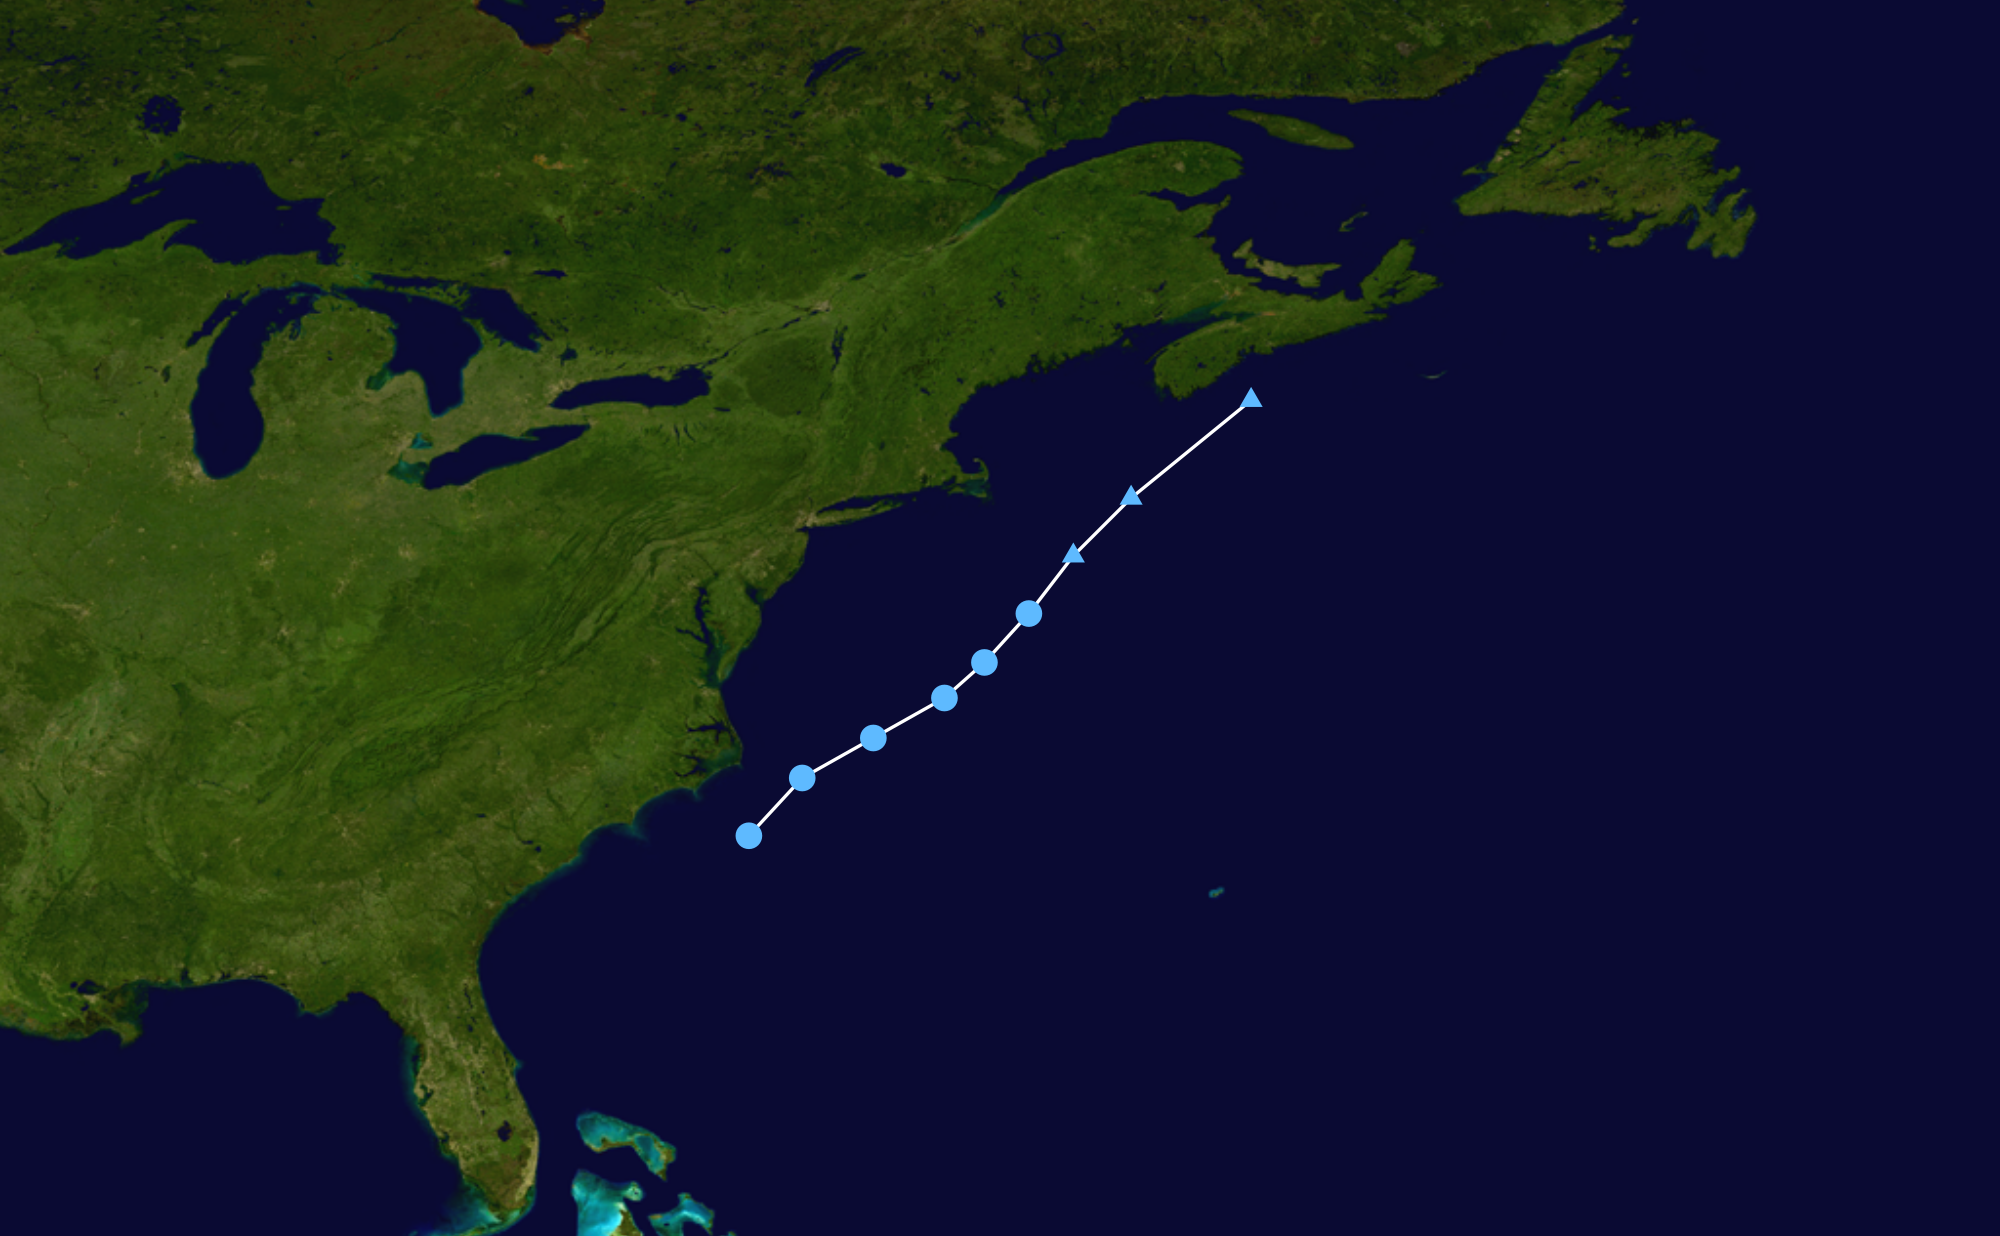
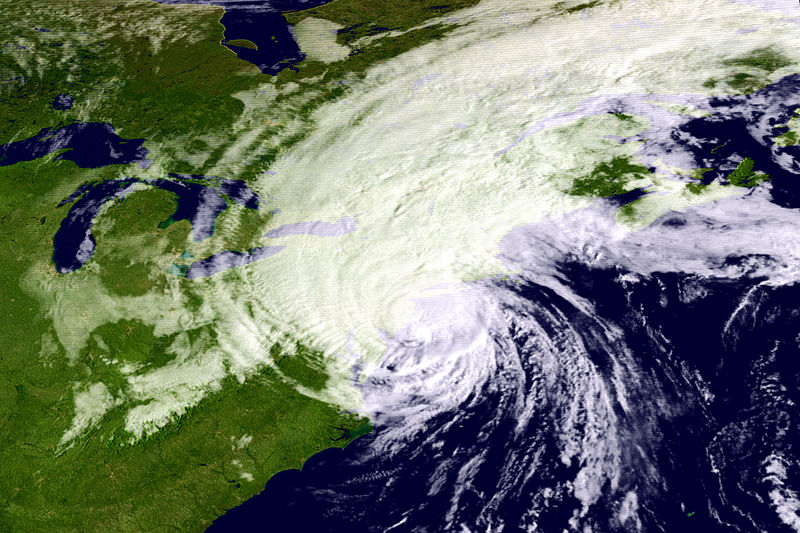
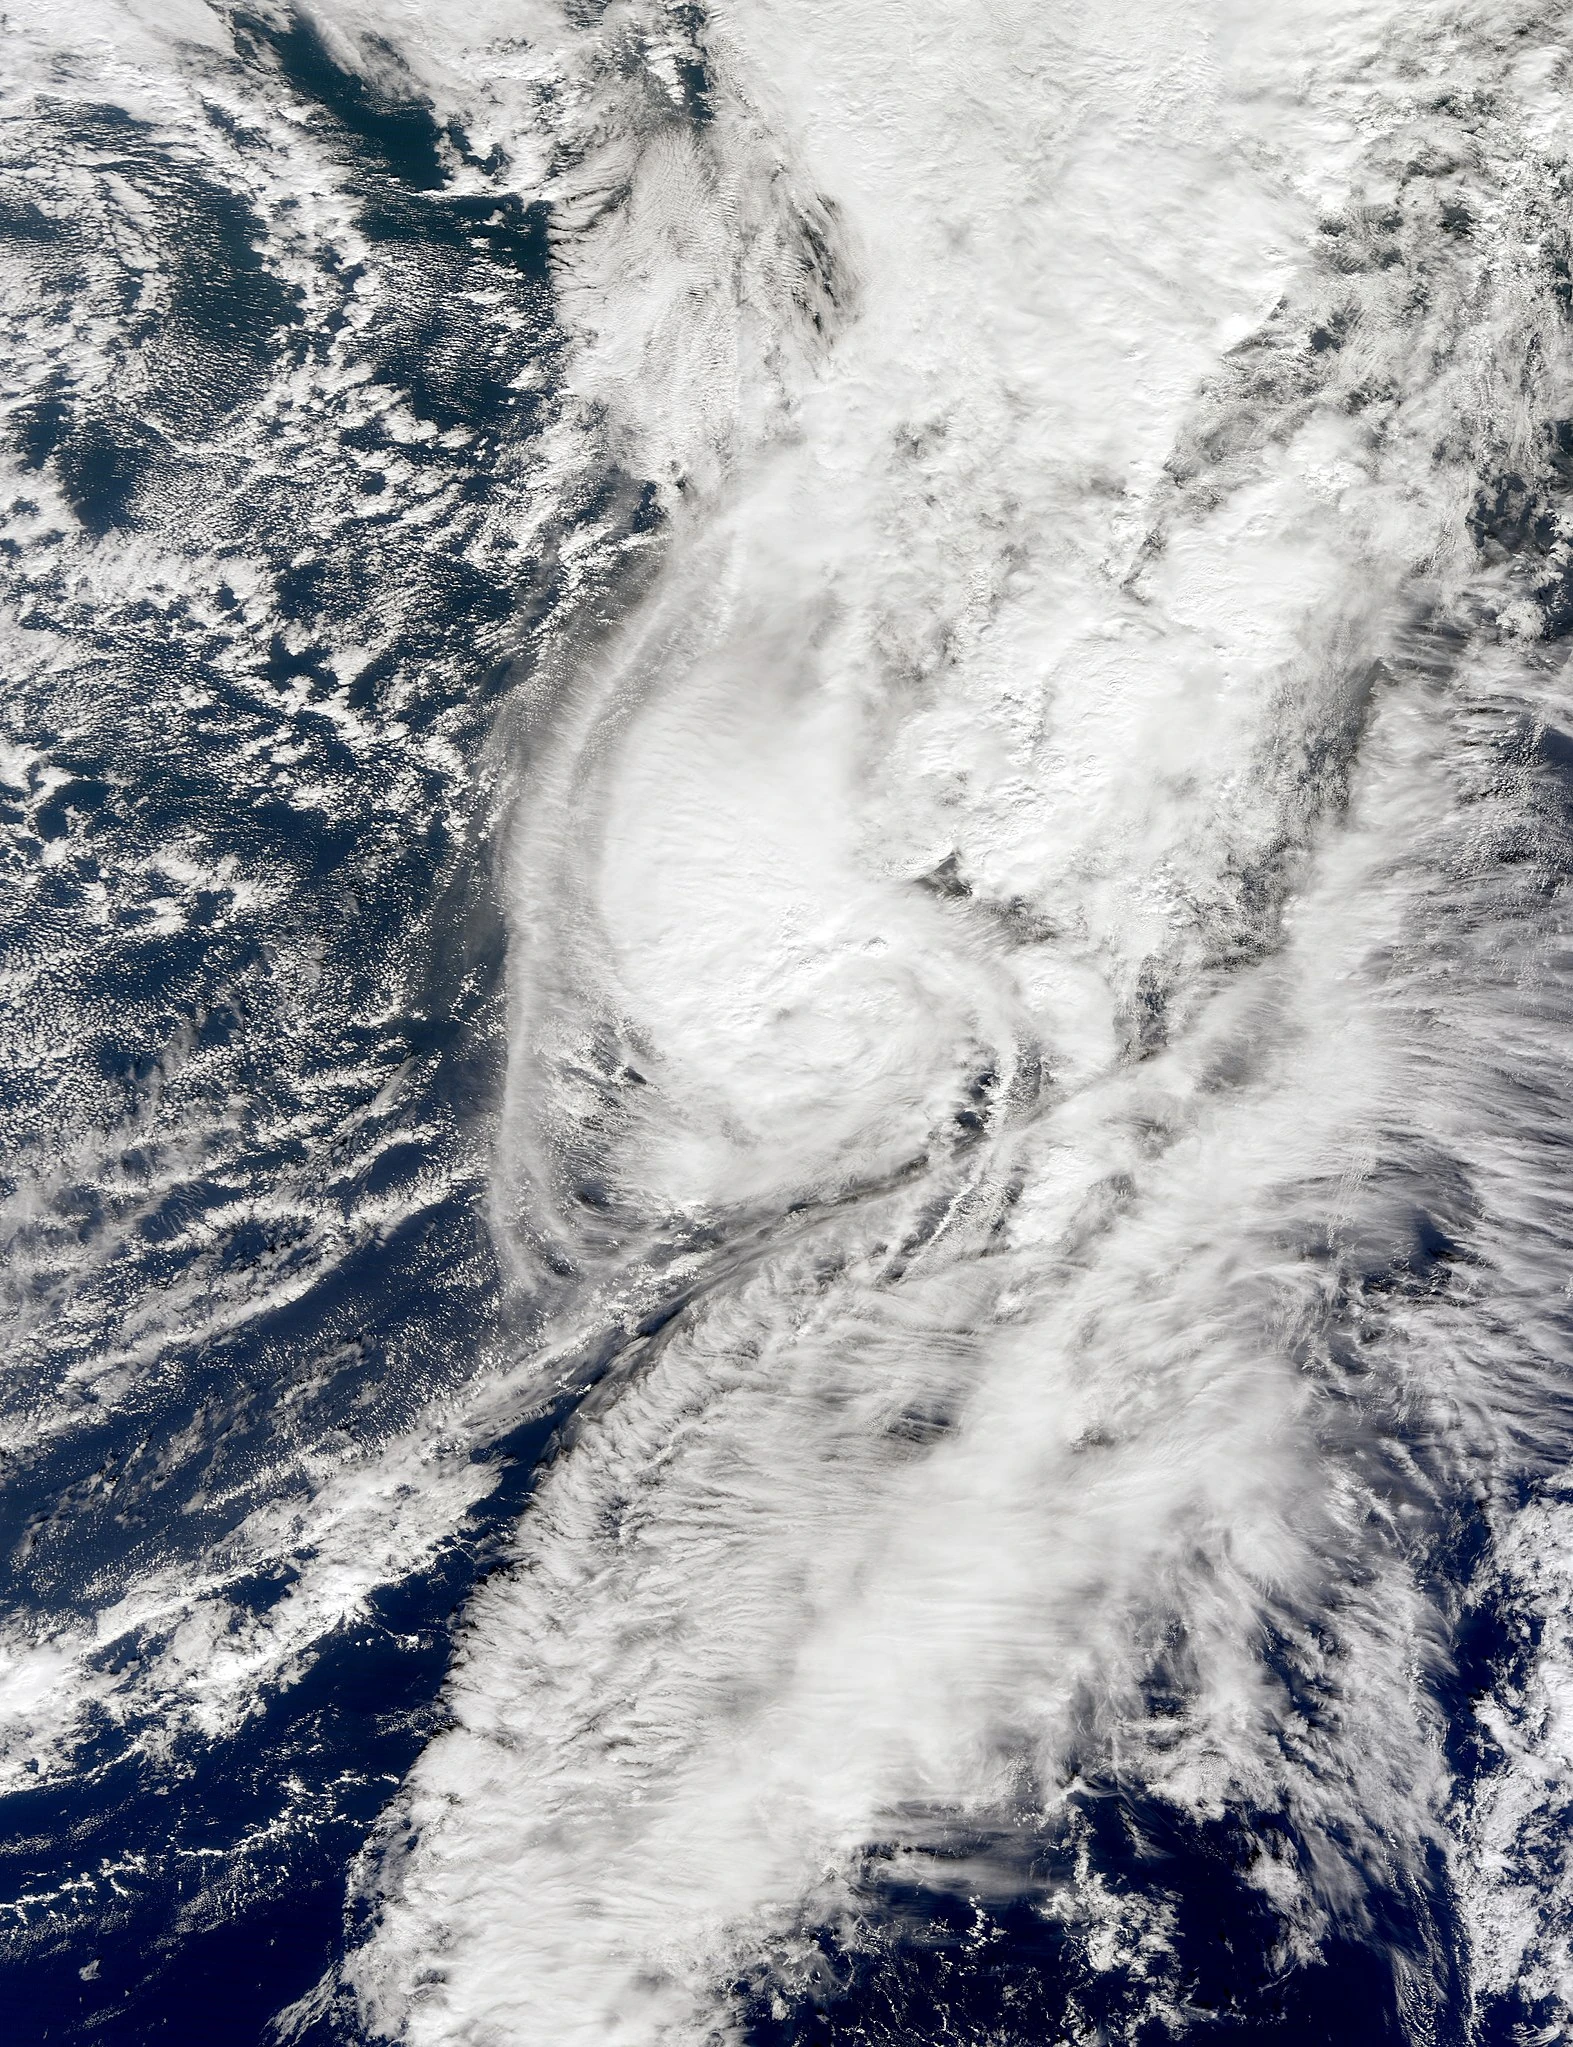
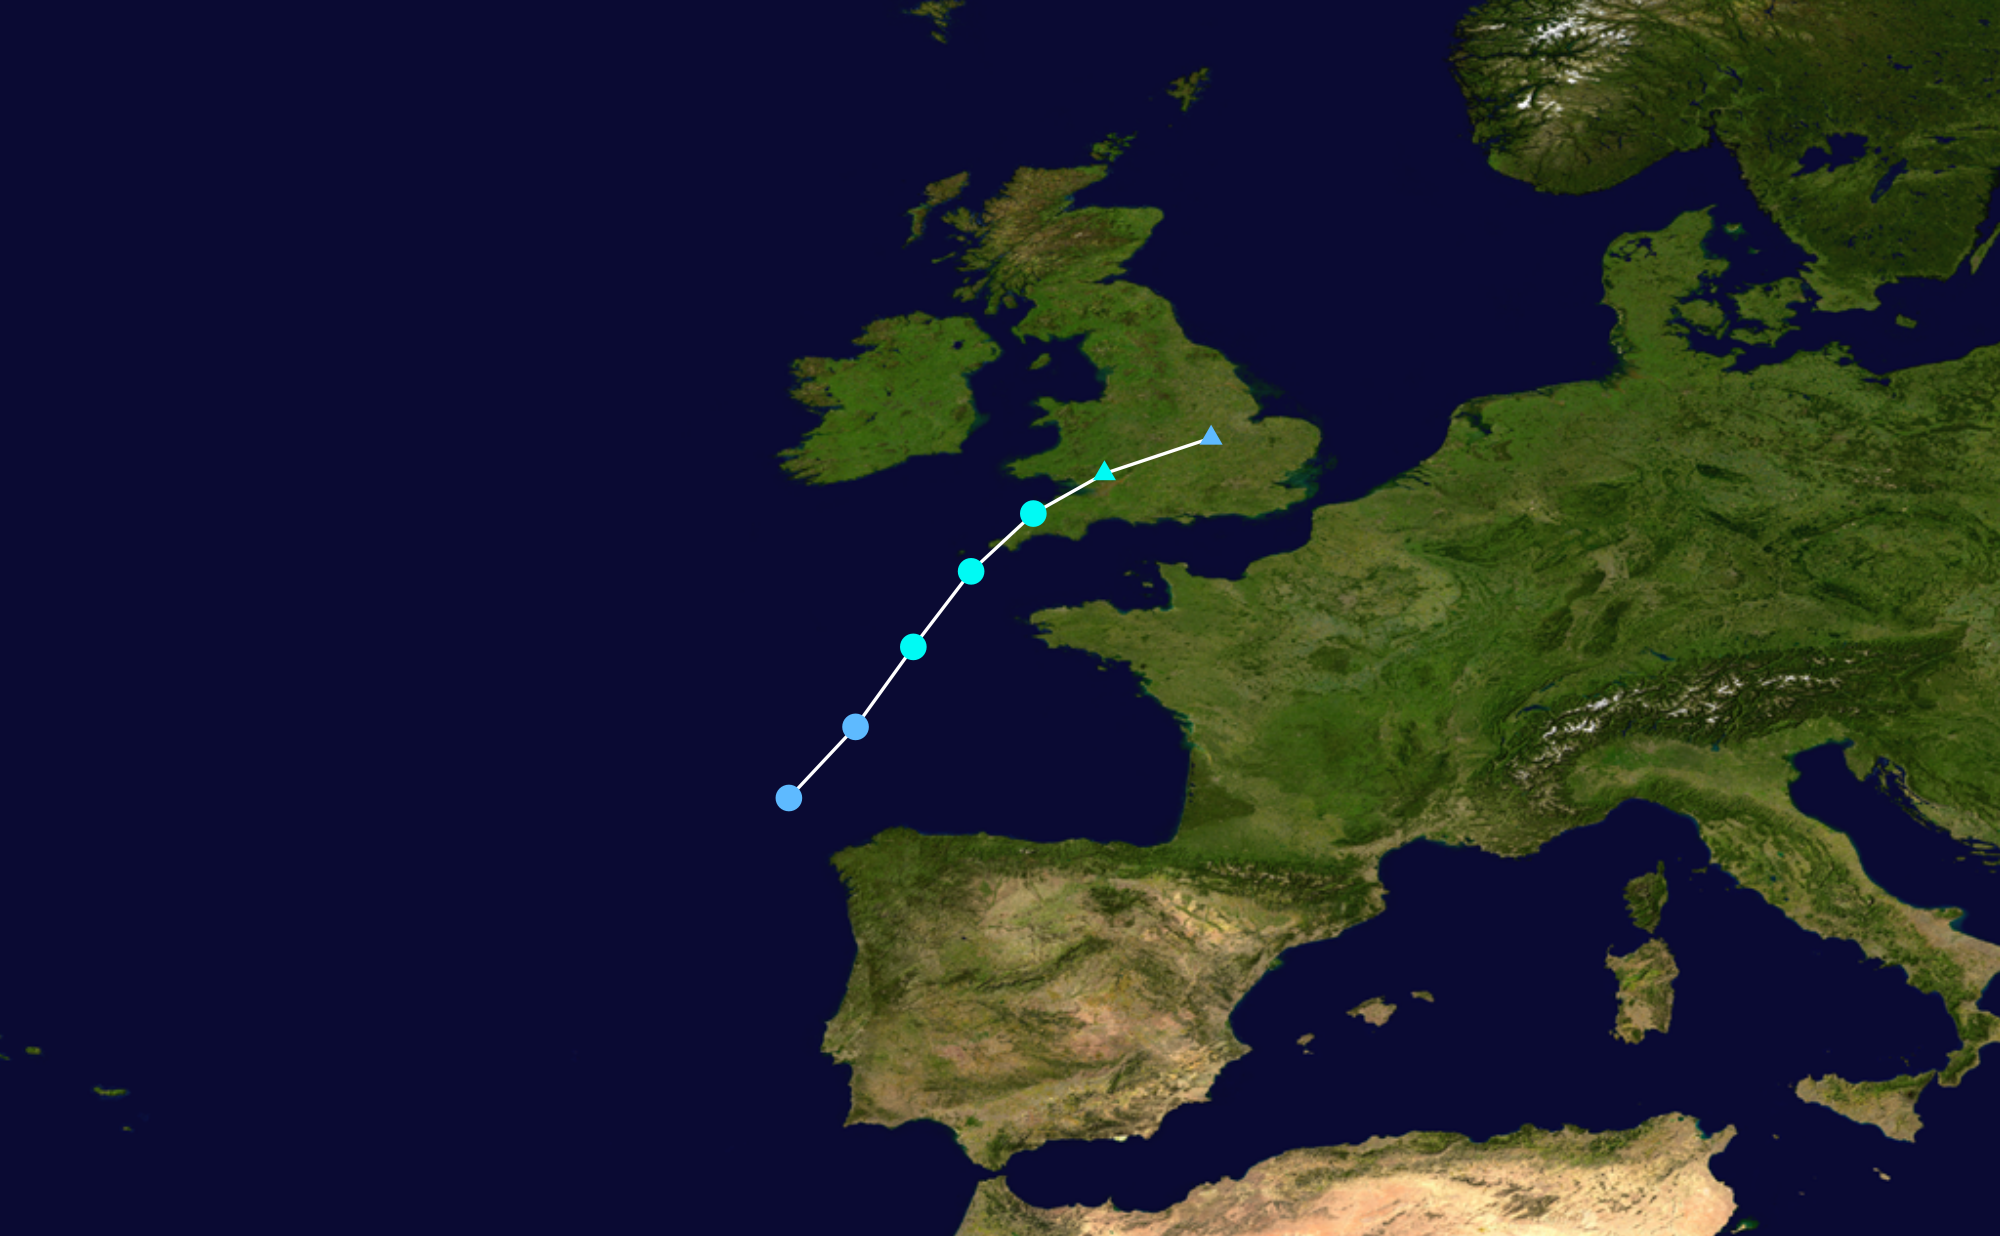
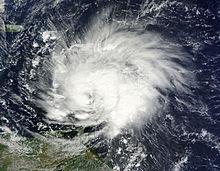
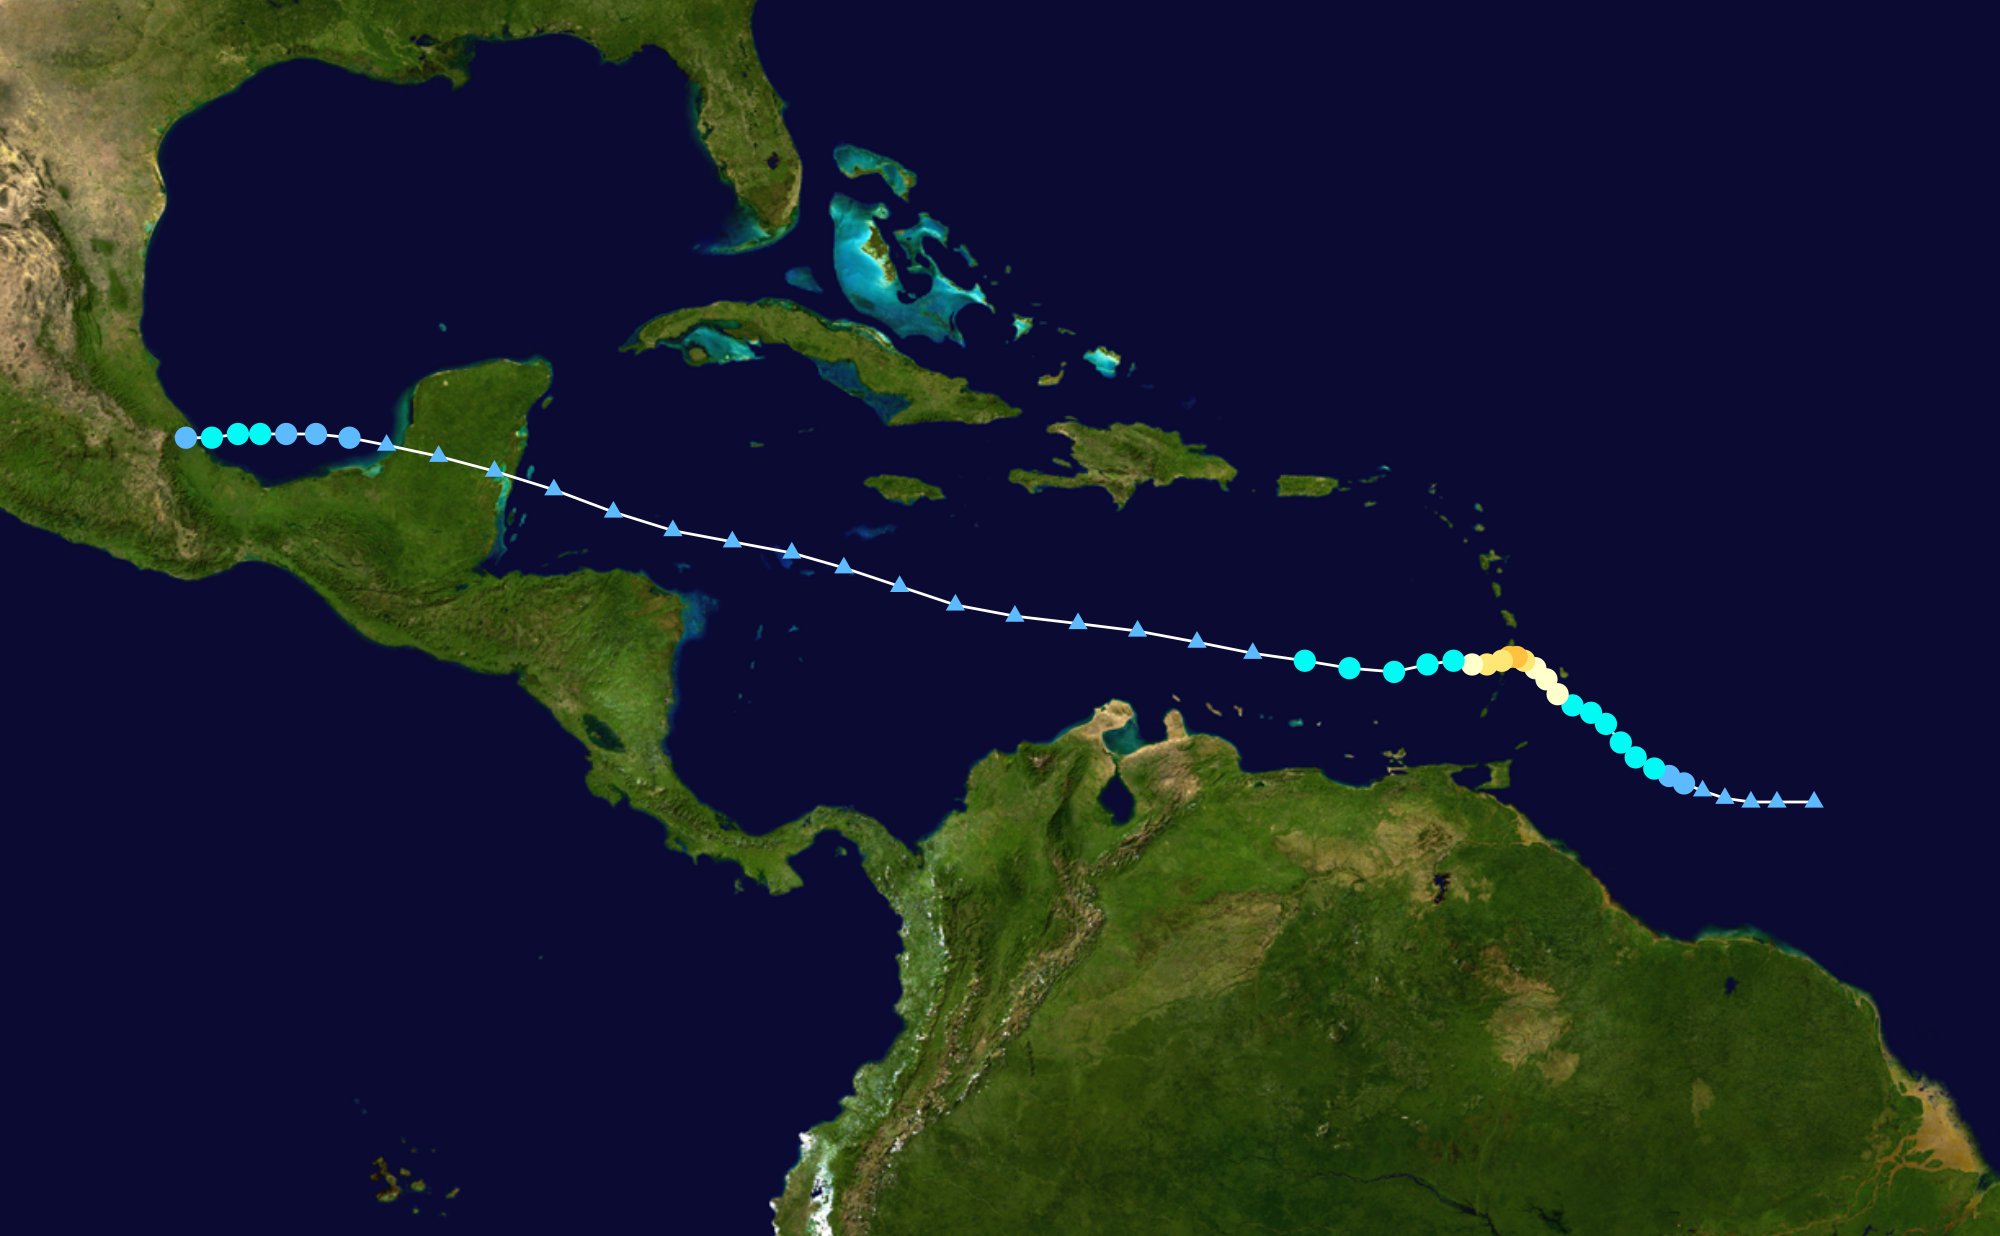
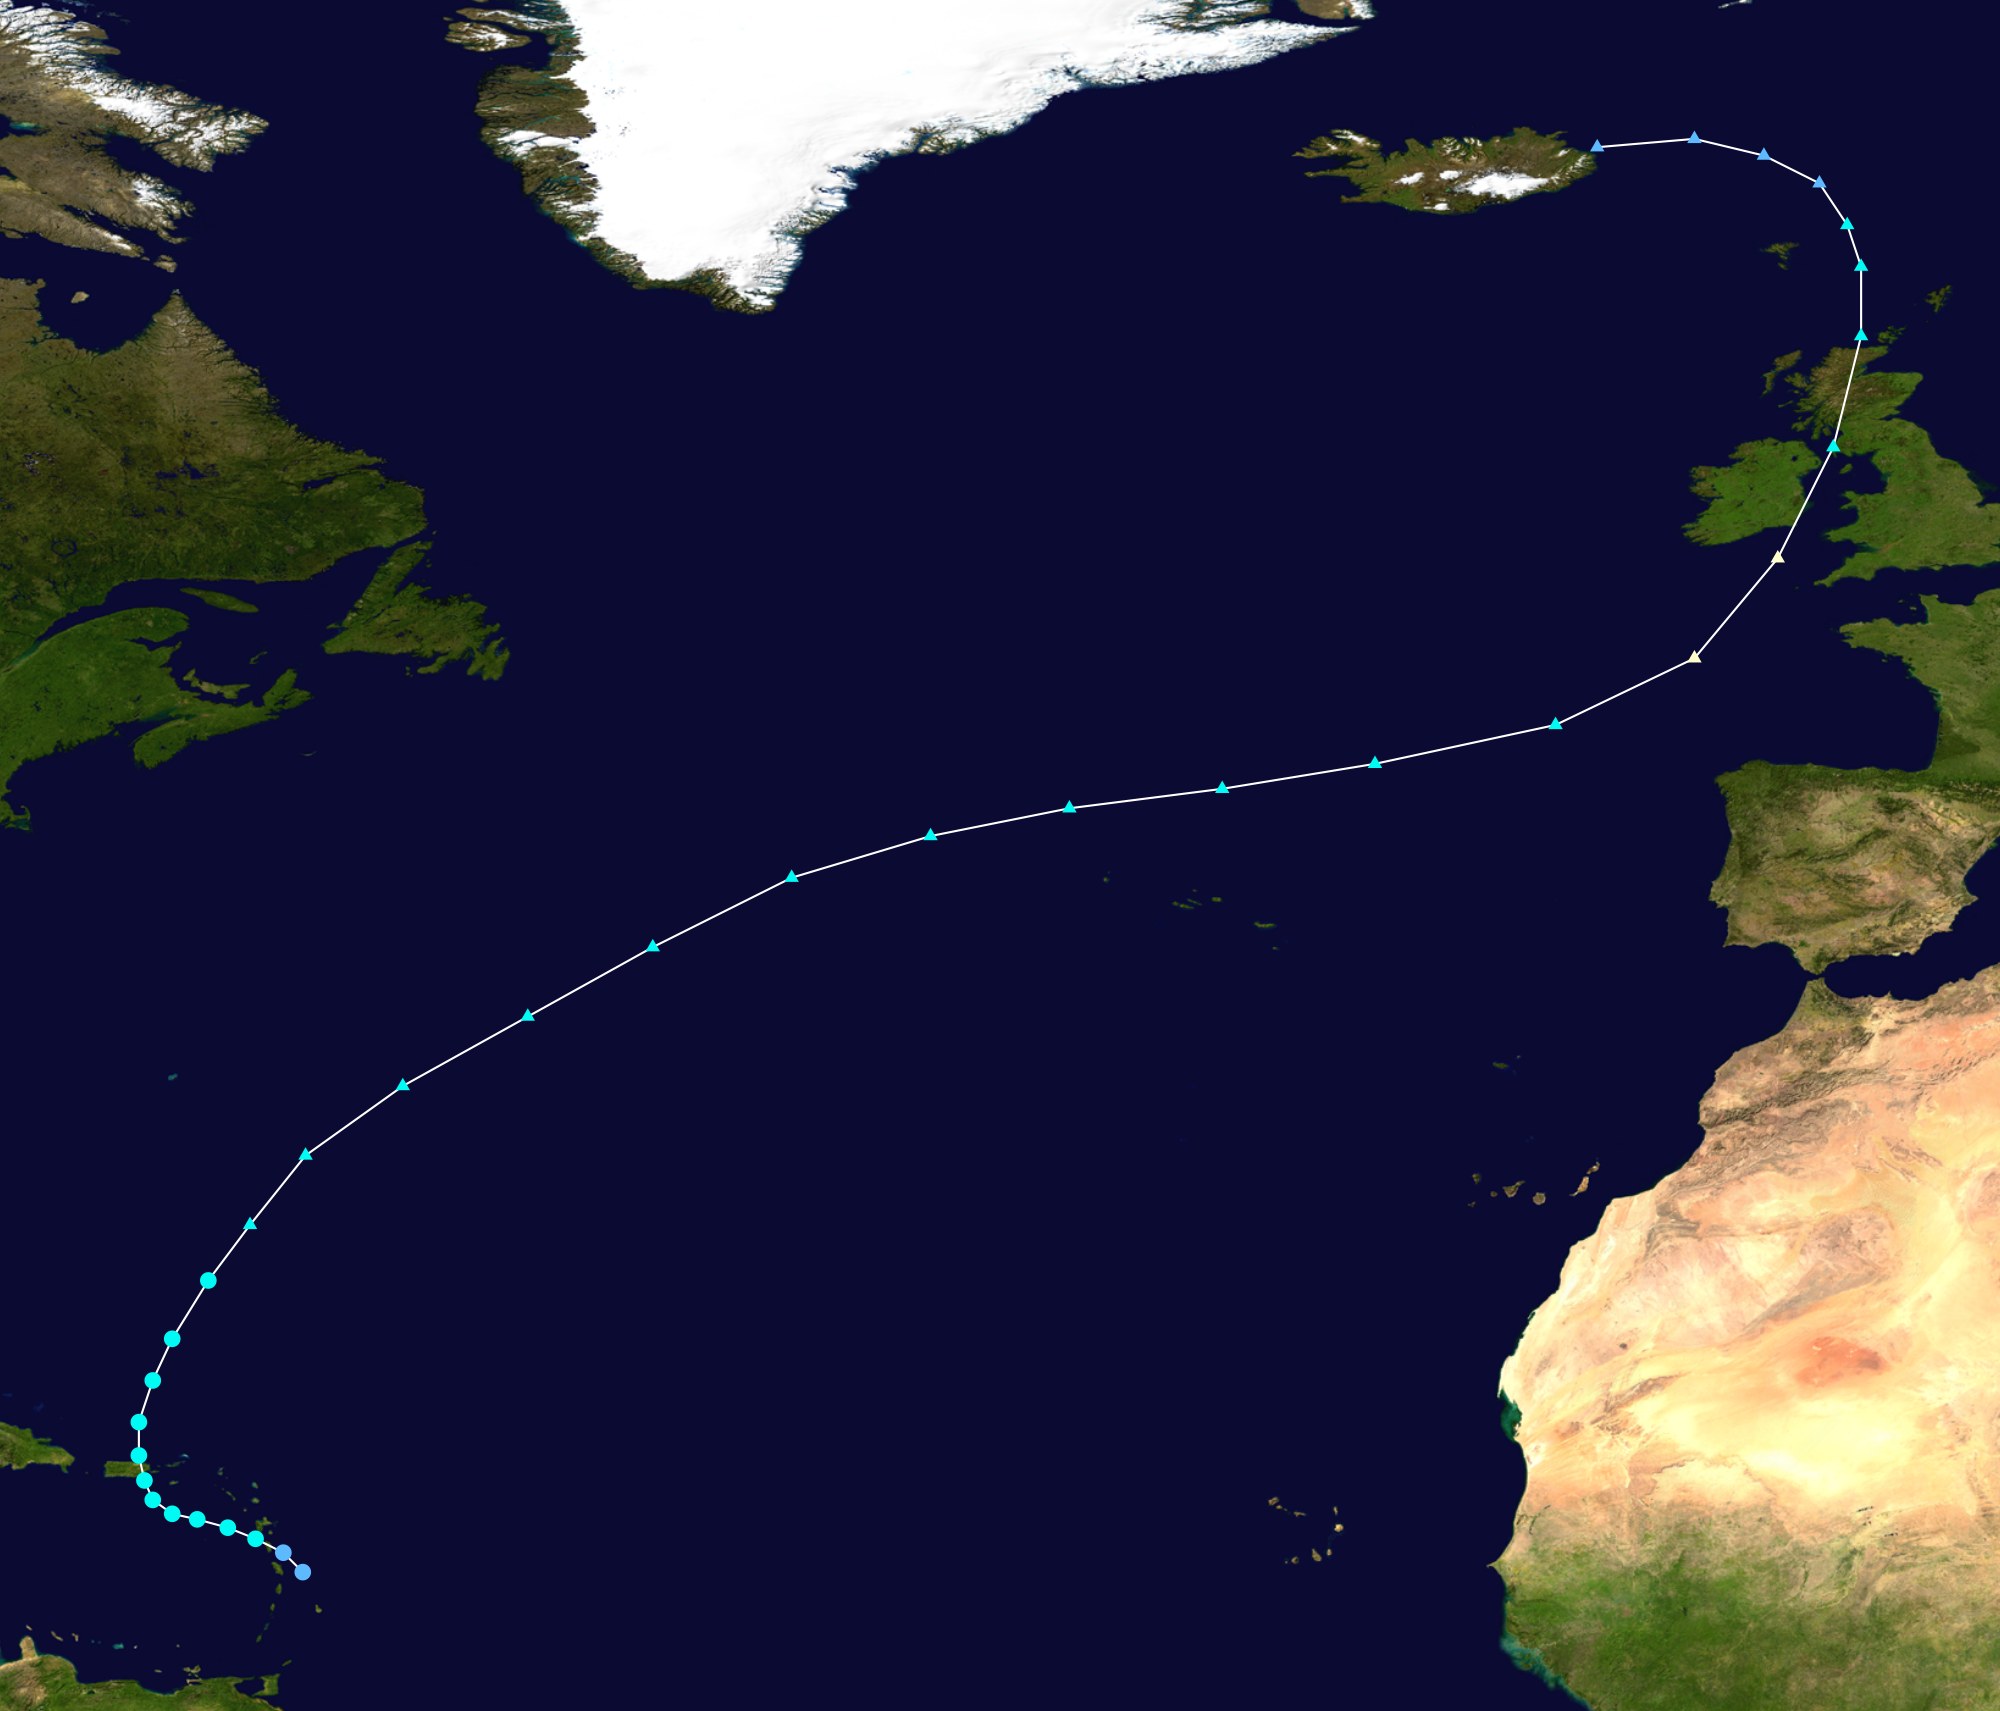
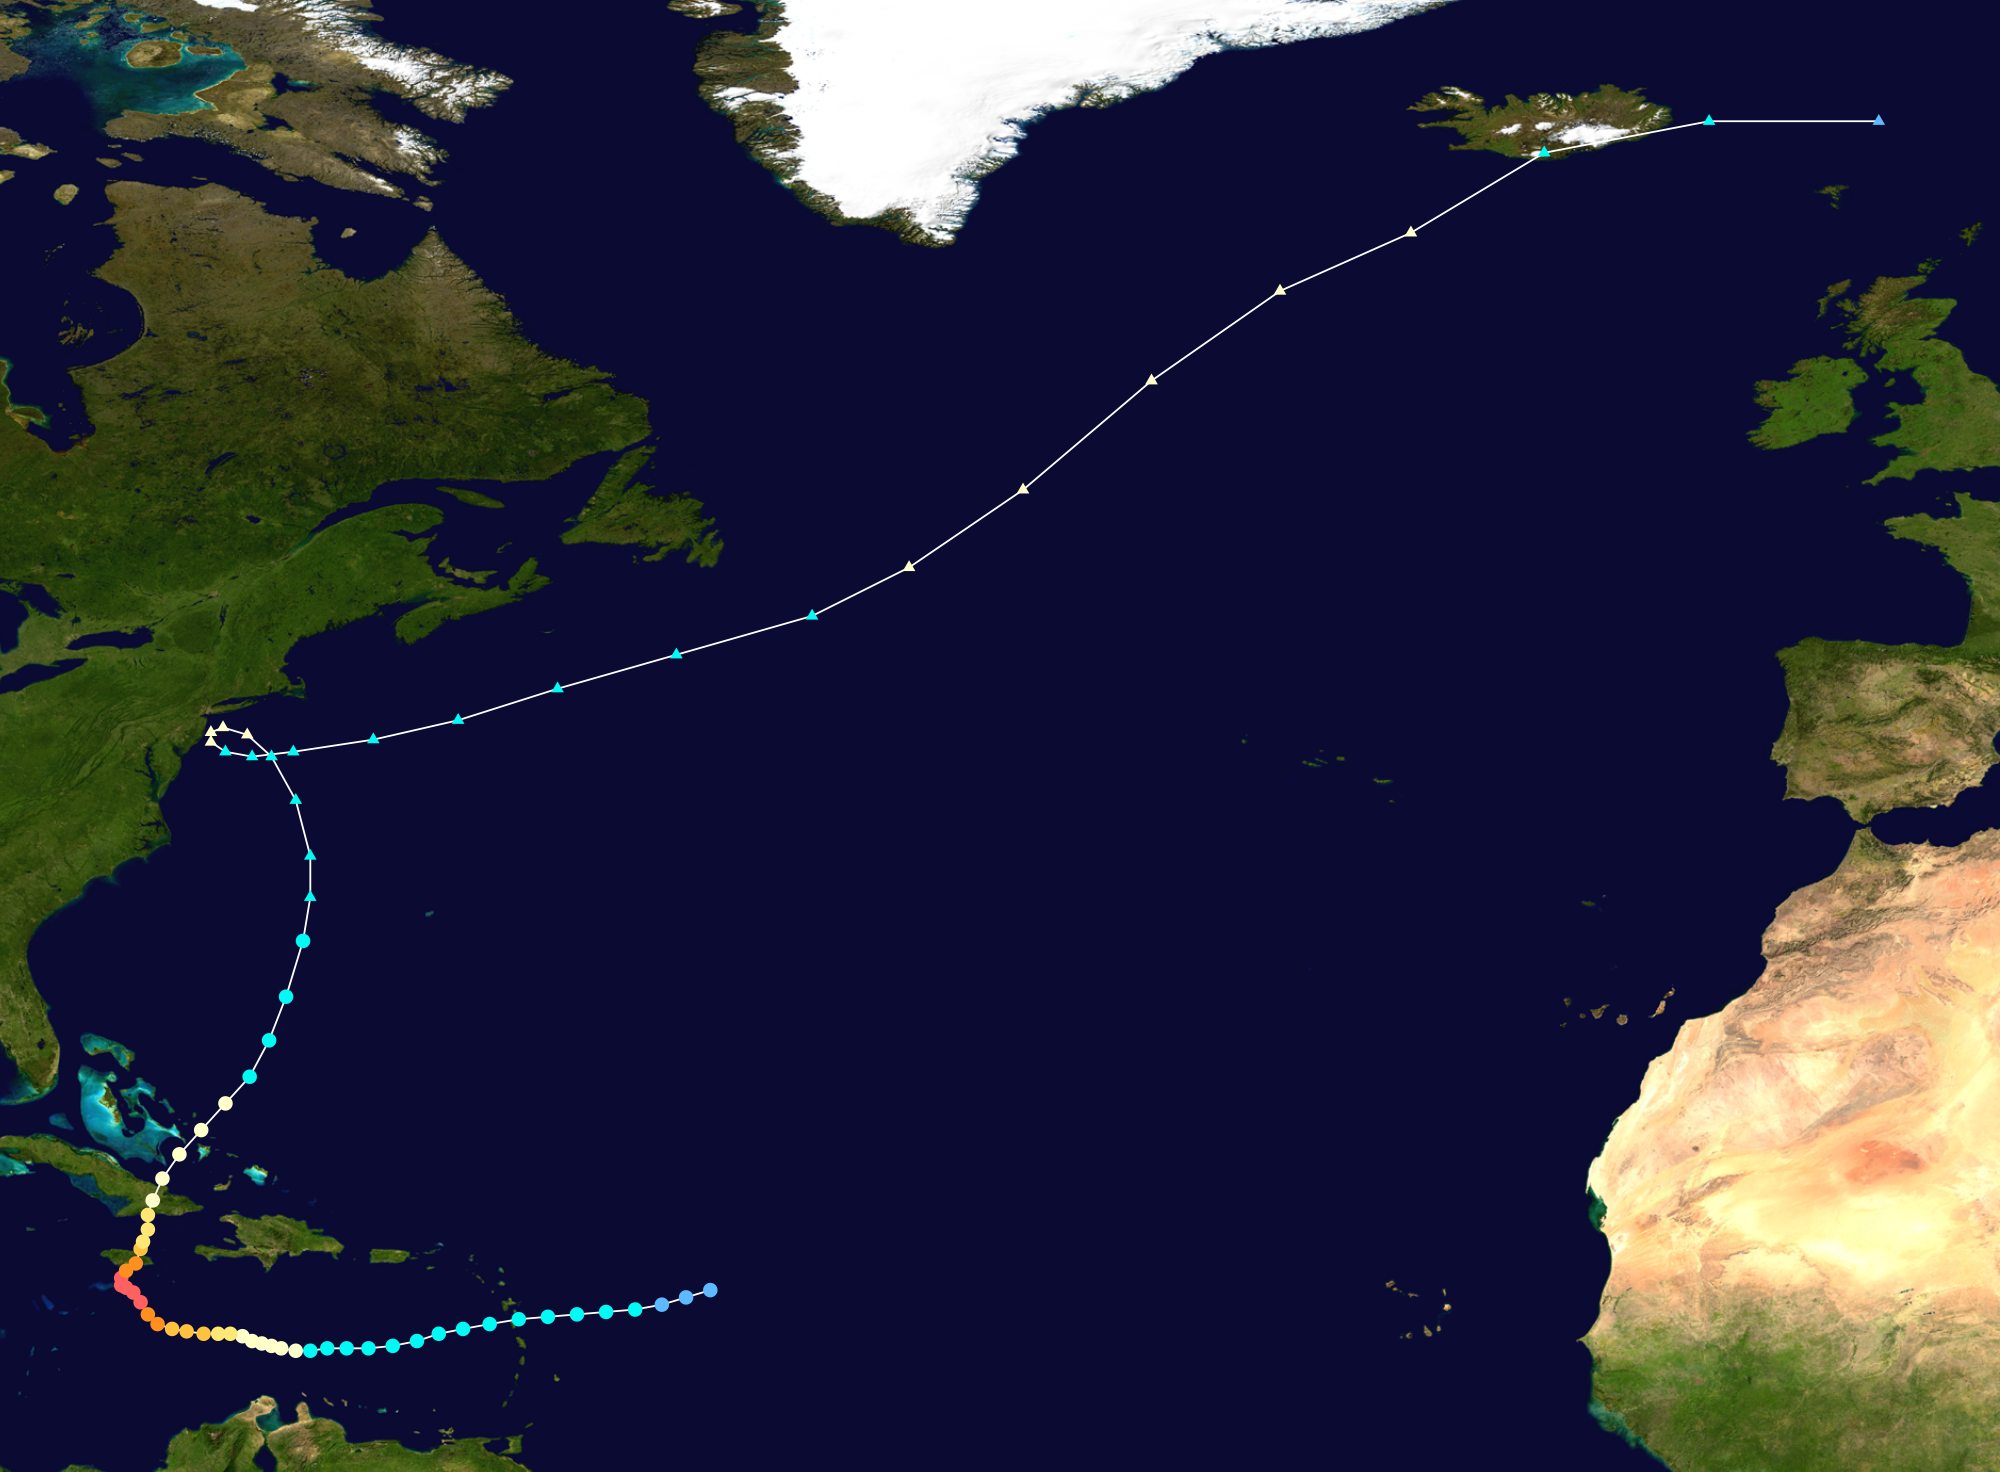
Hurricane Iron[]
| Category 5 hurricane (SSHWS) | |
  | |
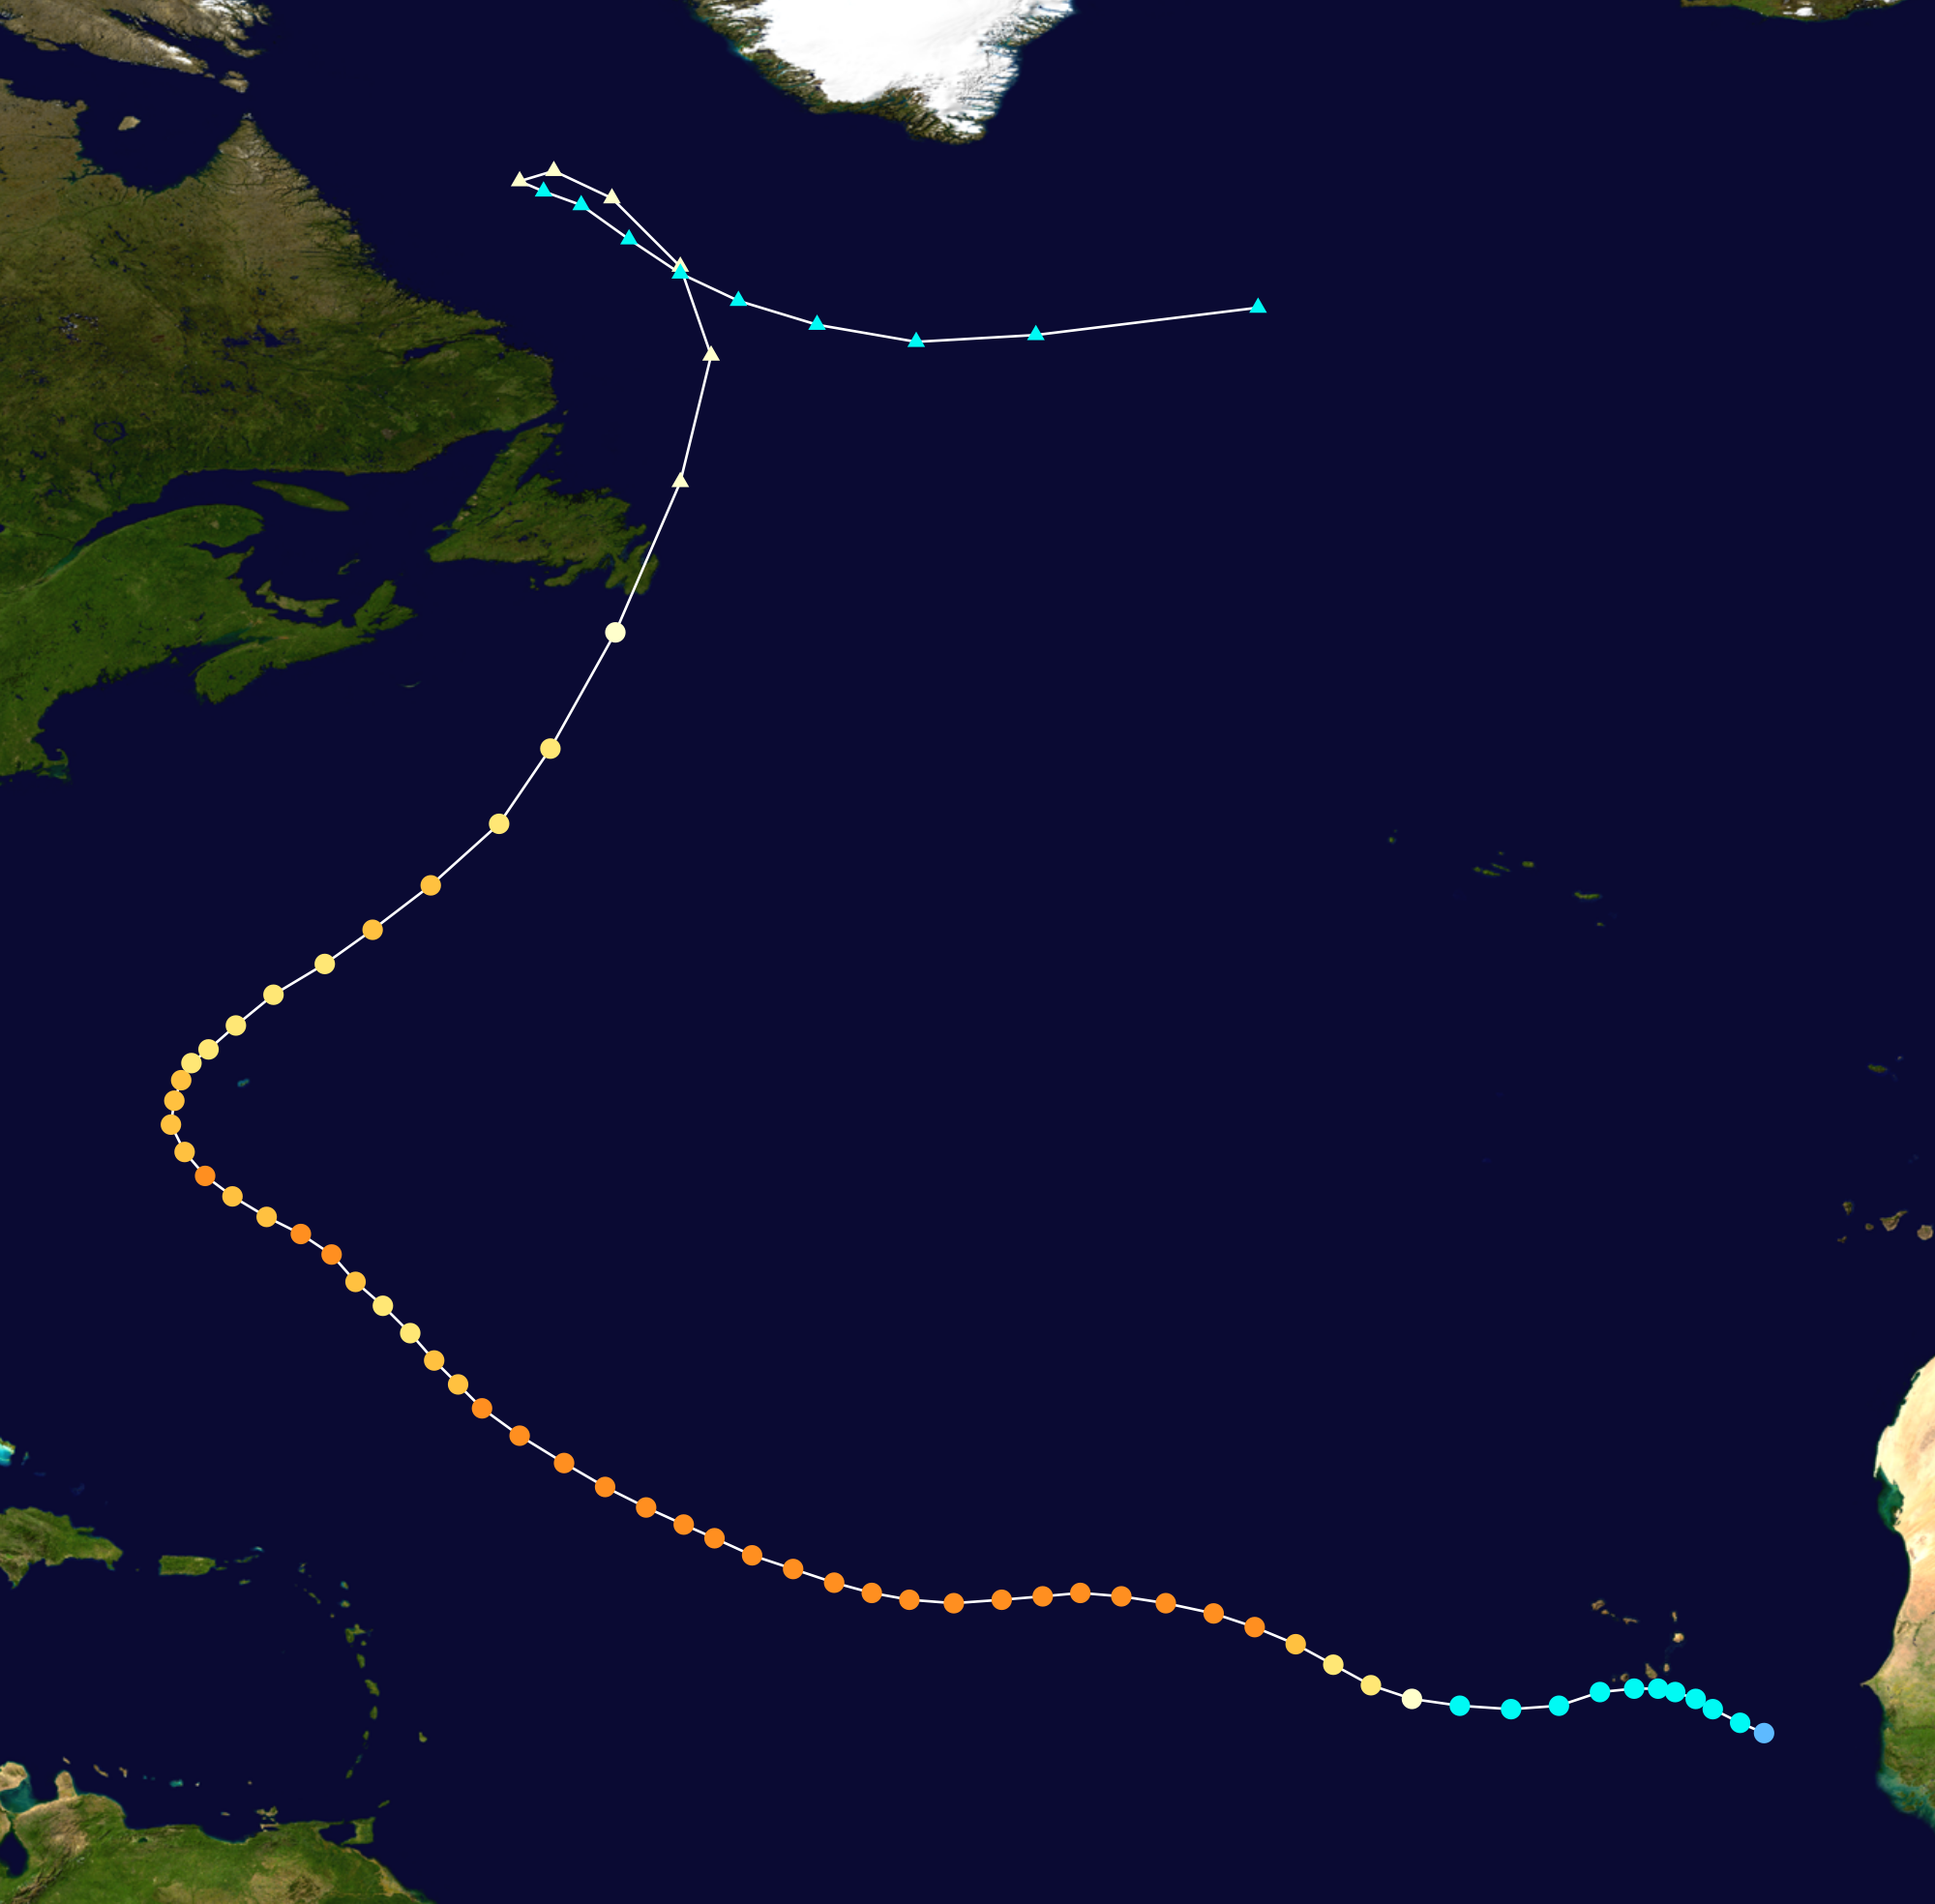
| Duration | August 31 – September 21 |
|---|---|
| Peak intensity | 200 mph (325 km/h) (1-min) 867 mbar (hPa) |
A strong tropical wave formed off the coast of West Africa on August 28. The hurricane broke several records. Iron achieved the second highest ACE rating of 81.0, just shy of Hurricane Ioke, the easternmost active and landfalling hurricane out of any in the Atlantic, northernmost forming major hurricane, lowest pressure worldwide, one of the few hurricanes to make landfall to Europe, and the only hurricane to make landfall to France.
Hurricane Jemima[]
| Category 3 hurricane (SSHWS) | |
  | |
| Duration | September 3 – September 12 |
|---|---|
| Peak intensity | 120 mph (195 km/h) (1-min) 950 mbar (hPa) |
Tropical wave
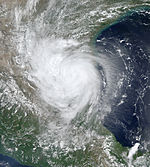
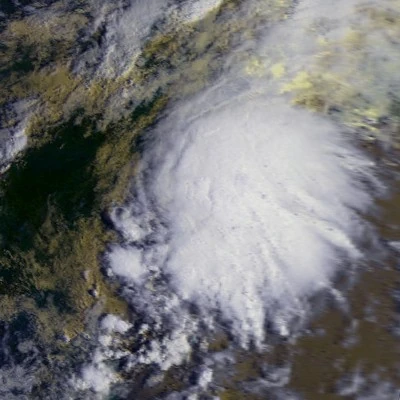
Hurricane Kenny[]
| Category 1 hurricane (SSHWS) | |
  | |
| Duration | September 7 – September 13 |
|---|---|
| Peak intensity | 80 mph (130 km/h) (1-min) 983 mbar (hPa) |
Non-tropical area of low had formed in the Gulf of Mexico, eventually organizing into Tropical Storm Kenny. Before making landfall in Louisiana, it had become a Category 1 Hurricane, peaking at 80 mph(130 km/h). It weakened and did not become a hurricane again. It weakened as it took a northeast path, officially dissipating near Sweden.
Hurricane Lilli[]
| Category 1 hurricane (SSHWS) | |
  | |
| Duration | September 10 – September 14 |
|---|---|
| Peak intensity | 90 mph (150 km/h) (1-min) 976 mbar (hPa) |
Tropical wave
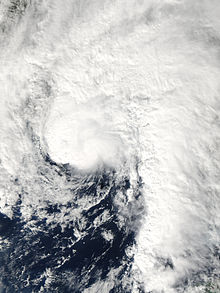
Hurricane Mike[]
| Category 2 hurricane (SSHWS) | |
  | |
| Duration | September 14 – September 20 |
|---|---|
| Peak intensity | 105 mph (165 km/h) (1-min) 965 mbar (hPa) |
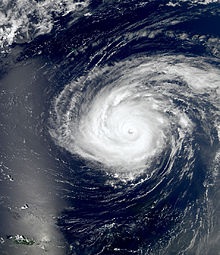
As the remnants of Hurricane Kenny continued northeastward to the British Isles, a frontal low began to develop on September 12. The low was soon encountered by the remnants of Hurricane Iron as Iron began regenerating into a subtropical cyclone, west-southwest of the Azores. This activity began to give the developing system favorable conditions for further development. On September 14, NHC started placing advisories for Subtropical Depression Thirteen, that would soon generate into a storm by the next morning. On September 15, the depression generated into a subtropical storm, giving it the name "Mike". However, later that night, Mike began to experience disorganization in its center, there after making the system a tropical storm.
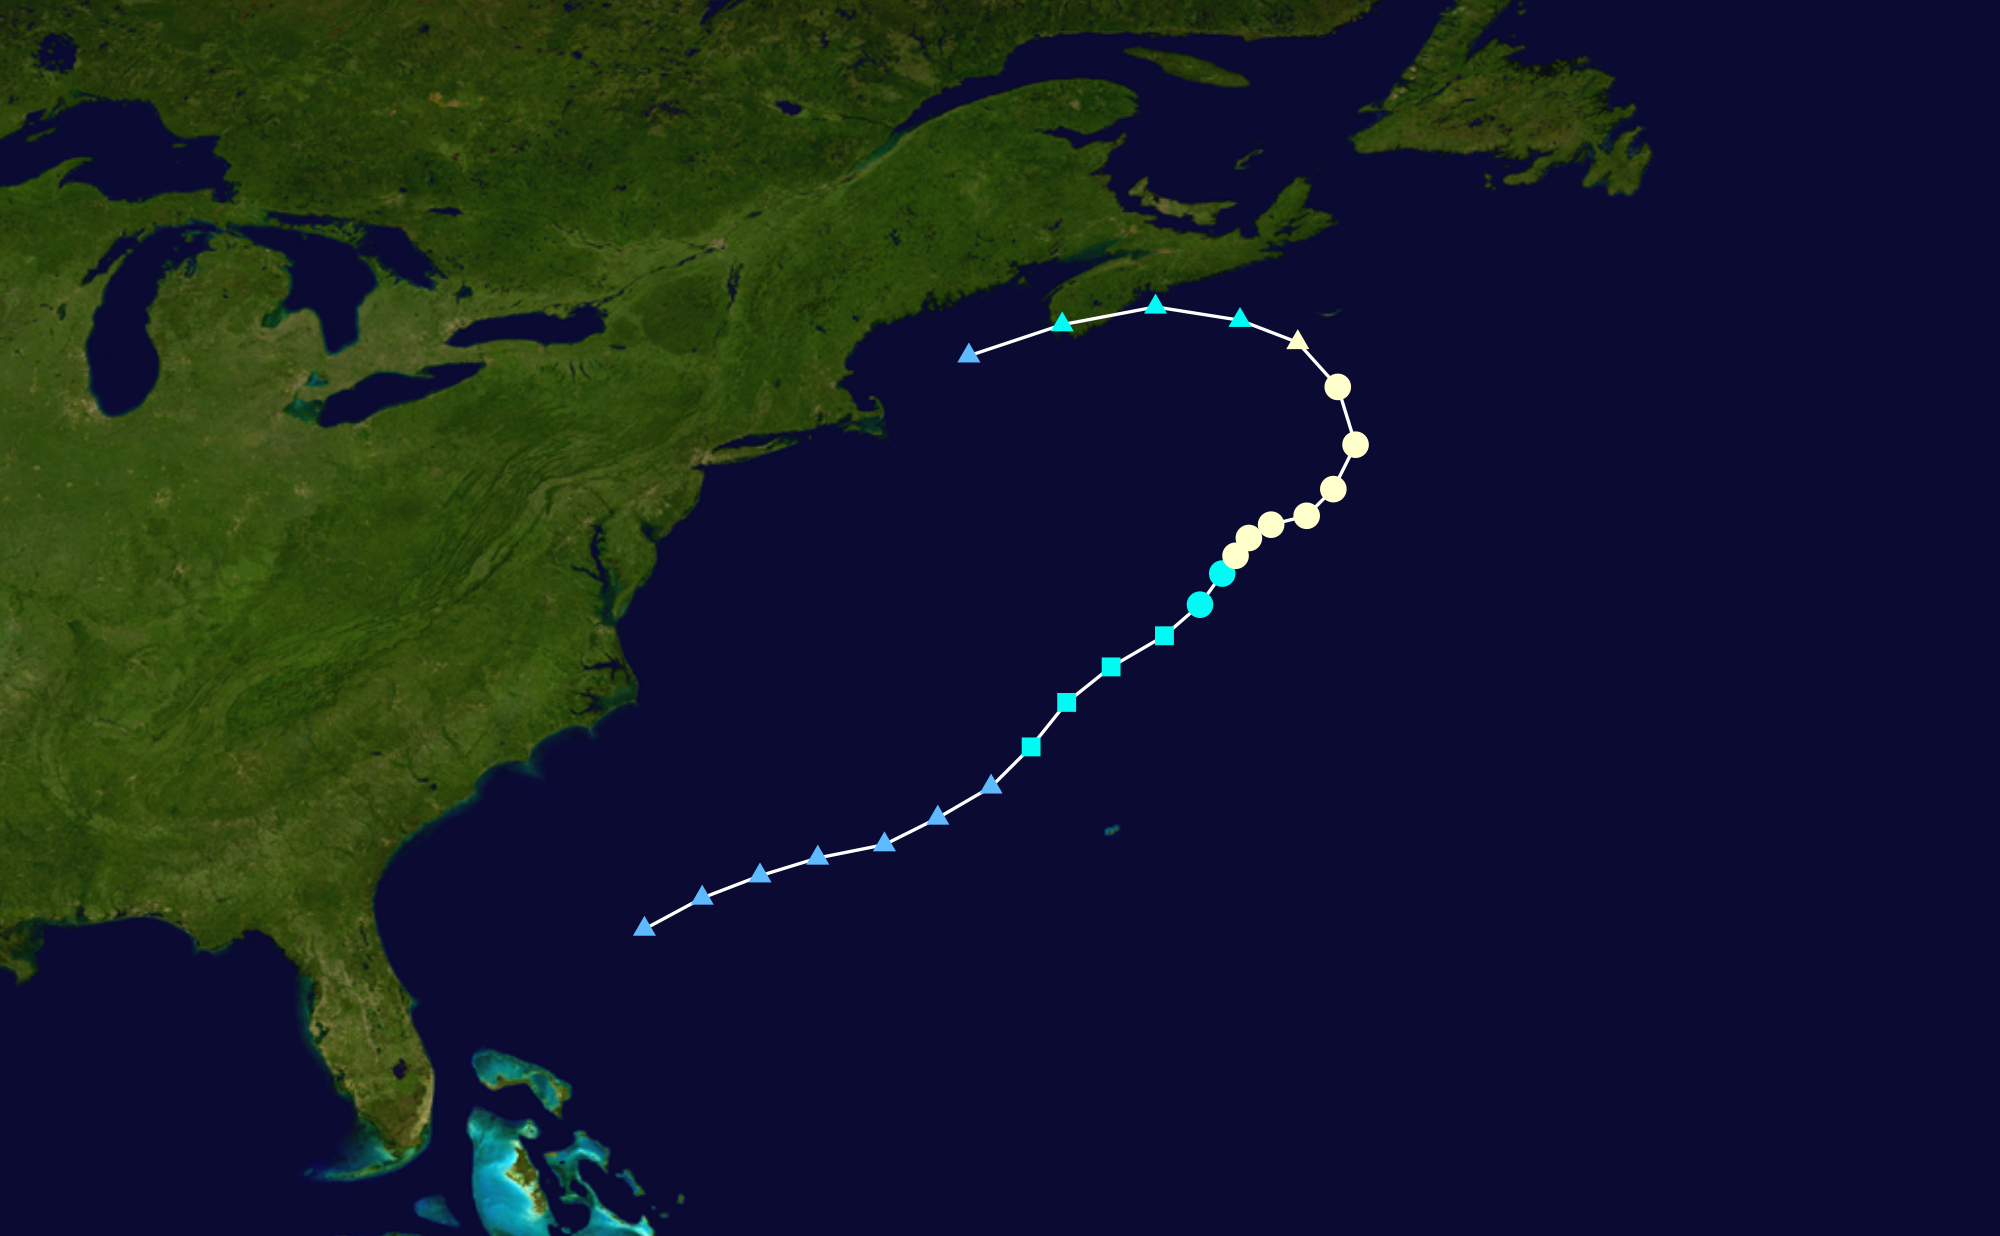
Hurricane Nina[]
| Category 2 hurricane (SSHWS) | |
  | |
| Duration | September 19 – September 26 |
|---|---|
| Peak intensity | 105 mph (165 km/h) (1-min) 968 mbar (hPa) |
Tropical wave
Hurricane Owen[]
| Category 4 hurricane (SSHWS) | |
  | |
| Duration | September 25 – October 10 |
|---|---|
| Peak intensity | 155 mph (250 km/h) (1-min) 925 mbar (hPa) |
A strong tropical wave merged from the coast of West Africa on late September 23. The next day, the wave soon became better organized and an air force reconnaissance aircraft investigated the wave, reporting that a closed cirrculation and low, vertical wind shear were defined. The wave was upgraded to Tropical Depression Fifteen at 1200 UTC on September 25 to the southeast of the Cape Verde Islands. The tropical depression quickly became better organized and was upgraded to Tropical Storm Owen at 1800 UTC. According to satellite imagery, forecasters predicted that Owen would steadily move westward and would be become a hurricane in less than 2 days. The tropical storm strengthen from an increase of low dry air on September 26 at 1200 UTC. With sustained winds of 60 mph (95 km/h), Owen entered an unsettling enviroment, causing it to meader around the Cape Verde Islands. 6 hours later, Owen dropped in windspeed and became a low-end tropical storm. However, low wind shear was monitored from the northeast of the system, and the tropical storm strengthened and became better organized. The tropical storm started to experience deep convection, when it instensified into a Category 1 hurricane. Explosive intensification soon took place in Owen's center and the hurricane dropped 38 hPa (1.12 inHg) in just 72 hours. Further instenifying was steady and Owen remained a Category 4 hurricane, at a consistant pace. A warmer environment contributed to Owen having a strong potential to become Category 5 hurricane status. However, on October 1, the chances were slim due to unbalanced convection currents west of the hurricane. Nevertheless, Owen peaked at its intensity of 155 mph (250 km/h), 922 hPa (27.23 inHg) on October 1 at 1800 UTC. The powerful hurricane remained Category 4 status for a total of 120 hours.
Widespread destruction was reported throughout the Cape Verde Islands with mininal damages. The United States East Coast was struck with strong winds and high surf. 1 person died on the Outer Banks, Carolina. Only $10 million USD was totaled in damages.
Hurricane Pippa[]
| Category 1 hurricane (SSHWS) | |
  | |
| Duration | September 30 – October 3 |
|---|---|
| Peak intensity | 85 mph (140 km/h) (1-min) 995 mbar (hPa) |
Originally a tropical storm, but was reclassified as a Category 1 hurricane in post-analysis
Tropical Storm Russell[]
| Tropical storm (SSHWS) | |
  | |
| Duration | September 30 – October 4 |
|---|---|
| Peak intensity | 60 mph (95 km/h) (1-min) 1001 mbar (hPa) |
Disturbed low pressure
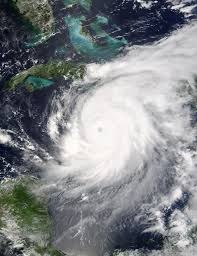
Hurricane Sonya[]
| Category 5 hurricane (SSHWS) | |
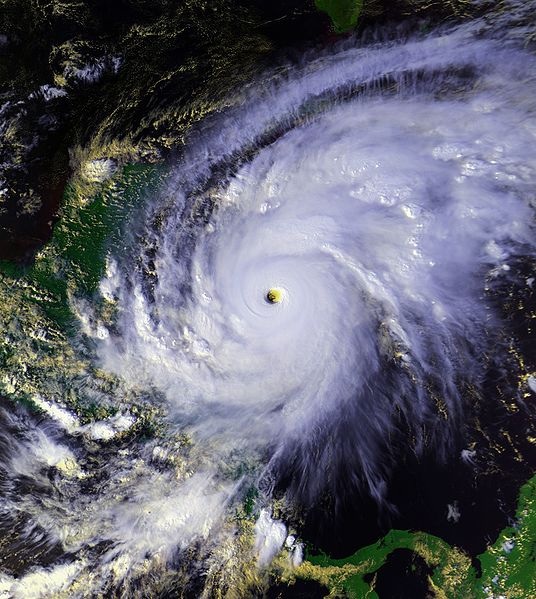  | |
| Duration | September 30 – October 17 |
|---|---|
| Peak intensity | 180 mph (285 km/h) (1-min) 900 mbar (hPa) |
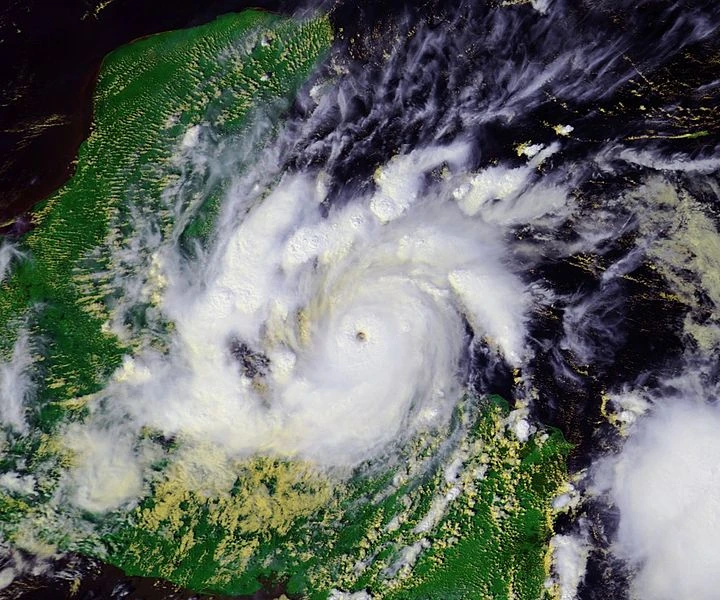
Hurricane Sonya was a catastrophic tropical cyclone that stalled over the Yucatan Peninsula for nearly 4 days, resulting in almost 10,000 deaths, making it the third deadliest Atlantic hurricane, only behind Hurricane Mitch in 1998 and the 1780 hurricane.
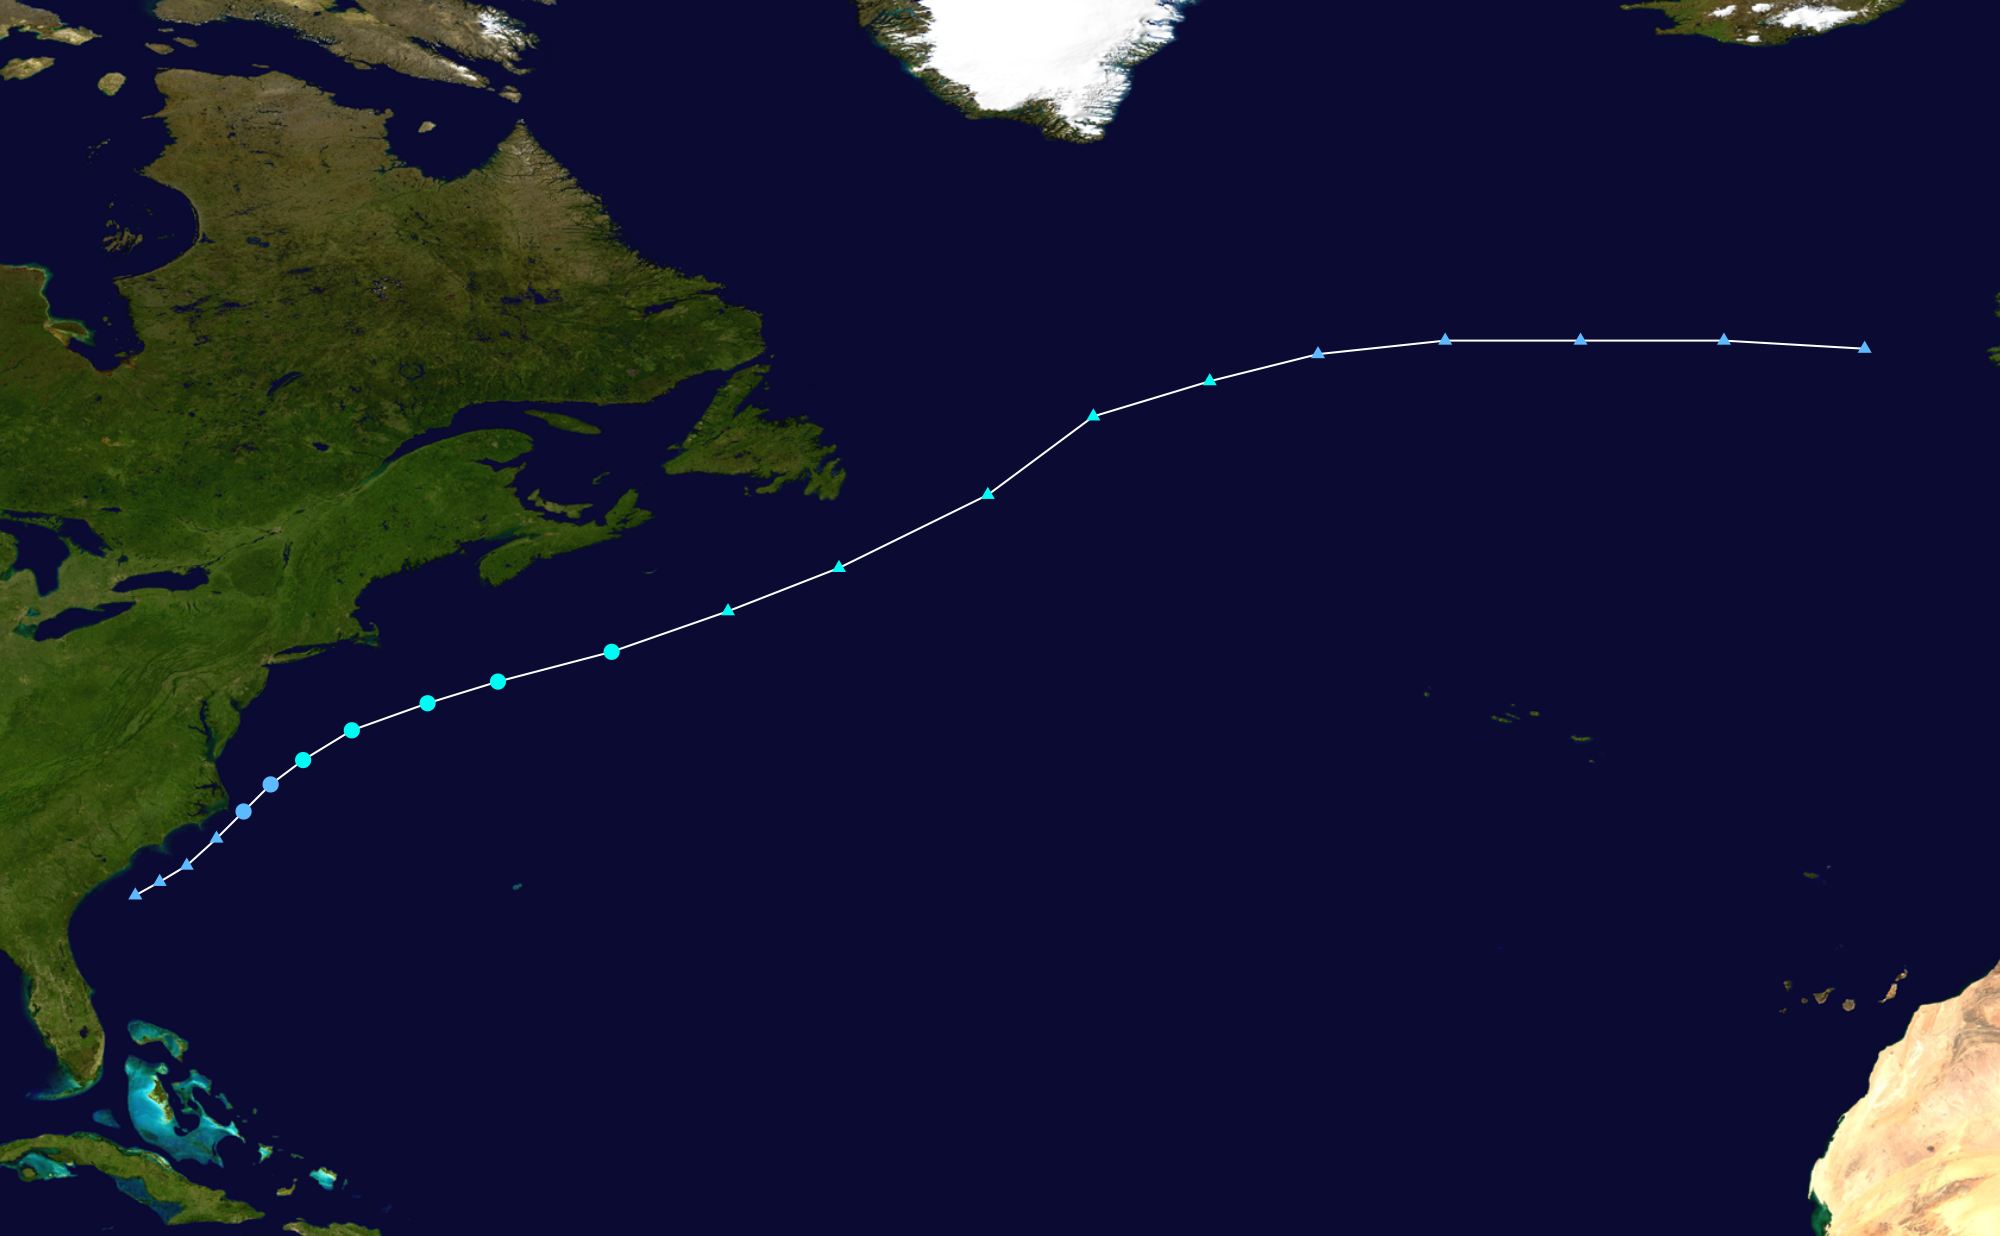
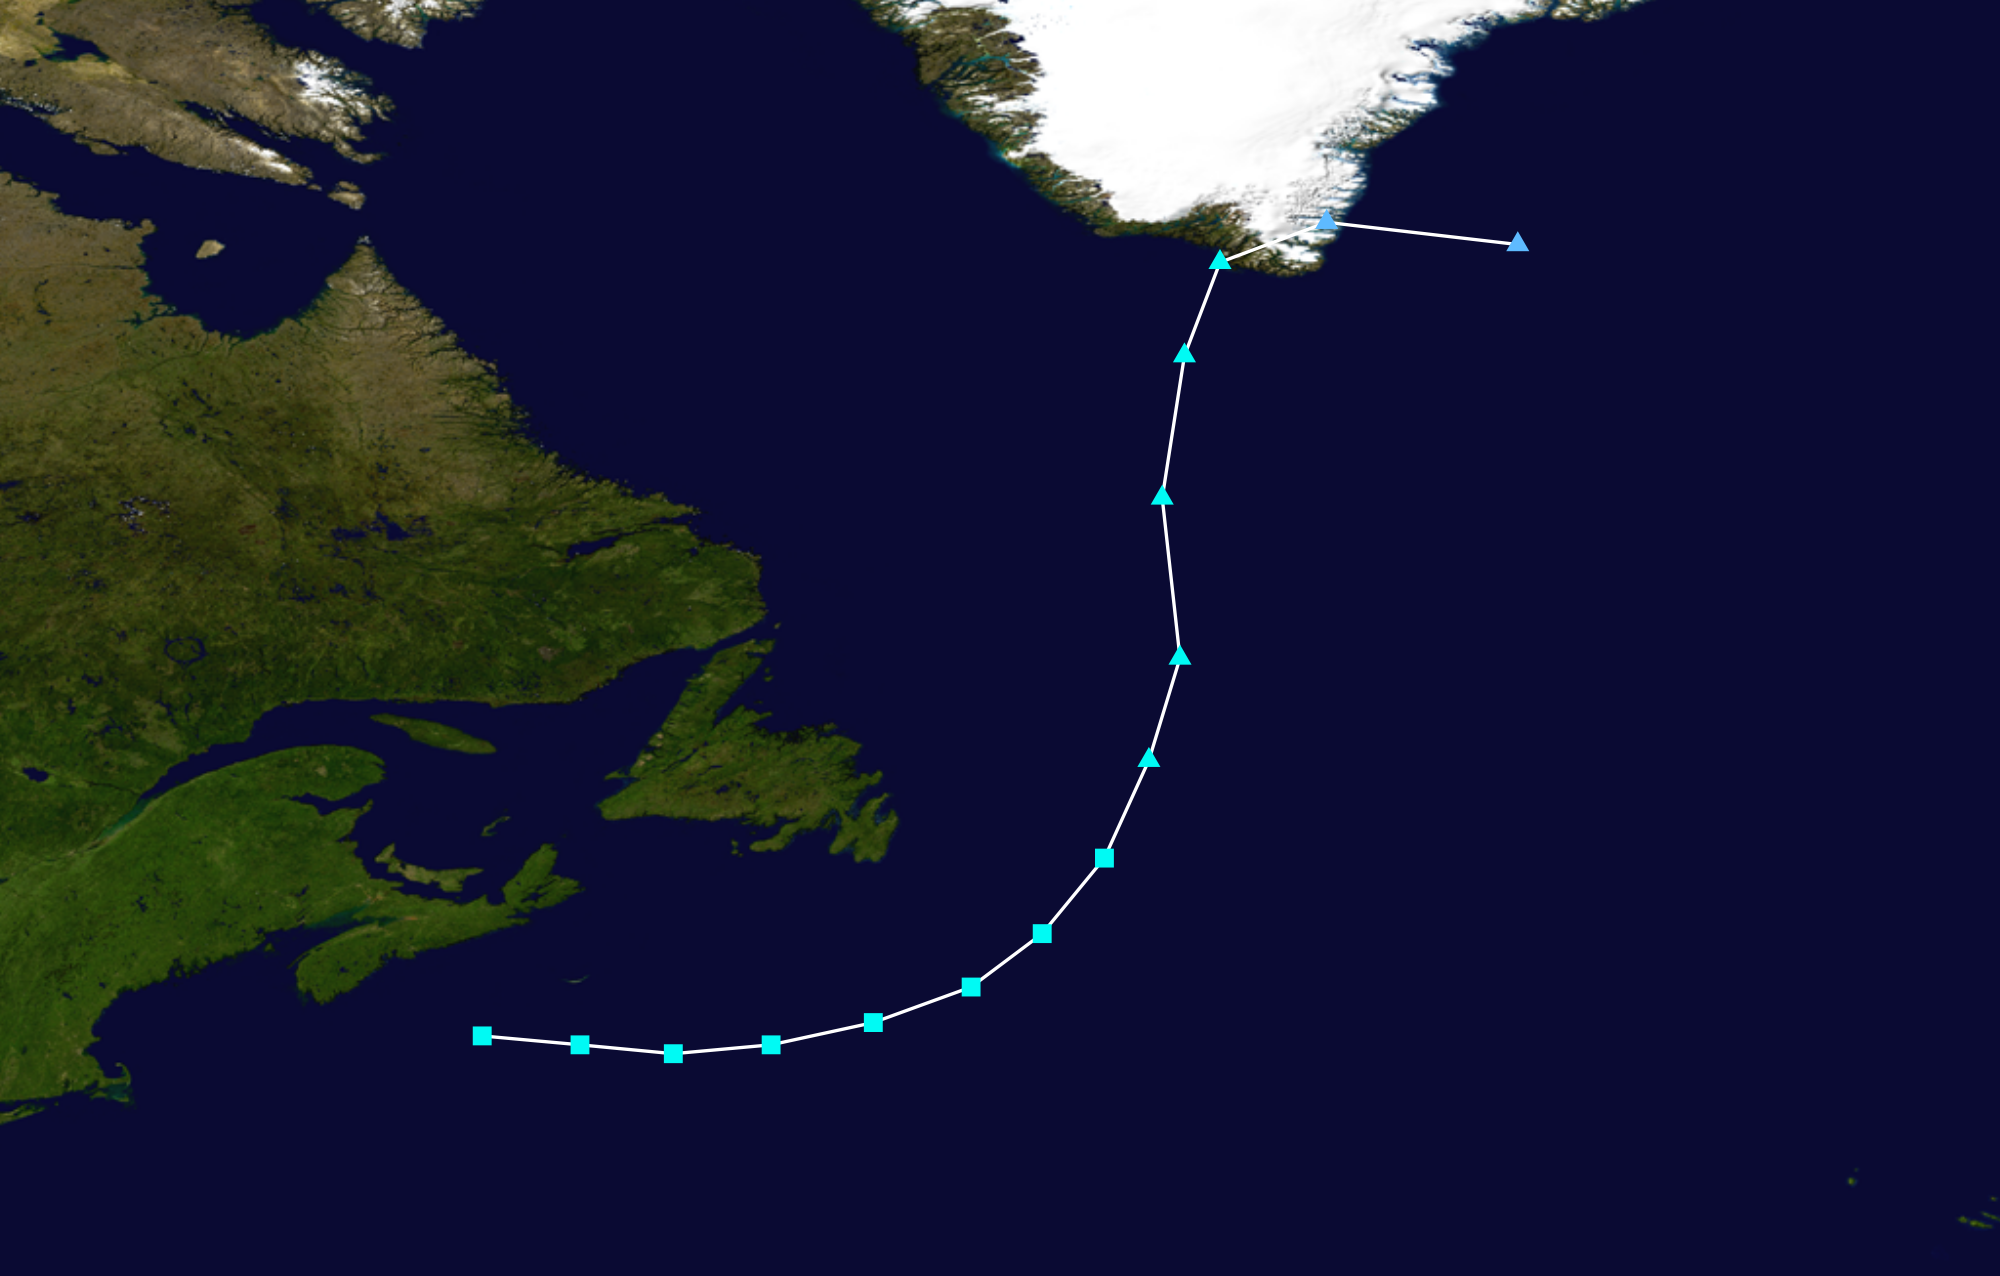
Hurricane Tyrone[]
| Category 1 hurricane (SSHWS) | |
  | |
| Duration | October 3 – October 9 |
|---|---|
| Peak intensity | 85 mph (140 km/h) (1-min) 982 mbar (hPa) |
Hurricane Tyrone (2023)
A low pressure system forms in the Atlantic Ocean and becomes a tropical depression on October 3. It continues to strengthen making no threat to land. In post analysis, meteorologists found that the remnants of Tyrone were expected to make landfall to Greenland. This would have been one out the two occurences that year.
Tropical Depression Twenty-One[]
| Tropical depression (SSHWS) | |
  | |
| Duration | October 5 – October 6 |
|---|---|
| Peak intensity | 30 mph (45 km/h) (1-min) 1005 mbar (hPa) |
Hurricane Vega[]
| Category 1 hurricane (SSHWS) | |
  | |
| Duration | October 9 – October 13 |
|---|---|
| Peak intensity | 80 mph (130 km/h) (1-min) 989 mbar (hPa) |
Surfa
Great Britain Wind Storm (Weston)[]
| Tropical storm (SSHWS) | |
  | |
| Duration | October 15 – October 16 |
|---|---|
| Peak intensity | 40 mph (65 km/h) (1-min) 1009 mbar (hPa) |
In the morning hours of October 15, NHC began observing an extremely rare frontal low forming of the coast of France, in the Bay of Biscay. Later in the day, advisories were soon issued for a very small depression that would soon make minor impact on the British Isles. This began making new records for highest latitude for a storm to form on.
Hurricane Alpha[]
| Category 1 hurricane (SSHWS) | |
  | |
| Duration | October 19 – October 24 |
|---|---|
| Peak intensity | 75 mph (120 km/h) (1-min) 989 mbar (hPa) |
Tropical wave
Hurricane Beta[]
| Category 3 hurricane (SSHWS) | |
  | |
| Duration | October 25 – November 4 |
|---|---|
| Peak intensity | 115 mph (185 km/h) (1-min) 960 mbar (hPa) |
Tropical wave
Hurricane Gamma[]
| Category 1 hurricane (SSHWS) | |
  | |
| Duration | October 30 – November 2 |
|---|---|
| Peak intensity | 85 mph (140 km/h) (1-min) 982 mbar (hPa) |
Mesozoic low
Tropical Depression Twenty-Seven[]
| Tropical depression (SSHWS) | |
  | |
| Duration | November 5 – November 7 |
|---|---|
| Peak intensity | 35 mph (55 km/h) (1-min) 1007 mbar (hPa) |
Frontal low Degenerated into a remnant low before entering the Gulf of Mexico. The remnants later split into trough that spawned a new area of low pressure which moved rapidly northeast and developed into a nor'easter.
Subtropical Depression Twenty-Eight[]
| Subtropical depression (SSHWS) | |
  | |
| Duration | November 10 – November 11 |
|---|---|
| Peak intensity | 35 mph (55 km/h) (1-min) 999 mbar (hPa) |
Weakening ridge Absorbed into the nor'easter that developed from the trough associated with Tropical Depression Twenty-Seven
Tropical Storm Delta[]
| Tropical storm (SSHWS) | |
  | |
| Duration | November 13 – November 16 |
|---|---|
| Peak intensity | 50 mph (85 km/h) (1-min) 998 mbar (hPa) |
Tropical wave
Tropical Storm Epsilon[]
| Tropical storm (SSHWS) | |
  | |
| Duration | November 15 – November 18 |
|---|---|
| Peak intensity | 60 mph (95 km/h) (1-min) 998 mbar (hPa) |
Upper level low
Hurricane Zeta[]
| Category 5 hurricane (SSHWS) | |
  | |
| Duration | November 20 – December 5 |
|---|---|
| Peak intensity | 175 mph (280 km/h) (1-min) 905 mbar (hPa) |
Tropical wave
Hurricane Eta[]
| Category 1 hurricane (SSHWS) | |
  | |
| Duration | November 29 – December 6 |
|---|---|
| Peak intensity | 75 mph (120 km/h) (1-min) 991 mbar (hPa) |
Non-tropical area of low The remnants of Eta continued northeast toward Mid US and Eastern Canada bringing significant rain and snowfall to many areas.
Tropical Depression Thirty-Three[]
| Tropical depression (SSHWS) | |
 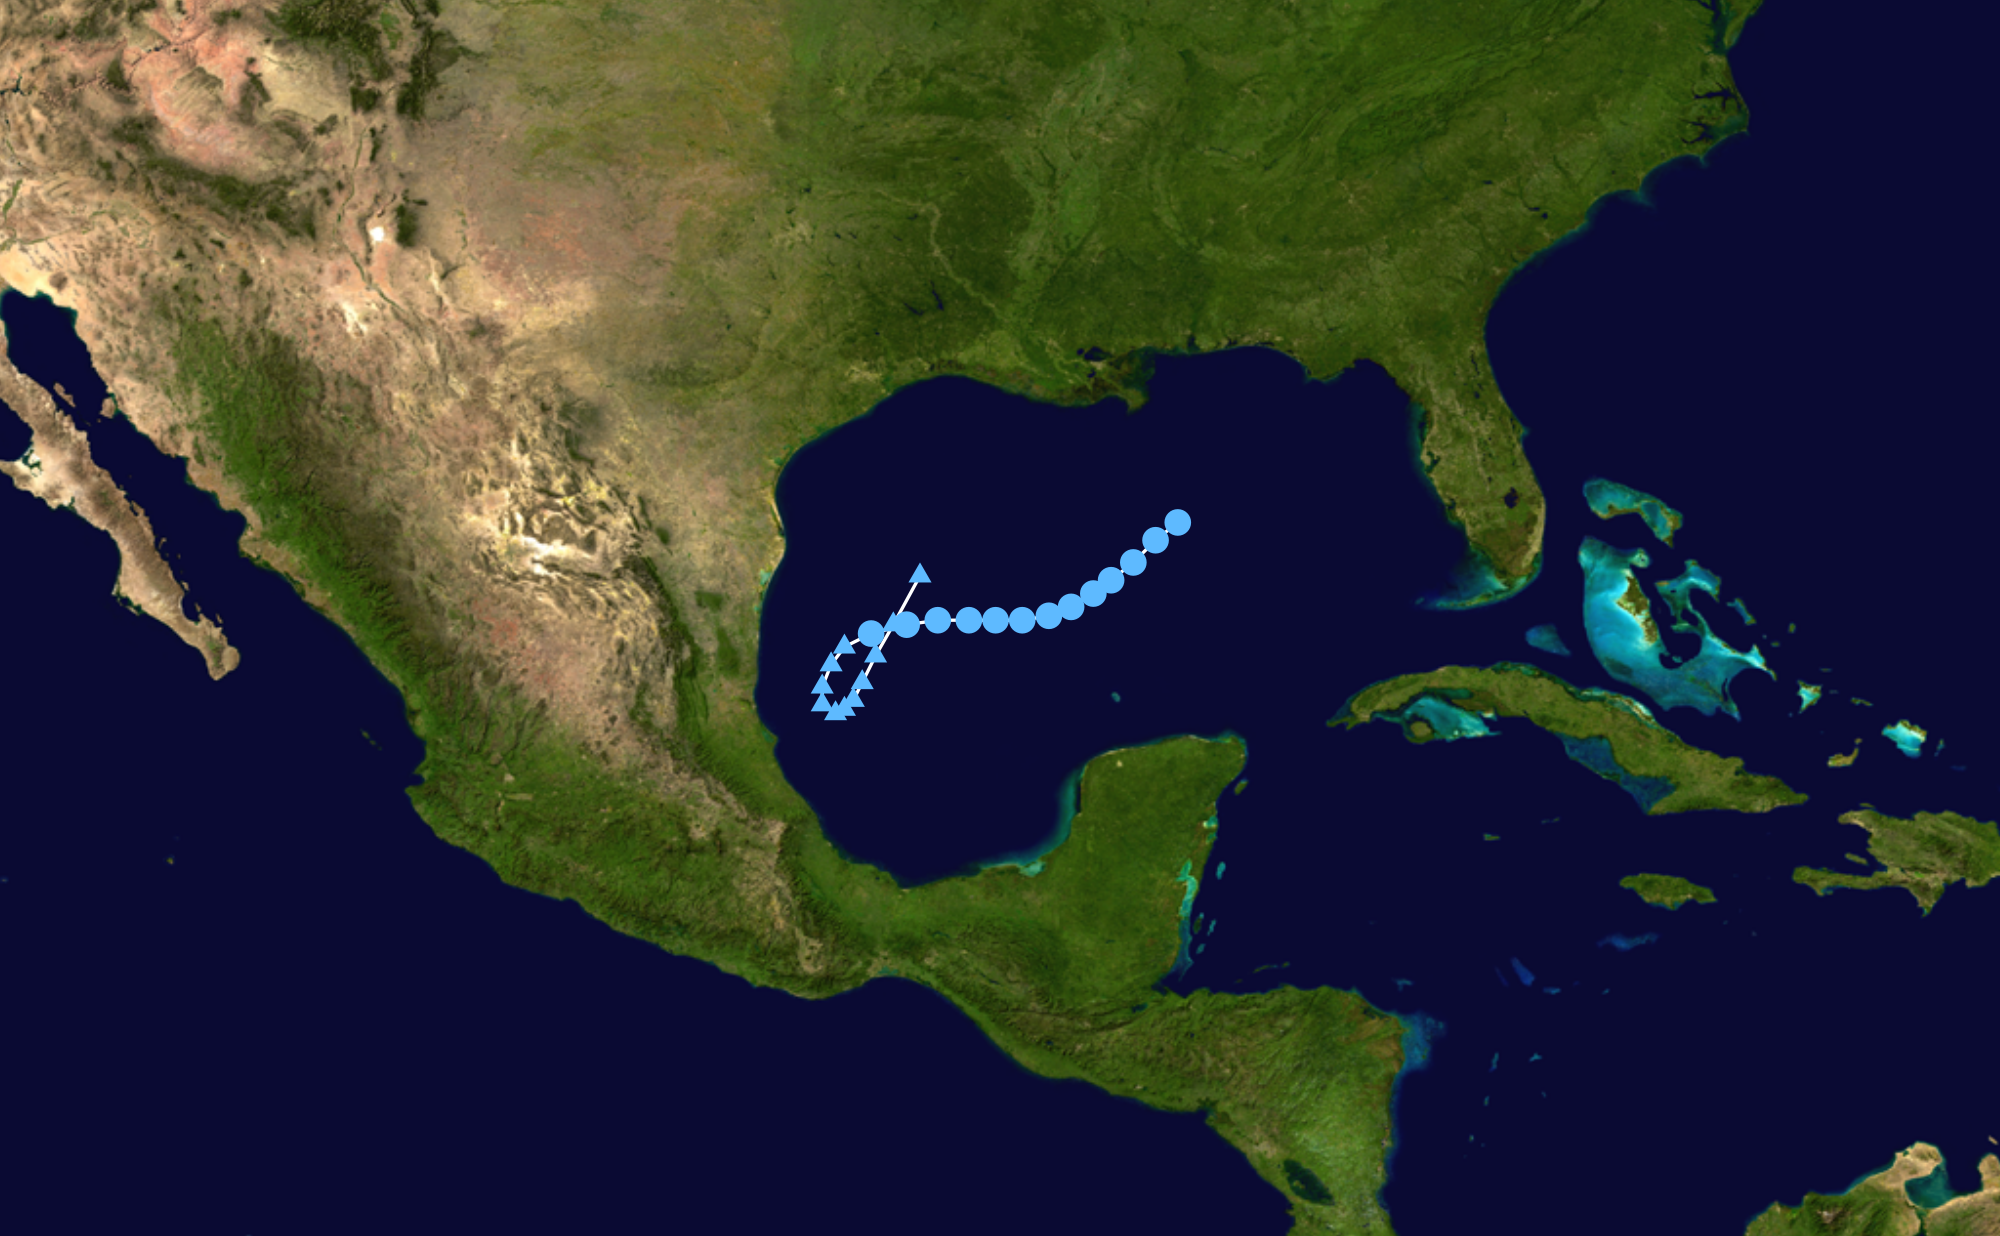 | |
| Duration | December 5 – December 8 |
|---|---|
| Peak intensity | 35 mph (55 km/h) (1-min) 1000 mbar (hPa) |
An outflow boundary formed a few hundred miles south of Louisiana. The low moved south then looped before forming into a tropical depression. The track of the system was very different from those that formed in the Gulf of Mexico. The depression was expected to loop one more time before dissipating over Louisiana. However, a ridge associated with a strong low pressure caused the system to slow and move east then northeastward. Losing characteristics from being absorbed by the ridge, the system dissipated in the middle of the Gulf and the strengthening system would move inland causing major flooding to the Mid United States and the Great Lakes Region.
Subtropical Storm Theta[]
| Subtropical storm (SSHWS) | |
  | |
| Duration | December 9 – December 13 |
|---|---|
| Peak intensity | 70 mph (110 km/h) (1-min) 975 mbar (hPa) |
A far north upper-level low and a surface low pressure system formed on December 9 as a subtropical cyclone with sustained winds of 70 mph, receiving the name Theta. The system was very rare, as it is the only system to form as a high-end tropical or subtropical cyclone at a high latitude and it was also a very late forming system, latest since Tropical Storm Zeta of 2005. The system moved east away from the Maritime provinces at a fast moving pace. Theta remained limited from changing wind speeds, causing high storm surge in Nova Scotia and Newfoundland. Only one person was injured during this time on December 10. Record breaking snowfall and rainfall amounts were archived throughout December 9–12. At least 500 mm of rain was recorded in St. John's, Newfoundland, and 2.6 m of snow fell in areas, such as Sydney, Nova Scotia, surrounding Theta's starting path. On December 11, Theta began to move northward, and started to loose steam. On December 13, the system became extratropical and still remained on its journey north. The remnants of Theta were felt throughout southwestern Greenland, Ireland, and The Netherlands. Only C$2 million worth of damages and no deaths were recorded and season had finally came to a finishing relief.
Storm names and retirement[]
The following names were used to name storms that reached tropical or subtropical storm intensity in the North Atlantic Ocean during 2023. This list was used for the first time since the original name lists were replaced. This name list had all its names, along with 8 Greek Alphabet names used during the season.
|
|
|
|
|
|
Due to the amount of damages, deaths and/or rare activity caused, the names "Chester", "Iron", "Jemima", "Owen", "Sonya", and "Weston" were removed from List 4 of the rotating cyclones lists. The names were replaced with Cameron, Ignatius, Jordon, Namina, Oden, Shannon, and Wilson. However, the names Grant and Nina, were not retired. Despite causing a lot of damage to the Greater Antilles and Central America, the two storms formed in or around the Caribbean Sea, which had a remarkable increase in activity over a 10 year period. This resulting in no retirement.
On the names list below, names in bold represent that the names that were replaced
|
|
|
Hurricanes Beta and Zeta caused a lot of damage, caused some deaths, and formed at a high hurricane strength at a certain time. Unfortuately, they cannot be retired or replaced by another name since they are Greek Alphabet names and there is lack of replacement.
Season effects[]
This is a table of the storms and their effects in the 2023 Atlantic hurricane season. This table includes the storm's names, duration, peak intensity, Areas affected (bold indicates made landfall in that region at least once), damages, and death totals. Deaths in parentheses are additional and indirect (an example of an indirect death would be a traffic accident), but are still storm-related. Damage and deaths include totals while the storm was extratropical, a wave or a low. All of the damage figures are in 2023 USD (the listed damage figure is in millions).
| Saffir–Simpson hurricane wind scale | ||||||
| TD | TS | C1 | C2 | C3 | C4 | C5 |
| Storm name |
Dates active | Storm category at peak intensity |
Max 1-min wind mph (km/h) |
Min. press. (mbar) |
Areas affected | Damage (USD) |
Deaths
| |||
|---|---|---|---|---|---|---|---|---|---|---|
| Unnamed | May 2 – 5 | Subtropical storm | 60 (95) | 994 | Eastern Canada | 0.758 | 4 (1) | |||
| Alec | July 17 – 21 | Category 1 tropical cyclone | 80 (130) | 987 | Nicaragua, Honduras, Mexico | 1.5 | 7 | |||
| Bessie | July 19 – 21 | Tropical storm | 40 (65) | 1005 | Bahamas, Southeastern United States, Bermuda | Minimal | 1(1) | |||
| Chester | July 31 – August 11 | Category 5 tropical cyclone | 160 (260) | 913 | Windward Islands, Virgin Islands, Hispaniola , Cuba, Yucatan Peninsula, Quintana Roo, Texas, Oklahoma, Kansas, Missouri | ≥4200 | 82 (130) | |||
| Deena | August 2 – 10 | Category 4 tropical cyclone | 150 (240) | 937 | US East Coast | Minimal | None) | |||
| Edie | August 14 – 17 | Tropical storm | 60 (95) | 997 | Southeastern United States, Atlantic Canada | 0.02 | None | |||
| Fredine | August 15 – 17 | Tropical storm | 60 (95) | 1000 | Eastern United States, Atlantic Canada, Ireland | None | None | |||
| Fredine | August 15 – 17 | Tropical storm | 60 (95) | 1000 | Eastern United States (Florida), Atlantic Canada, Ireland | None | None | |||
| Grant | August 23 – 30 | Category 2 tropical cyclone | 100 (155) | 962 | Windward Islands, Puerto Rico, Dominican Republic,Turks and Caicos, The Bahamas, South Atlantic States, Northeastern United States, Eastern Canada, Europe | 900 | 23 (7) | |||
| Hana | August 24 – 28 | Category 2 tropical cyclone | 65 (100) | 995 | Anguilla, British Virgin Islands, Turks and Caicos, Bermuda | Minimal | None | |||
| Iron | August 31 – September 21 | Category 5 tropical cyclone | 200 (325) | 867 | Southern Liberia,Lesser Antilles, Virgin Islands, Puerto Rico, Hispaniola, Jamaica, Cuba, Quintana Roo, Yucatan Peninsula, Southeastern United States, The Bahamas, Bermuda, Eastern Canada, Azores, Western Europe, Northern Africa, Arabian Peninsula | ≥190000 | ~7,960 (10,308) | |||
| Jemina | September 3 – 12 | Category 3 tropical cyclone | 120 (195) | 950 | Carolinas, Ohio Valley, Southern Ontario, Quebec | 3700 | 18 (2) | |||
| Kenny | September 7 – 13 | Category 1 tropical cyclone | 80 (130) | 983 | Yucatan Peninsula, Southern United States (Louisiana, Florida) Bermuda, Ireland, Great Britain, Faroe Islands | None | None | |||
| Lilli | September 10 – 14 | Category 1 tropical cyclone | 90 (150) | 976 | Trinidad and Tobago, Northern Venezuela | 500 | 870 | |||
| Mike | September 15 – 19 | Category 2 tropical cyclone | 105 (165) | 965 | Azores | Minimal | None | |||
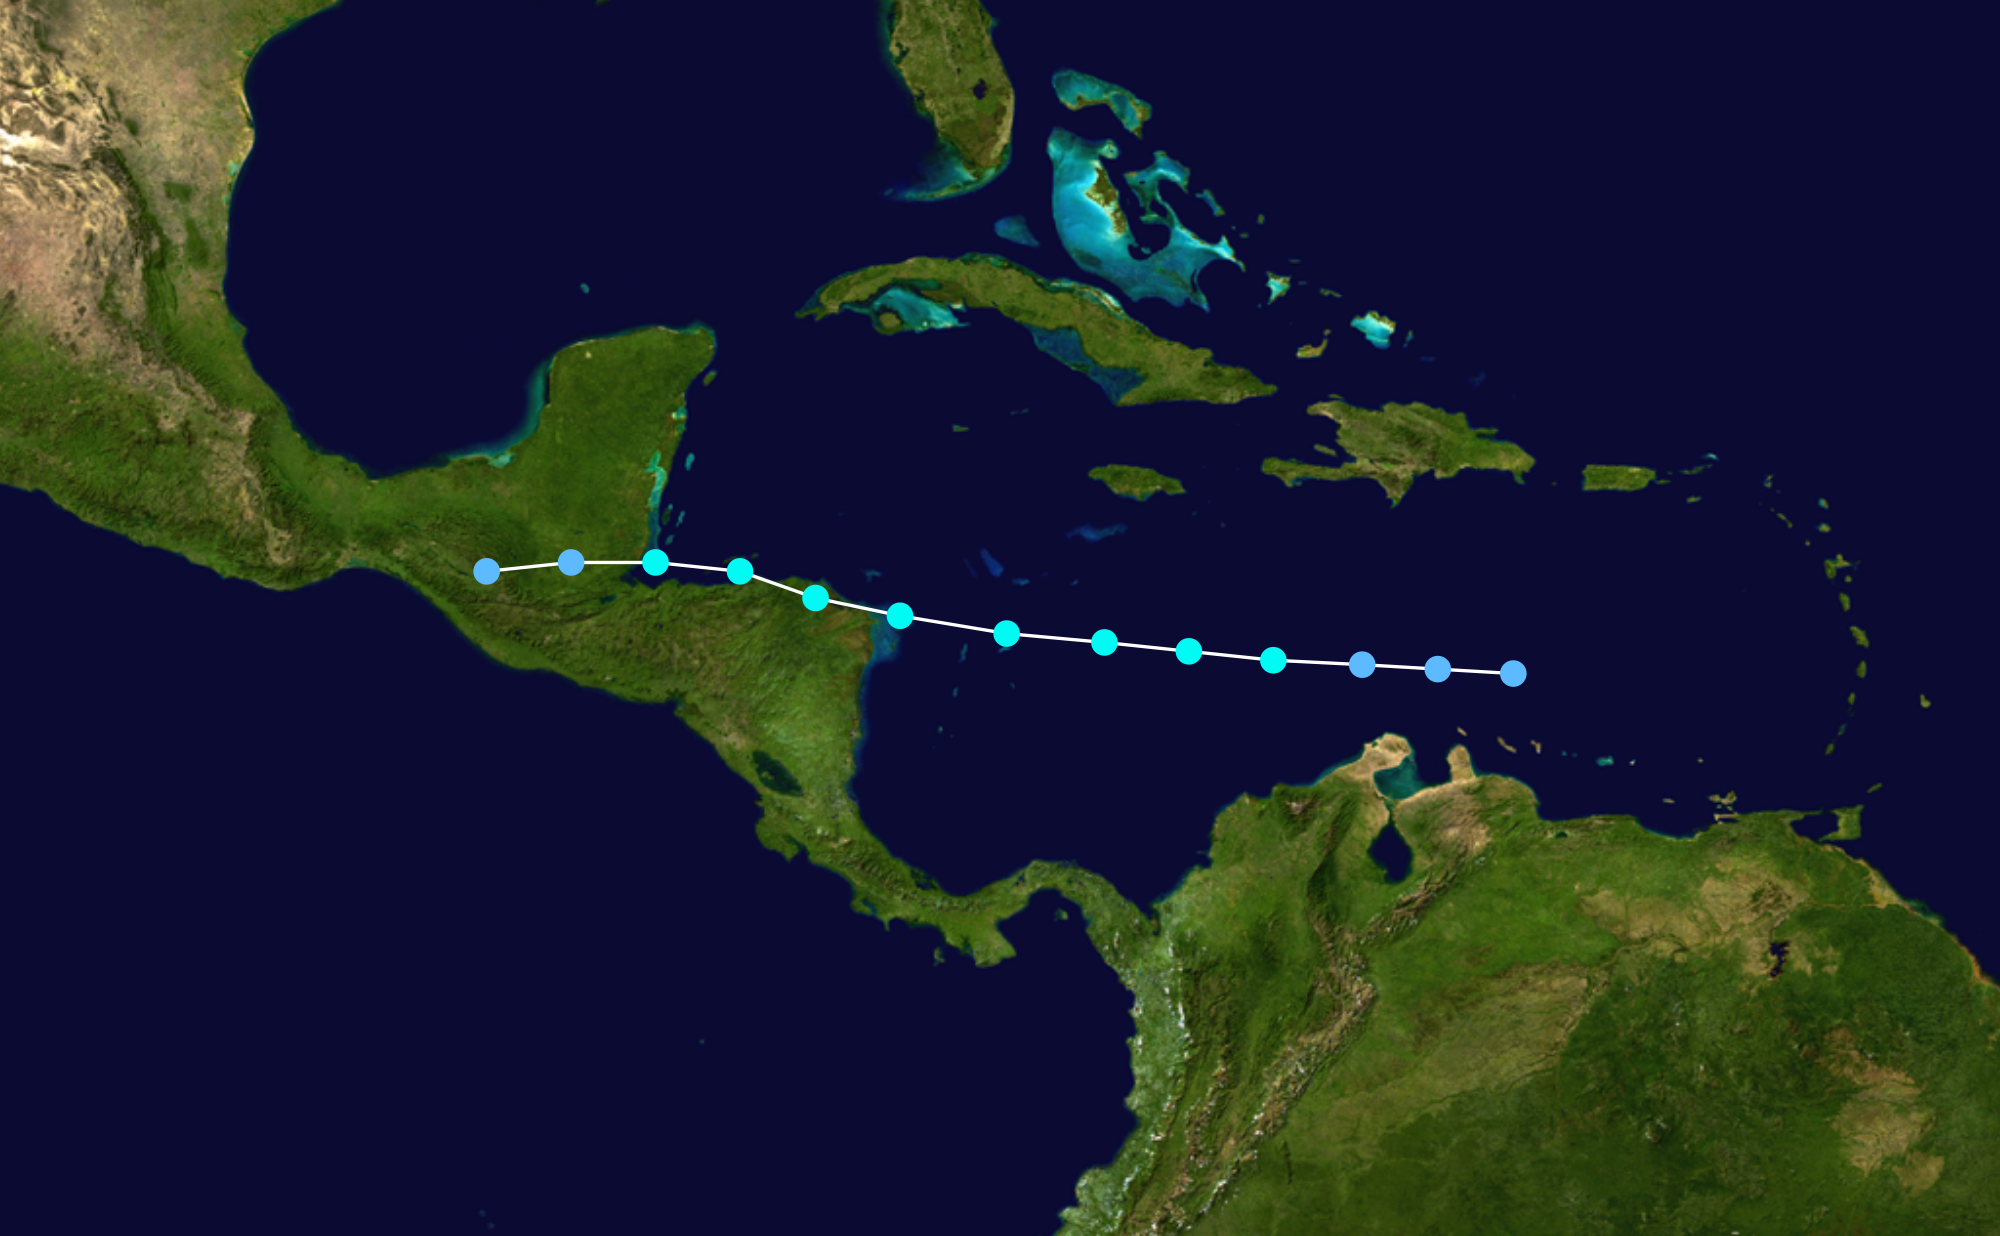
| Nina | September 19 – 26 | Category 2 tropical cyclone | 105 (165) | 968 | Lesser Antilles, Belize, Southern Mexico | 1100 | 345 (278) | |||
| Owen | September 25 – October 10 | Category 4 tropical cyclone | 155 (250) | 925 | Cape Verde Islands, US East Coast, Newfoundland, Greenland, Europe | 872.5 | 5 | |||
| Pippa | September 30 – October 4 | Category 1 tropical cyclone | 85 (140) | 995 | Mexico, Texas | Minimal | None | |||
| Russell | September 30 – October 3 | Tropical storm | 60 (95) | 1001 | Central America (Nicaragua, Honduras, Belize), Mexico | None | None | |||
| Sonya | October 1 – 16 | Category 5 tropical cyclone | 180 (285) | 900 | Trinidad and Tobago, Grenada, Northern Venezuela, Aruba, Curaco, Colombia, Central America, Mexico, West Cuba, Bahamas, Eastern United States, Eastern Canada, Northern Canada | 30000 | 4,523 (5,130) | |||
| Tyrone | October 3 – 8 | Category 1 tropical cyclone | 85 (140) | 982 | None | None | None | |||
| Twenty-One | October 5 – 7 | Tropical depression | 30 (45) | 1005 | US East Coast, Atlantic Canada | 0.2 | 4 | |||
| Vega | October 9 – 13 | Category 1 tropical cyclone | 80 (130) | 989 | Turks and Caicos, Northeastern United States, Eastern Canada | 30 | 7 | |||
| Weston | October 15 – 16 | Tropical storm | 40 (65) | 1009 | Portugal, British Isles (Wales, England), Northern France | 0.995 | None | |||
| Alpha | October 19 – 23 | Category 1 tropical cyclone | 75 (120) | 989 | None | None | None | |||
| Beta | October 25 – November 5 | Category 3 tropical cyclone | 115 (185) | 960 | Lesser Antilles, Mexico, Central America | 950 | 78 (13) | |||
| Gamma | October 30 – November 2 | Category 3 tropical cyclone | 85 (140) | 982 | Nova Scotia, New Brunswick, Maine | 2 | None | |||
| Twenty-Seven | November 5 – 7 | Tropical depression | 35 (55) | 1007 | Honduras, Nicaragua, Cuba | Minimal | 3 | |||
| Twenty-Eight | November 10 – 11 | Tropical depression | 35 (55) | 999 | Mid-Atlantic States | Minimal | None | |||
| Delta | November 13 – 16 | Tropical storm | 50 (85) | 998 | Lesser Antilles, Puerto Rico, Azores, Ireland, Scotland, Iceland | 80 | 45 (3) | |||
| Epsilon | November 15 – 18 | Tropical storm | 60 (95) | 998 | Azores, Western Portugal, France | 4.78 | 3 | |||
| Zeta | November 20 – December 5 | Category 5 tropical cyclone | 175 (280) | 905 | Jamaica, Cuba, Haiti, Bahamas, Turks and Caicos, Bermuda, United States East Coast, Atlantic Canada, Iceland, Faroe Islands, Scandinavia | 10345.7 | 2,300 (1,621) | |||
| Eta | November 29 – December 6 | Category 1 tropical cyclone | 75 (120) | 991 | Southern United States (Louisiana, Mississippi), Ohio Valley, Great Lakes region | 20 | None | |||
| Thirty-Three | December 5 – 8 | Tropical depression | 35 (55) | 1000 | None | None | None | |||
| Theta | December 9 – 13 | Subtropical storm | 70 (110) | 975 | Canadian Maritimes, Western Greenland, British Isles, The Netherlands | 2 | None | |||
| Season aggregates | ||||||||||
| 34 systems | May 2 – December 13 | 200 (325) | 867 | ≥$248.348 billion | 16,289 (17,493) | |||||
Accumulated cyclone energy (ACE)[]
| ACE (104 kt2) – Storm: Source | |||||
|---|---|---|---|---|---|
| 1 | 81.0 | Iron | 16 | 4.28 | Alpha |
| 2 | 59.8 | Owen | 17 | 3.53 | Alec |
| 3 | 41.8 | Sonya | 18 | 3.39 | Eta |
| 4 | 35.1 | Zeta | 19 | 2.89 | Vega |
| 5 | 30.6 | Chester | 20 | 2.62 | Epsilon |
| 6 | 20.5 | Deena | 21 | 2.28 | Theta |
| 7 | 18.2 | Jemima | 22 | 1.84 | Edie |
| 8 | 11.6 | Grant | 23 | 1.86 | Hana |
| 9 | 9.65 | Beta | 24 | 1.79 | Unnamed |
| 10 | 7.73 | Nina | 25 | 1.54 | Delta |
| 11 | 7.04 | Tyrone | 26 | 1.46 | Pippa |
| 12 | 6.86 | Mike | 27 | 1.10 | Russell |
| 13 | 4.59 | Gamma | 28 | 0.985 | Fredine |
| 14 | 4.52 | Lilli | 29 | 0.49 | Bessie |
| 15 | 4.46 | Kenny | 30 | 0.443 | Weston |
| Total=373.9 (record) | |||||