The 2015 Atlantic hurricane season was a season which saw above average activity.
Storms[]
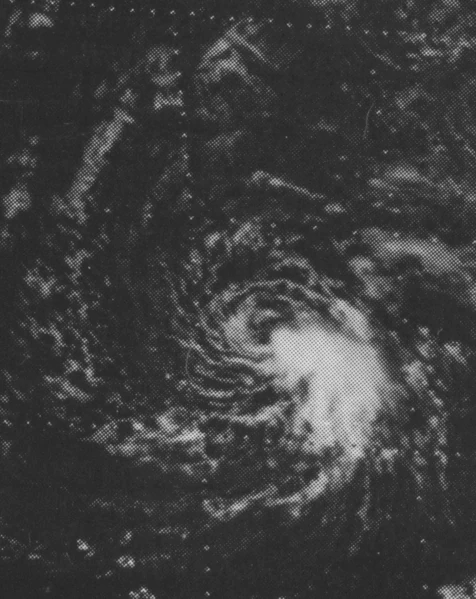
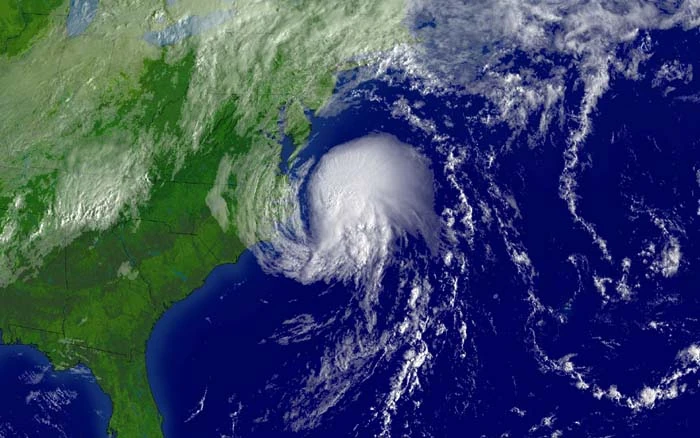
Hurricane Ana[]
| Category 1 hurricane (SSHWS) | |
  | |
| Duration | June 2 – June 7 |
|---|---|
| Peak intensity | 80 mph (130 km/h) (1-min) 984 mbar (hPa) |
Tropical Storm Bill[]
| Tropical storm (SSHWS) | |
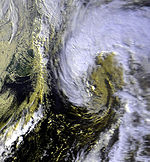  | |
| Duration | June 14 – June 18 |
|---|---|
| Peak intensity | 65 mph (100 km/h) (1-min) 990 mbar (hPa) |
Tropical Depression Three[]
| Tropical depression (SSHWS) | |
  | |
| Duration | June 27 – June 28 |
|---|---|
| Peak intensity | 35 mph (55 km/h) (1-min) 1004 mbar (hPa) |
Hurricane Claudette[]
| Category 2 hurricane (SSHWS) | |
  | |
| Duration | June 30 – July 6 |
|---|---|
| Peak intensity | 110 mph (175 km/h) (1-min) 958 mbar (hPa) |
Hurricane Danny[]
| Category 2 hurricane (SSHWS) | |
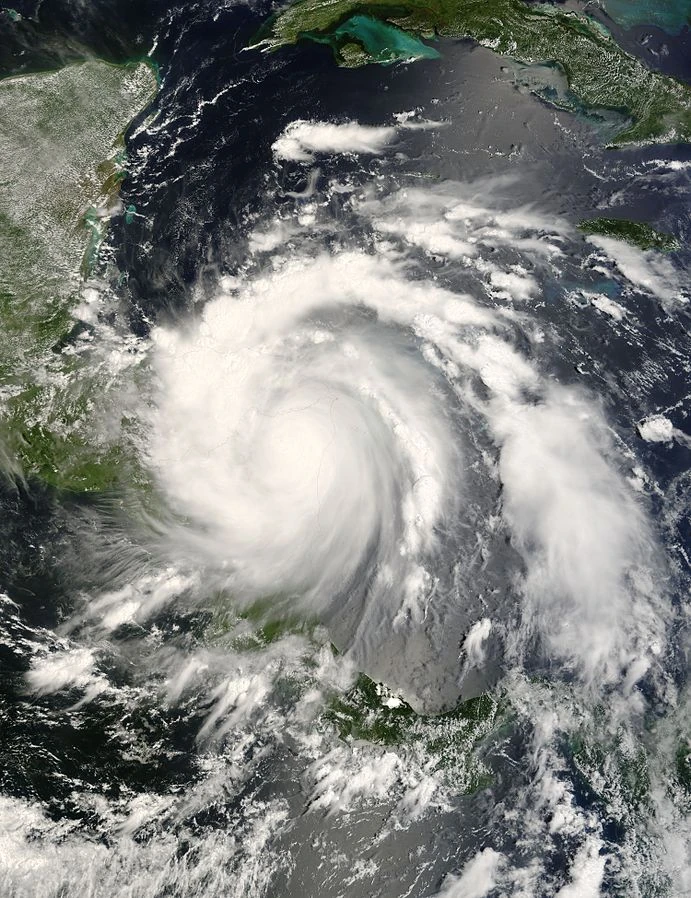  | |
| Duration | July 14 – July 20 |
|---|---|
| Peak intensity | 110 mph (175 km/h) (1-min) 959 mbar (hPa) |
Hurricane Erika[]
| Category 5 hurricane (SSHWS) | |
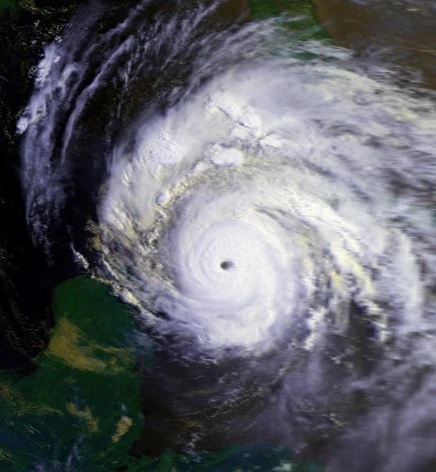  | |
| Duration | July 20 – August 1 |
|---|---|
| Peak intensity | 165 mph (270 km/h) (1-min) 913 mbar (hPa) |
Hurricane Fred[]
| Category 4 hurricane (SSHWS) | |
  | |
| Duration | July 24 – August 2 |
|---|---|
| Peak intensity | 135 mph (215 km/h) (1-min) 946 mbar (hPa) |
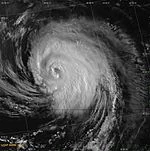
Hurricane Grace[]
| Category 1 hurricane (SSHWS) | |
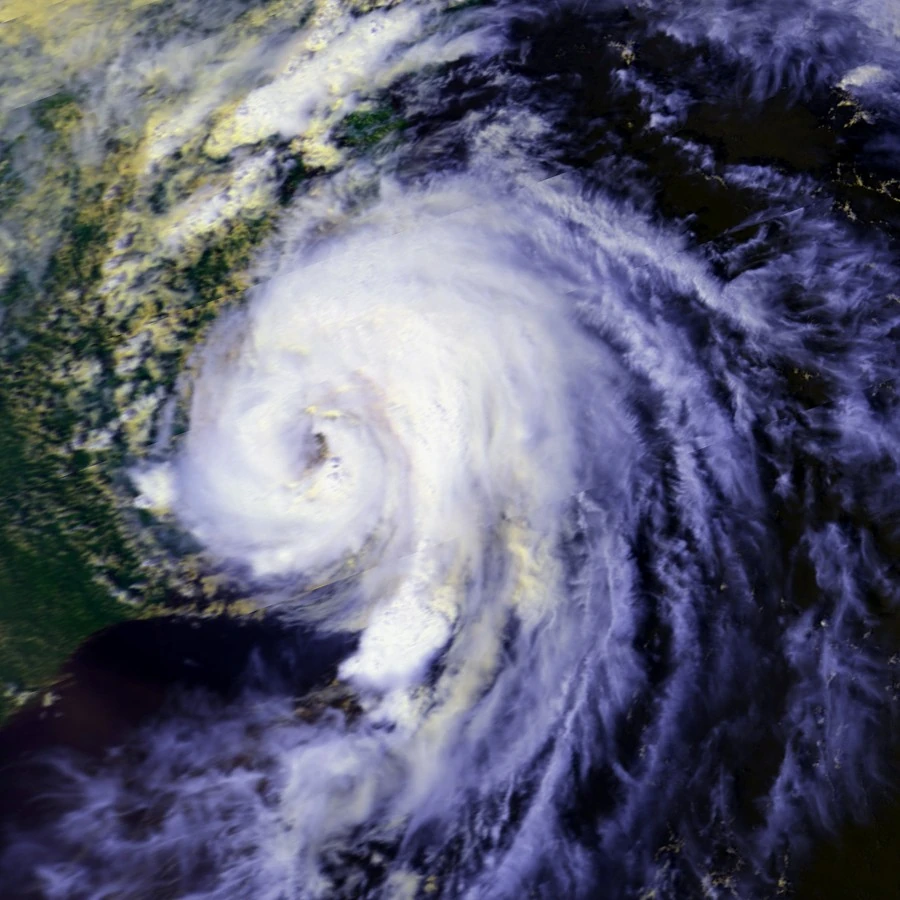  | |
| Duration | July 31 – August 6 |
|---|---|
| Peak intensity | 90 mph (150 km/h) (1-min) 972 mbar (hPa) |
Tropical Depression Nine[]
| Tropical depression (SSHWS) | |
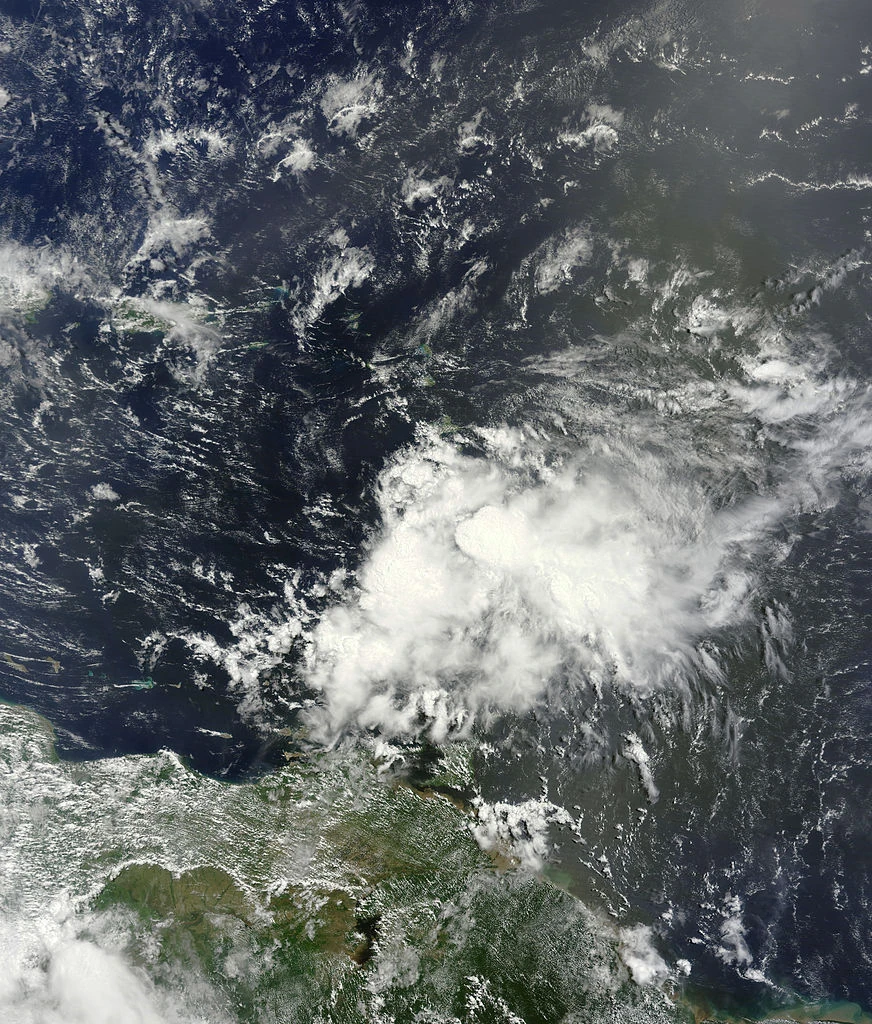  | |
| Duration | August 7 – August 9 |
|---|---|
| Peak intensity | 35 mph (55 km/h) (1-min) 1002 mbar (hPa) |
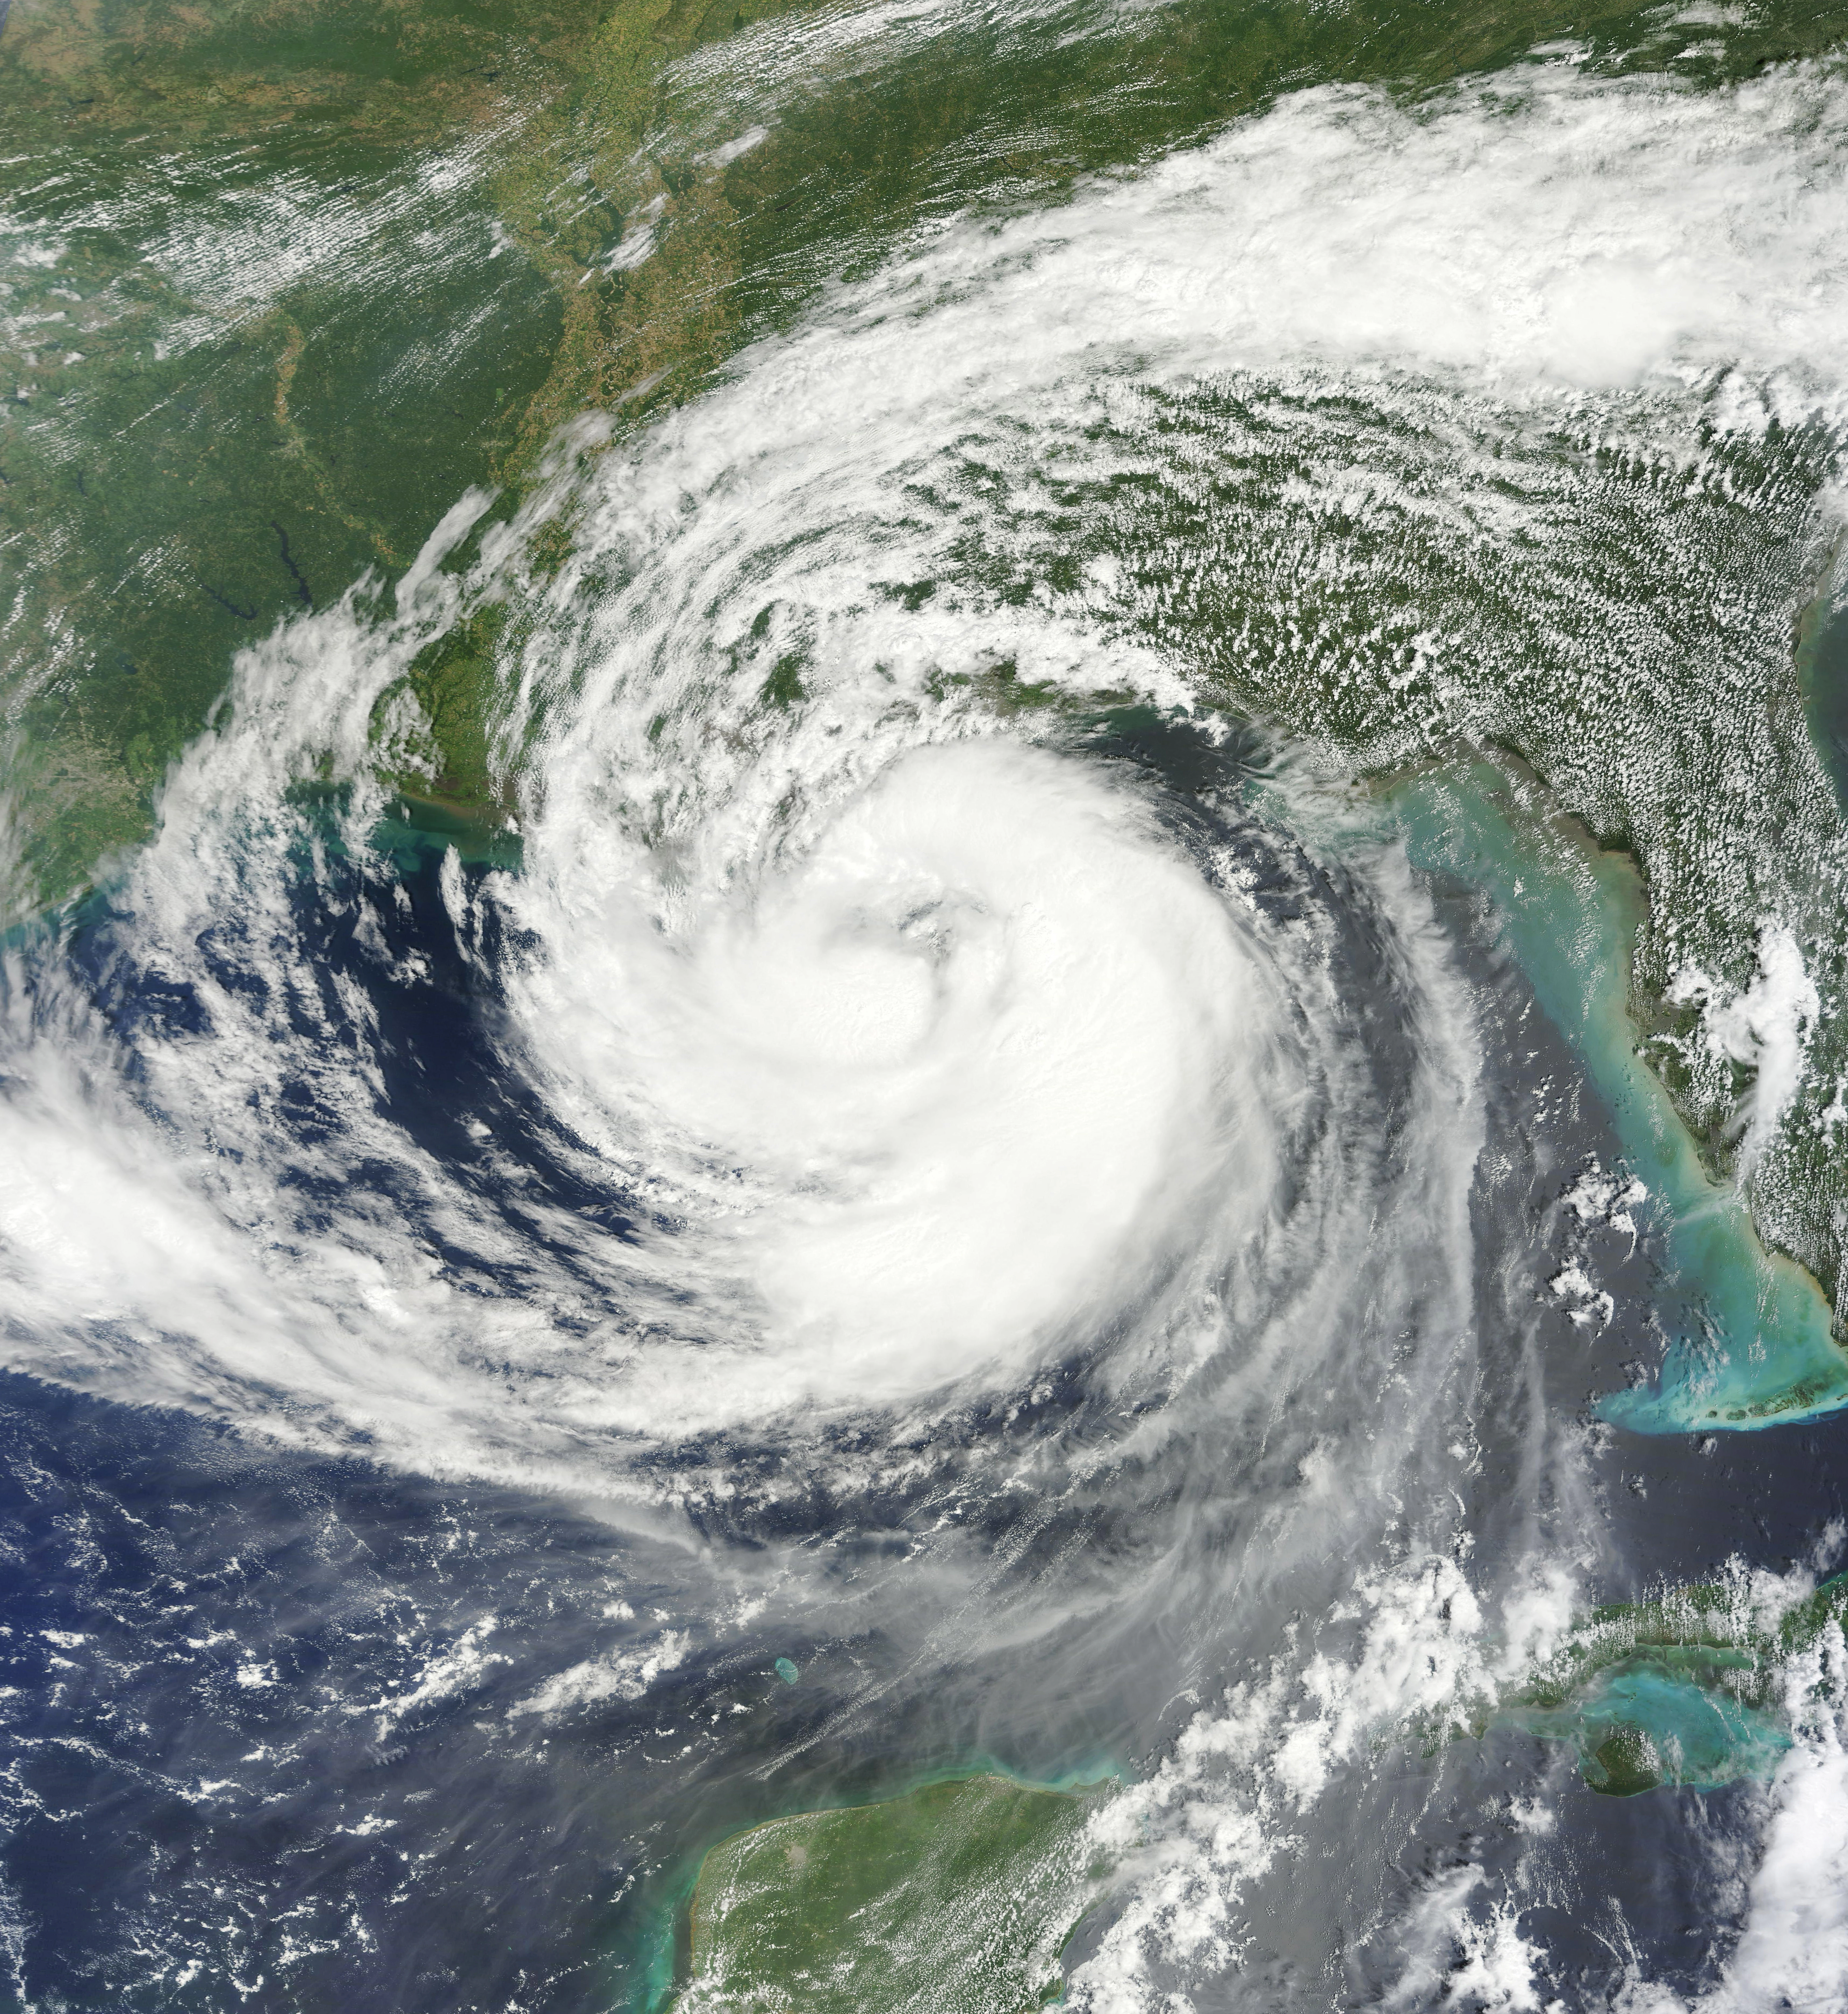
Hurricane Henri[]
| Category 3 hurricane (SSHWS) | |
  | |
| Duration | August 16 – August 27 |
|---|---|
| Peak intensity | 125 mph (205 km/h) (1-min) 943 mbar (hPa) |
Hurricane Ida[]
| Category 3 hurricane (SSHWS) | |
  | |
| Duration | August 22 – August 30 |
|---|---|
| Peak intensity | 120 mph (195 km/h) (1-min) 950 mbar (hPa) |
Tropical Storm Joaquin[]
| Tropical storm (SSHWS) | |
  | |
| Duration | August 29 – September 1 |
|---|---|
| Peak intensity | 45 mph (75 km/h) (1-min) 1000 mbar (hPa) |
Hurricane Kate[]
| Category 2 hurricane (SSHWS) | |
  | |
| Duration | September 2 – September 11 |
|---|---|
| Peak intensity | 100 mph (155 km/h) (1-min) 967 mbar (hPa) |
Tropical Storm Larry[]
| Tropical storm (SSHWS) | |
  | |
| Duration | September 6 – September 9 |
|---|---|
| Peak intensity | 50 mph (85 km/h) (1-min) 1000 mbar (hPa) |
Timeline[]

Accumulated Cyclone Energy (ACE) Rating[]
| ACE (104 kt2) – Storm: Source | |||||
|---|---|---|---|---|---|
| 1 | 0.00 | Storm | 12 | 0.00 | Storm |
| 2 | 0.00 | Storm | 13 | 0.00 | Storm |
| 3 | 0.00 | Storm | 14 | 0.00 | Storm |
| 4 | 0.00 | Storm | 15 | 0.00 | Storm |
| 5 | 0.00 | Storm | 16 | 0.00 | Storm |
| 6 | 0.00 | Storm | 17 | 0.00 | Storm |
| 7 | 0.00 | Storm | 18 | 0.00 | Storm |
| 8 | 0.00 | Storm | 19 | 0.00 | Storm |
| 9 | 0.00 | Storm | 20 | 0.00 | Storm |
| 10 | 0.00 | Storm | 21 | 0.00 | Storm |
| 11 | 0.00 | Storm | 22 | 0.00 | Storm |
| Total=0.00 | |||||
ACE is the result of a storm's winds multiplied by how long it lasted for, so storms or subtropical storms (Originally not included up until 2012) that at lasted a long time , as well as particularly strong hurricanes , have higher ACE totals. Tropical Depressions are not included in season totals.
Season effects[]
This is a table of the storms and their effects in the 2015 Atlantic hurricane season. This table includes the storm's names, duration, peak intensity, Areas affected (bold indicates made landfall in that region at least once), damages, and death totals. Deaths in parentheses are additional and indirect (an example of an indirect death would be a traffic accident), but are still storm-related. Damage and deaths include totals while the storm was extratropical, a wave or a low. All of the damage figures are in 2015 USD (the listed damage figure is in millions).
| Storm name |
Dates active | Storm category at peak intensity |
Max 1-min wind mph (km/h) |
Min. press. (mbar) |
Areas affected | Damage (USD) |
Deaths |
|---|---|---|---|---|---|---|---|
| Ana | June 2 – June 7 | Category 1 hurricane | 80 (130) | 984 | The Bahamas | Minor | 1 |
| Bill | June 14 – June 18 | Tropical storm | 65 (100) | 990 | Nova Scotia | 5 | 4 |
| Three | June 27 – June 28 | Tropical depression | 35 (55) | 1004 | None | 0 | 0 |
| Claudette | June 30 – July 4 | Category 2 hurricane | 110 (175) | 958 | US East Coast (Florida), The Bahamas | 4,300 | 85 |
| Danny | July 14 – July 20 | Category 2 hurricane | 110 (175) | 959 | Mexico, Honduras, Nicaragua | 280 | 35 |
| Erika | July 20 – August 1 | Category 5 hurricane | 165 (270) | 913 | US Gulf Coast (Texas), Mexico, Jamaica | 23,900 | 1,450 |
| Fred | July 24 – August 2 | Category 4 hurricane | 135 (215) | 946 | US Gulf Coast (Lousiana), US East Coast (Florida), The Bahamas | 10,500 | 80 |
| Grace | July 31 – August 6 | Category 1 hurricane | 90 (150) | 972 | Nova Scotia, US East Coast (North Carolina) (Florida), The Bahamas | 105 | 12 |
| Nine | August 7 – August 9 | Tropical depression | 35 (55) | 1002 | Puerto Rico | Minor | 1 |
| Henri | August 16 – August 27 | Category 3 hurricane | 125 (205) | 943 | NewFoundLand, US East Coast (New York) (North Carolina), Puerto Rico | 31,800 | 595 |
| Ida | August 22 – August 30 | Category 3 hurricane | 120 (195) | 950 | None | 0 | 0 |
| Joaquin | August 29 – September 1 | Tropical storm | 45 (75) | 1000 | US East Coast (Florida), Cuba | Minor | 1 |
| Kate | September 2 – September 11 | Category 2 hurricane | 100 (155) | 967 | US Gulf Coast (Louisiana), Cuba, Hispaniola, Puerto Rico | 7,000 | 185 |
| Larry | September 6 – September 9 | Tropical storm | 50 (85) | 1000 | US East Coast (Maine) (Massachusetts) (North Carolina) | 10 | 5 |