The 2013 Bikini Bottom hurricane season was an event in tropical cyclone meteorology. Following a destructive and a 357-death 2012 Bikini Bottom hurricane season, newer technology to improve hurricane forecasting debuted. The season began on June 1, 2013, and it ended on November 30, 2013, dates that conventionally delimit the timeframe period for tropical cyclogenesis. However, if a storm forms between January 1, 2013 and December 31, 2013, it could still factor into the season total, as was the case with Tropical Storms Adrian and Brad.
Season summary[]
After 357 people died (349 directly, eight indirectly) in the 2012 Bikini Bottom hurricane season, curious scientists (including Sandy Cheeks), wanted to make more advanced machines to forecast a major hurricane (Category 3 or higher on the Saffir-Simpson Hurricane Scale) by February 2013.
As a whole, the 2013 Bikini Bottom hurricane season produced eighteen tropical depressions, eighteen tropical storms, nine hurricanes, and five major hurricanes. The season kicked off with Adrian's formation on January 31, over four months ahead of 2012's first storm formation date (Amelia, June 16). Abnormal pre-season activity occurred again in early May, when Tropical Storm Brad formed. June continued the record pace, with an outbreak of three tropical storms (Carl, Dominic, and Eris), one of which (Dominic) became the only June major hurricane on record. However, in July, activity took a temporary halt with just one tropical storm, Felicia, forming. The inactivity persisted into the first half of August; it was completely dormant of all tropical cyclone activity. However, an abrupt activity reversal occured in the month's closing days, with three new storms (Gilma, Harvey, Ileana) developing, two of which (Gilma and Ileana) became hurricanes. September proved to be very active, with five total storms, four total hurricanes, and two major hurricanes forming, matching the level of activity witnessed in the previous season. Two of the month's storms, Hurricane Katie and Tropical Storm Lee, were abnormally destructive to land. Afterwards, activity in October slowed down, producing three tropical storms (Ophelia, Paul, and Rina), with Paul becoming the first October major hurricane in modern records. Stan's dissipation on November 13 capped the season off; 2013 ended two weeks later than 2012. For comparison, 2013 produced more storms than 2012 did but caused less land impact than 2012.
Seasonal forecasts[]
Mr. Thicklebach, a famous scientist who is the brother of Judge Thicklebach, gathered a group of scientists on December 16, 2012 to predict the 2013 Bikini Bottom hurricane season's total activity. Thicklebach's hypothesis for the season's activity was 9.2 total storms, five hurricanes, and 1.3 major hurricanes. Other scientists also developed hypotheses for the season's activity. Thicklebach's hypothesis concluded that the season would be below average compared to the 2012 season.
On December 21, 2012, Thicklebach met with Rina Bottom's high-tech paranormal scientist and investigator, Jack Kerry. Kerry had other different scientific fields he chad reated for the 2013 season. They described the season to be slightly more active. Kerry and Thicklebach met again on March 16, 2013 to retire the destructive hurricane names for 2012 and subsequently conclude that season's activity. On August 15, the most updated hurricane season forecast called for 18 named storms, 9 tropical storms, 9 hurricanes, and 4 major hurricanes, which perfectly verified.
Accumulated Cyclone Energy[]
| Katie | 45.86 | Paul | 16.08 | Ileana | 15.53 | Dominic | 15.52 | ||||||||
| Muriel | 12.73 | Gilma | 11.24 | Jack | 10.76 | Rina | 9.67 | ||||||||
| Lee | 6.78 | Nestor | 4.75 | Adrian | 4.11 | Cal | 3.91 | ||||||||
| Stan | 3.53 | Ophelia | 3.27 | Harvey | 2.44 | Felicia | 1.99 | ||||||||
| Brad | 1.01 | Eris | 0.96 | ||||||||||||
|
Total: 170.14 (hyperactive) | |||||||||||||||
The table above shows the ACE for each storm in the season. ACE is, broadly speaking, a measure of the power of the hurricane multiplied by the length of time it existed, so storms that last a long time, as well as particularly strong hurricanes, have high ACEs. ACE is calculated for only full advisories on tropical systems at or exceeding 34 knots (39 mph, 63 km/h) or tropical storm strength. Subtropical cyclones are not included in the ACE. Overall, the 2013 Bikini Bottom hurricane season generated an ACE of 170.14 units, exceeding the previous season's ACE.
Timeline[]

Storm names[]
The following list of storms were used to name storms that form in the Bikini Bottom Weather Center's area of responsibility during 2013. Retired names, were announced at Session XXVII of the Bikini Bottom Meteorological Organization on January 5, 2014. Because this was the first time this naming list was used since naming begun last year, it marked the first time any of these names have been used. Unused names are marked in gray.
|
|
|
Retirement[]
The name Lee was retired after the 2013 season. Its replacement for 2019 will be Lucas.
List of storms[]
Tropical Storm Adrian[]
| Tropical storm (SSHWS) | |
 | |
| Duration | January 31 – February 4 |
|---|---|
| Peak intensity | 70 mph (110 km/h) (1-min) 990 mbar (hPa) |
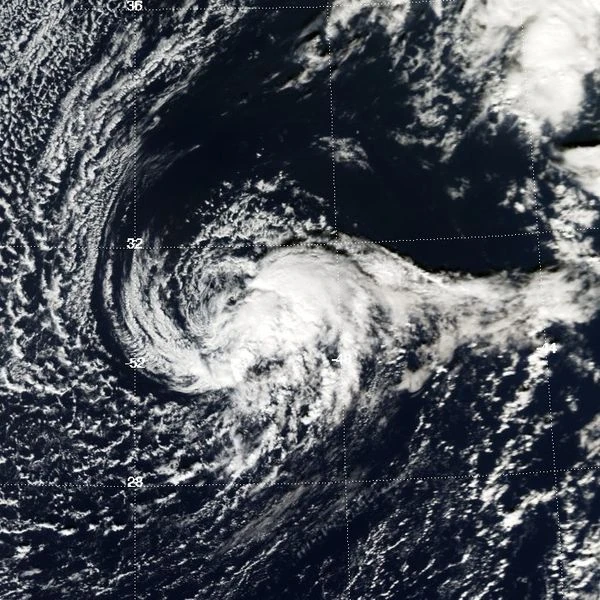
An unexpected low pressure area formed on January 25. This non-tropical low struggled to form until January 31, 2013, when it was upgraded into a tropical depression. Six hours later, the depression was upgraded to a tropical storm and named Adrian. Adrian is the earliest forming Bikini Bottom tropical cyclone in two years of reliable record keeping, as hurricane are usually not expected to form until late May or early June. Adrian dissipated on February 4 after being absorbed into Winter Storm Mandarine by a Fujiwhara interaction. Adrian was operationally upgraded to a hurricane, but after reanalysis proved no hurricane-force gusts were measured in the storm, it was downgraded into a strong tropical storm on June 19.
Tropical Storm Brad[]
| Tropical storm (SSHWS) | |
 | |
| Duration | May 1 – May 3 |
|---|---|
| Peak intensity | 65 mph (105 km/h) (1-min) 1000 mbar (hPa) |
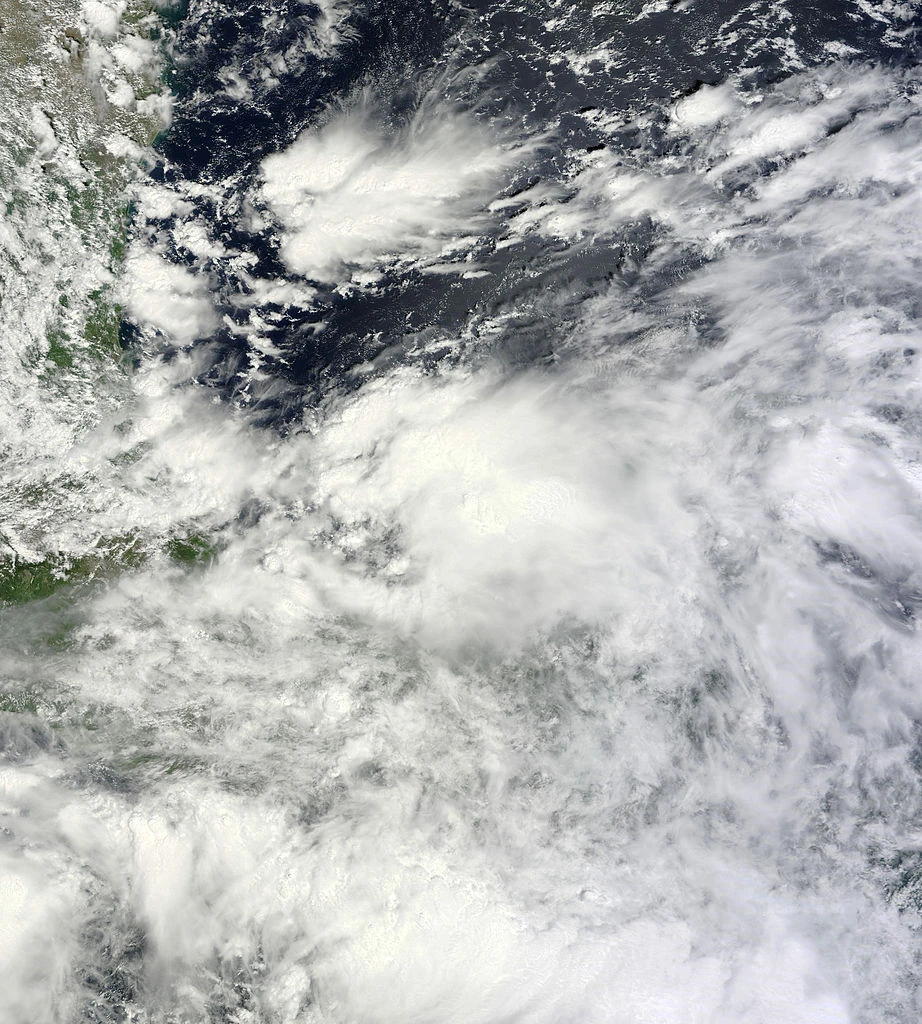
Another unexpected low pressure area formed off the coast of Stanica Bottom in the southern Bikini Atoll region on April 29. Later, the system became Invest 80B and then later Tropical Depression Two; this storm then became a tropical storm on the evening of May 1 and was given the name Brad. The tropical storm reached its maximum intensity of 65 miles per hour on May 2nd, the storm then dissipated the next day, May 3rd off the coast of the northeast section of Bikini Bottom.
Hurricane Cal[]
| Category 1 hurricane (SSHWS) | |
 | |
| Duration | June 10 – June 15 |
|---|---|
| Peak intensity | 80 mph (130 km/h) (1-min) 1009 mbar (hPa) |
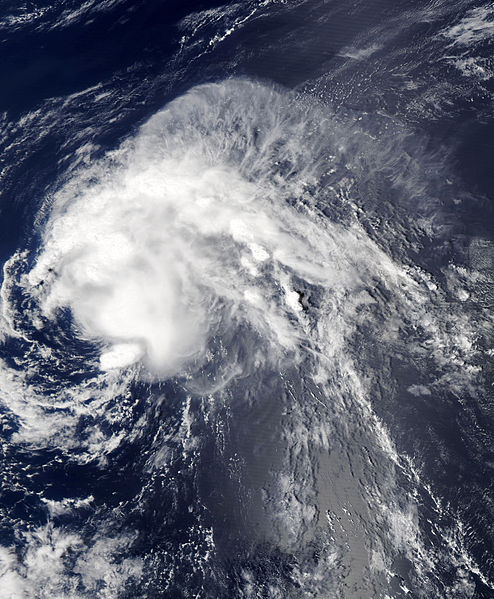
On June 9, a broad area of accelerating thunderstorms appeared in the center of the Bikini Atoll area, eventually intensifying into Tropical Depression Three the next day. The depression was later upgraded into a tropical storm and given the name Cal. Five days later, on June 15, Cal degenerated into a remnant low; it killed only one person at Bikini Bottom's Goo Lagoon.
Hurricane Dominic[]
| Category 3 hurricane (SSHWS) | |
 | |
| Duration | June 19 – June 29 |
|---|---|
| Peak intensity | 115 mph (180 km/h) (1-min) 935 mbar (hPa) |
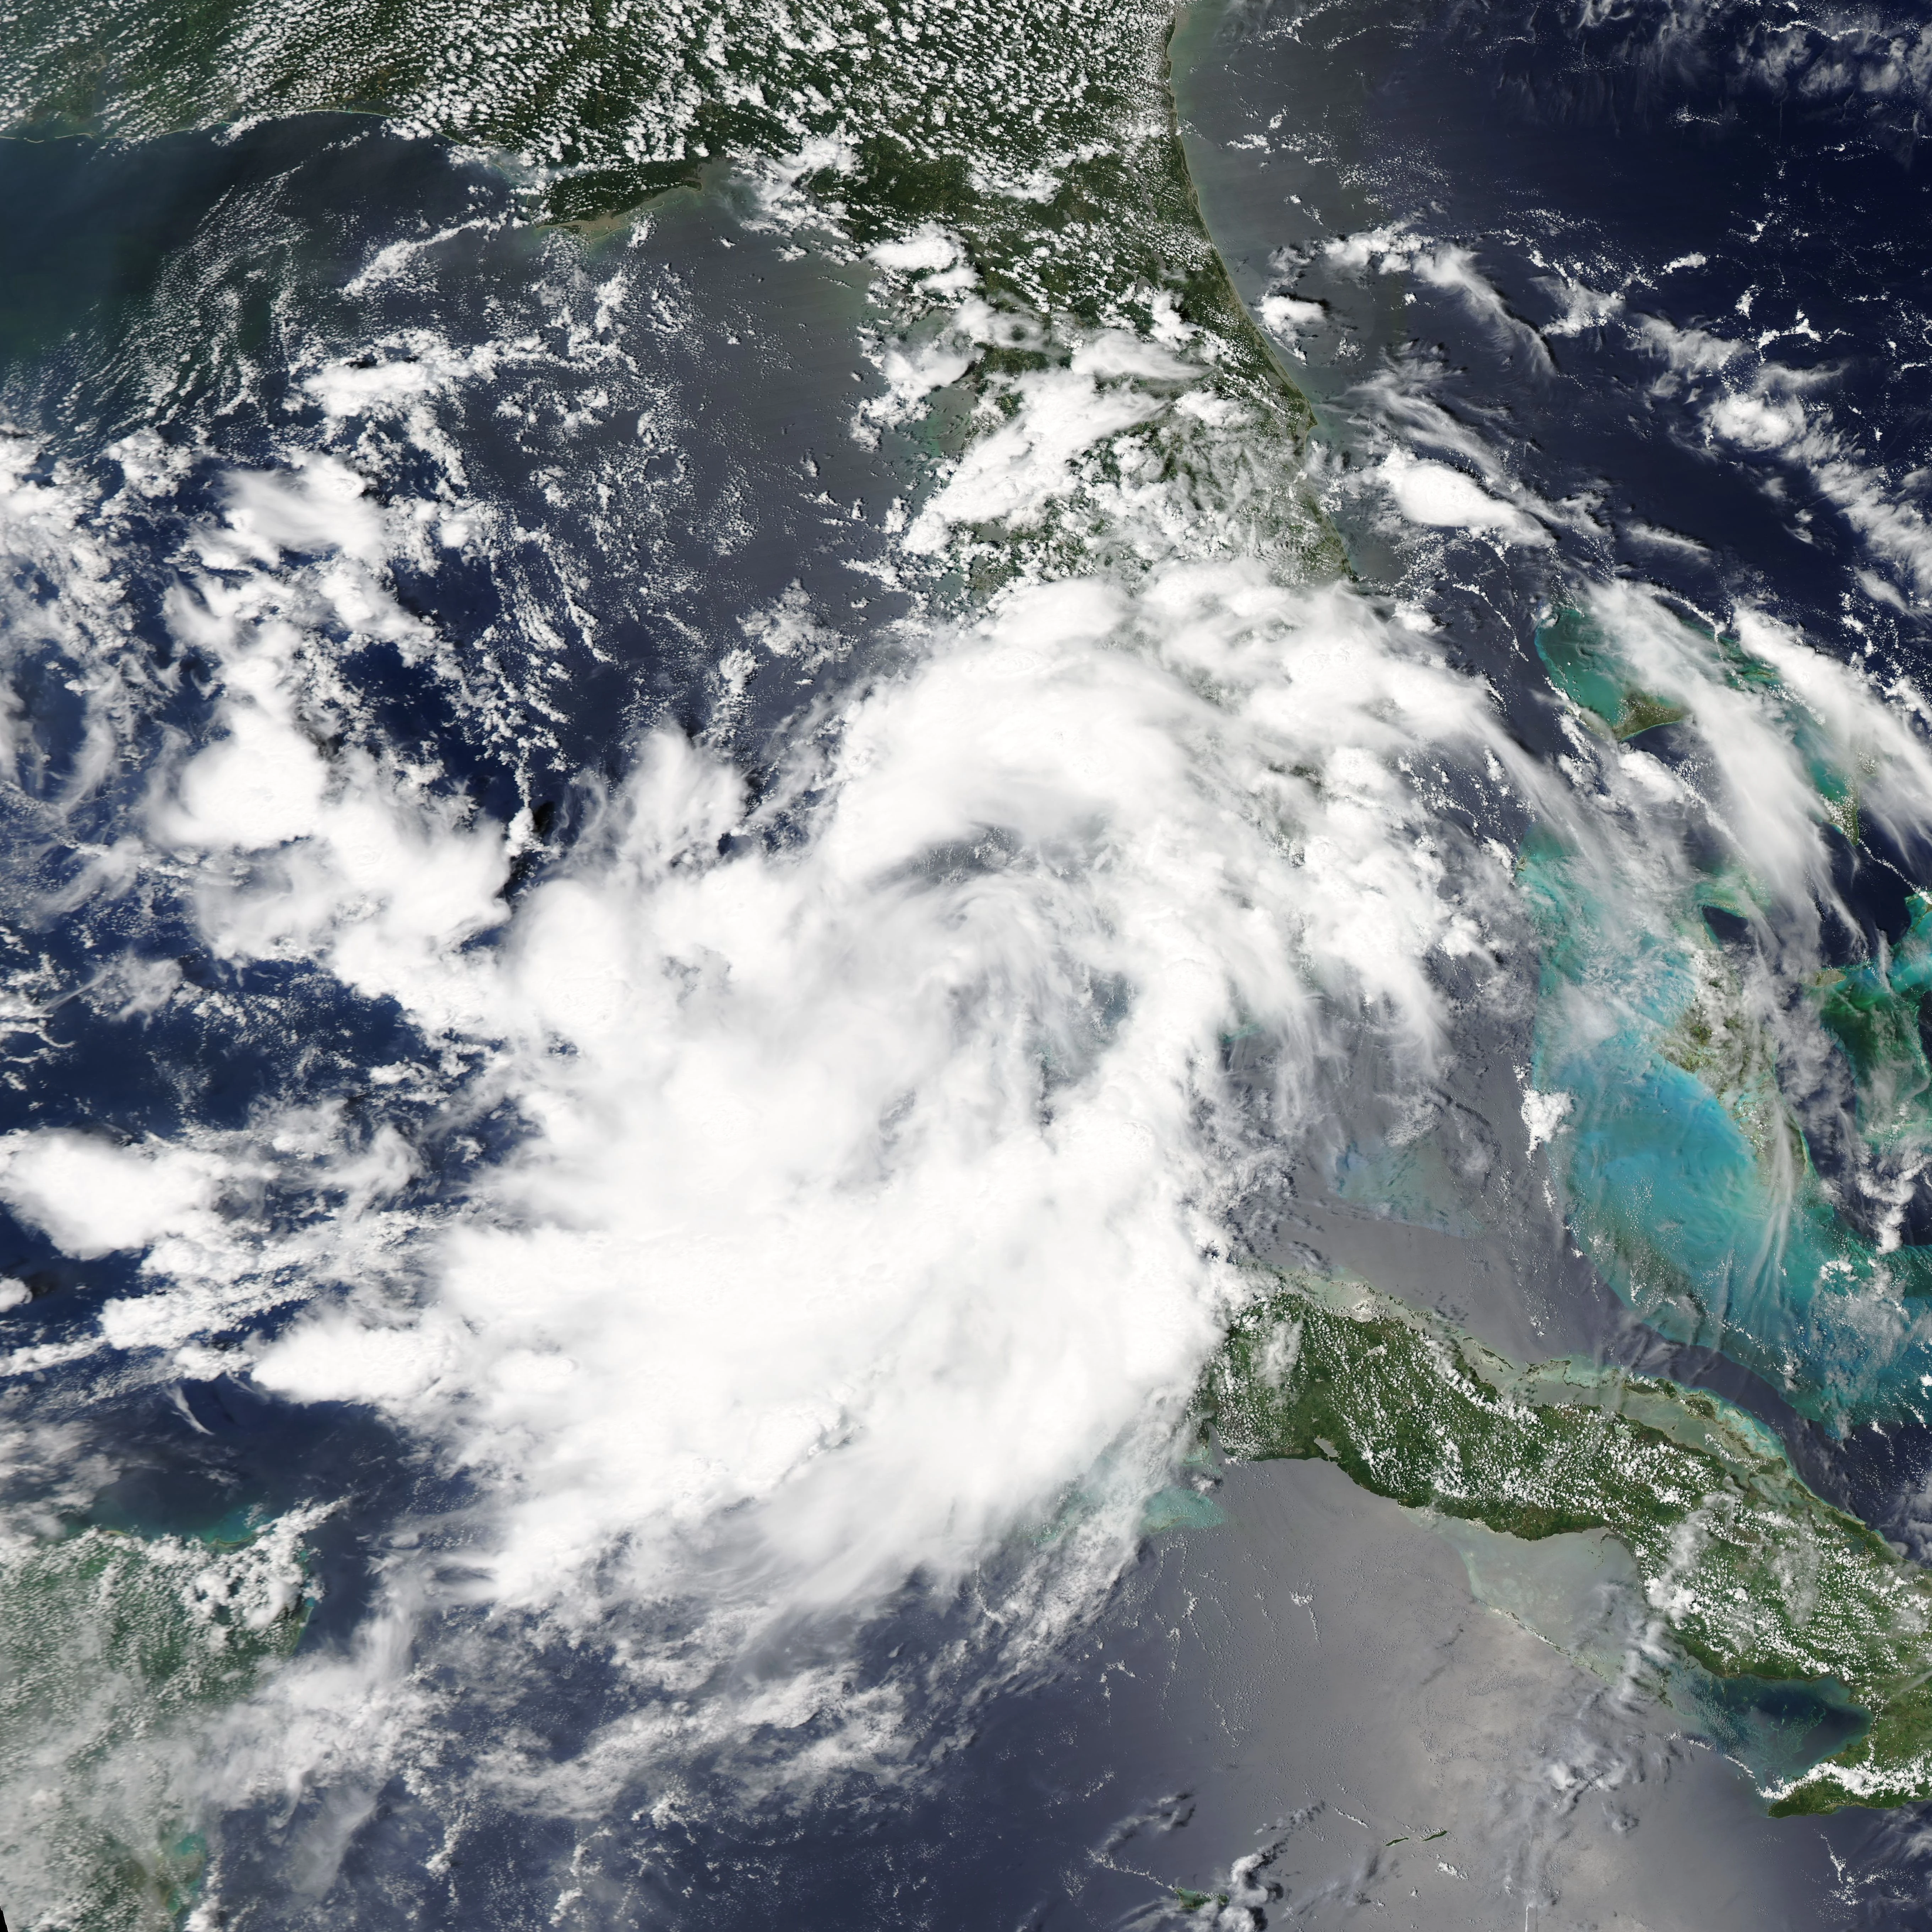
On June 17, the Bikini Bottom Weather Center began monitoring a vigorous tropical wave coming off of Bikini Atoll; it was later upgraded into Tropical Depression Four the next day. On June 19, one day later, the depression was upgraded into Tropical Storm Dominic. The storm soon encountered hurricane-force wind gusts on the night of June 20 and was subsequently upgraded to a Category 1 hurricane. The projected path of Dominic forecasted it to reach category 2 intensity, which later panned out to be true.
Tropical Storm Eris[]
| Tropical storm (SSHWS) | |
 | |
| Duration | June 23 – June 25 |
|---|---|
| Peak intensity | 45 mph (70 km/h) (1-min) 1007 mbar (hPa) |
On June 21, as Hurricane Dominic intensified out at sea, a tropical wave developed off the coast between Rock Bottom and Rina Bottom. The next day, the wave appeared to have developed significantly on satellite imagery. Next, on June 23, the disturbance was upgraded into Tropical Depression Five. The depression developed significant convection, and was further upgraded to Tropical Storm Eris. Eris did not last long, as it dissipated within 48 hours.
Tropical Storm Felicia[]
| Tropical storm (SSHWS) | |
 | |
| Duration | July 7 – July 11 |
|---|---|
| Peak intensity | 40 mph (65 km/h) (1-min) 1009 mbar (hPa) |
On July 5, the Bikini Bottom Hurricane Center began to notice convection developing in a tropical wave. The next day, the wave developed further up to the point where it was classified as Tropical Depression Six. Within 24 hours, the depression intensified even further and was reclassified Tropical Storm Felicia. The storm rapidly crossed Bikini Bottom, maintaining a fast forward speed. Felicia ultimately became extratropical on July 11.
Hurricane Gilma[]
| Category 1 hurricane (SSHWS) | |
 | |
| Duration | August 17 – August 25 |
|---|---|
| Peak intensity | 85 mph (135 km/h) (1-min) 1009 mbar (hPa) |
The Bikini Bottom Hurricane Center began investigating a blob that formed extreme south on August 15, the disturbance got more well developed and was classified as Tropical Depression Seven on August 16. The next day, it strengthened into Tropical Storm Gilma, the seventh named storm of the 2013 season.
Tropical Storm Harvey[]
| Tropical storm (SSHWS) | |
 | |
| Duration | August 22 – August 25 |
|---|---|
| Peak intensity | 40 mph (65 km/h) (1-min) 1009 mbar (hPa) |
Tropical Storm Harvey formed on August 22.It transformed into a weak Tropical Storm in the afternoon hours of August 22 it stayed the same intensity for a few days before it went over cooler sea surface temperatures and high wind shear it quickly weakened into a remnant low 2 hours later with only a few sporadic showers remaining associated with it then dissipated completely in the evening hours of August 25th.
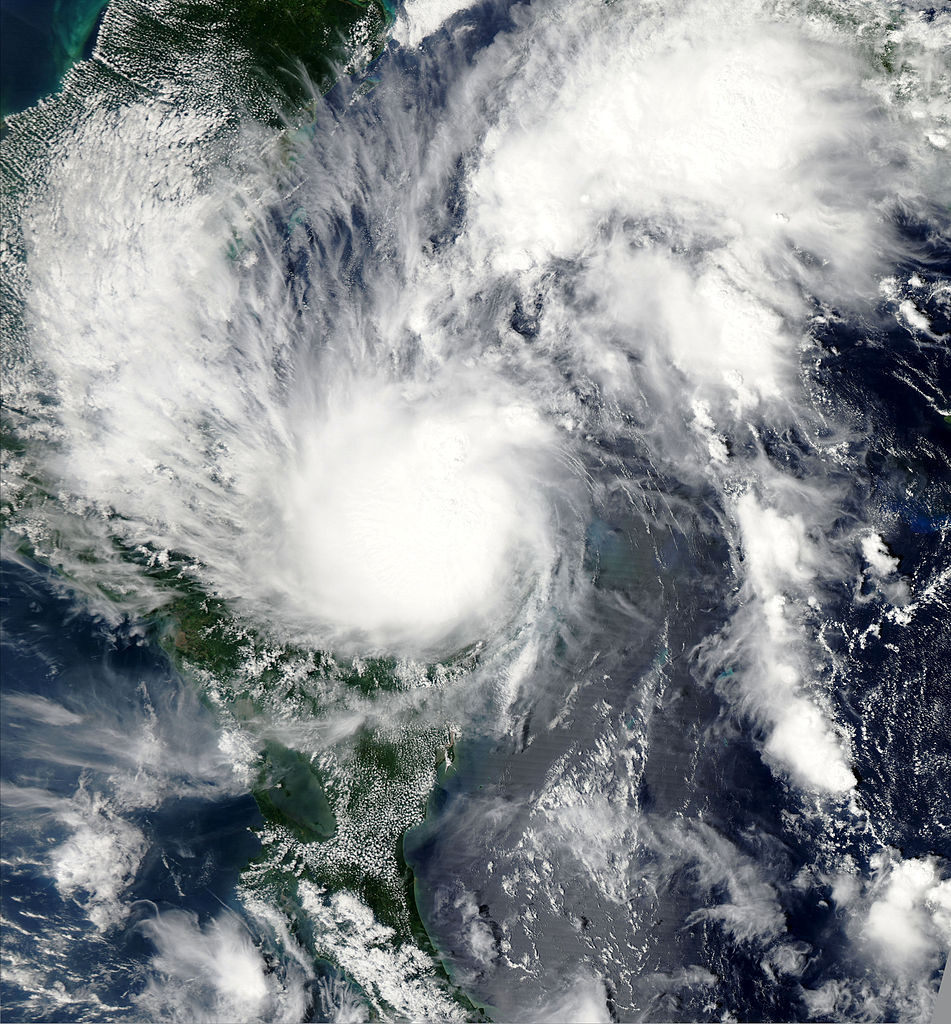
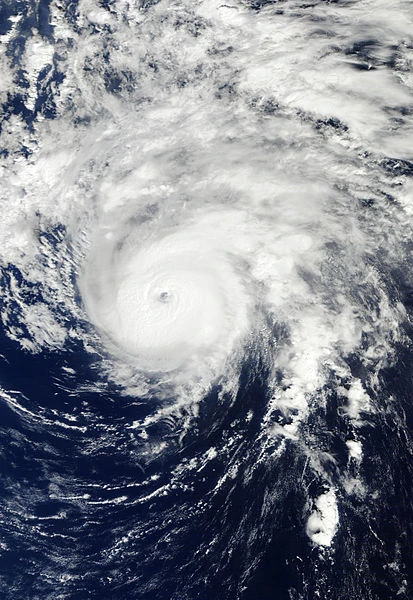
Hurricane Ileana[]
| Category 4 hurricane (SSHWS) | |
 | |
| Duration | August 30 – September 10 |
|---|---|
| Peak intensity | 140 mph (220 km/h) (1-min) 930 mbar (hPa) |
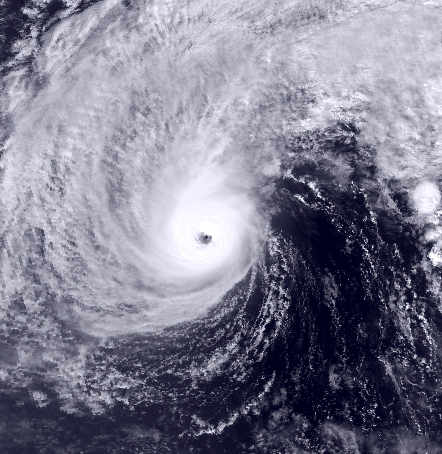
The Bikini Bottom Hurricane Center began monitoring another tropical wave that developed on August 28; two days later it strengthened into Tropical Depression Nine. Four hours later, it strengthened further into Tropical Storm Ileana. Ileana later became a significant category 3 hurricane on September 5. Ileana reached its peak intensity of 140 mph on September 6 witch is category 4 strength, Ileana then dissipated on September 10.
Hurricane Jack[]
| Category 1 hurricane (SSHWS) | |
 | |
| Duration | September 4 – September 10 |
|---|---|
| Peak intensity | 80 mph (130 km/h) (1-min) 994 mbar (hPa) |
The Bikini Bottom Hurricane Center started noticing some convection developing east of Ileana on Labor Day, September 2. Two days later,after rapid intensification, it strengthened into Tropical Depression Ten. At the 9 AM advisory. A few hours later it strengthened into Tropical Storm Jack. Jack then strengthened into a Category 1 hurricane on September 6; it weakened back to a tropical storm on September 9 and then became post-tropical on September 10.
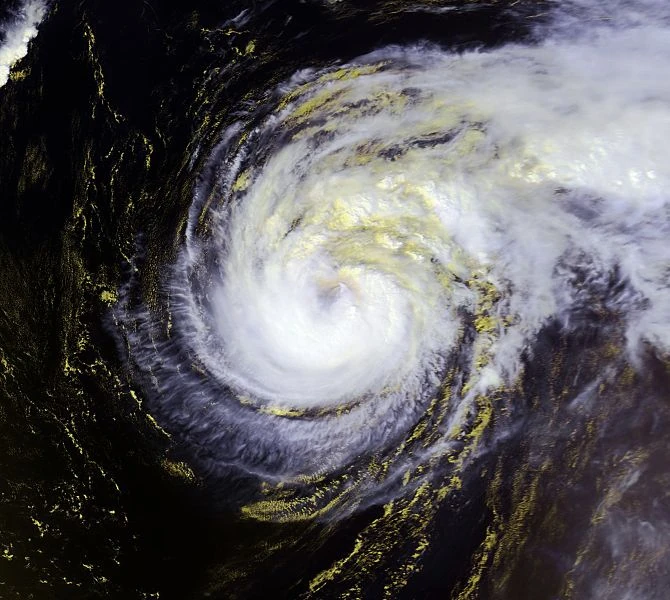
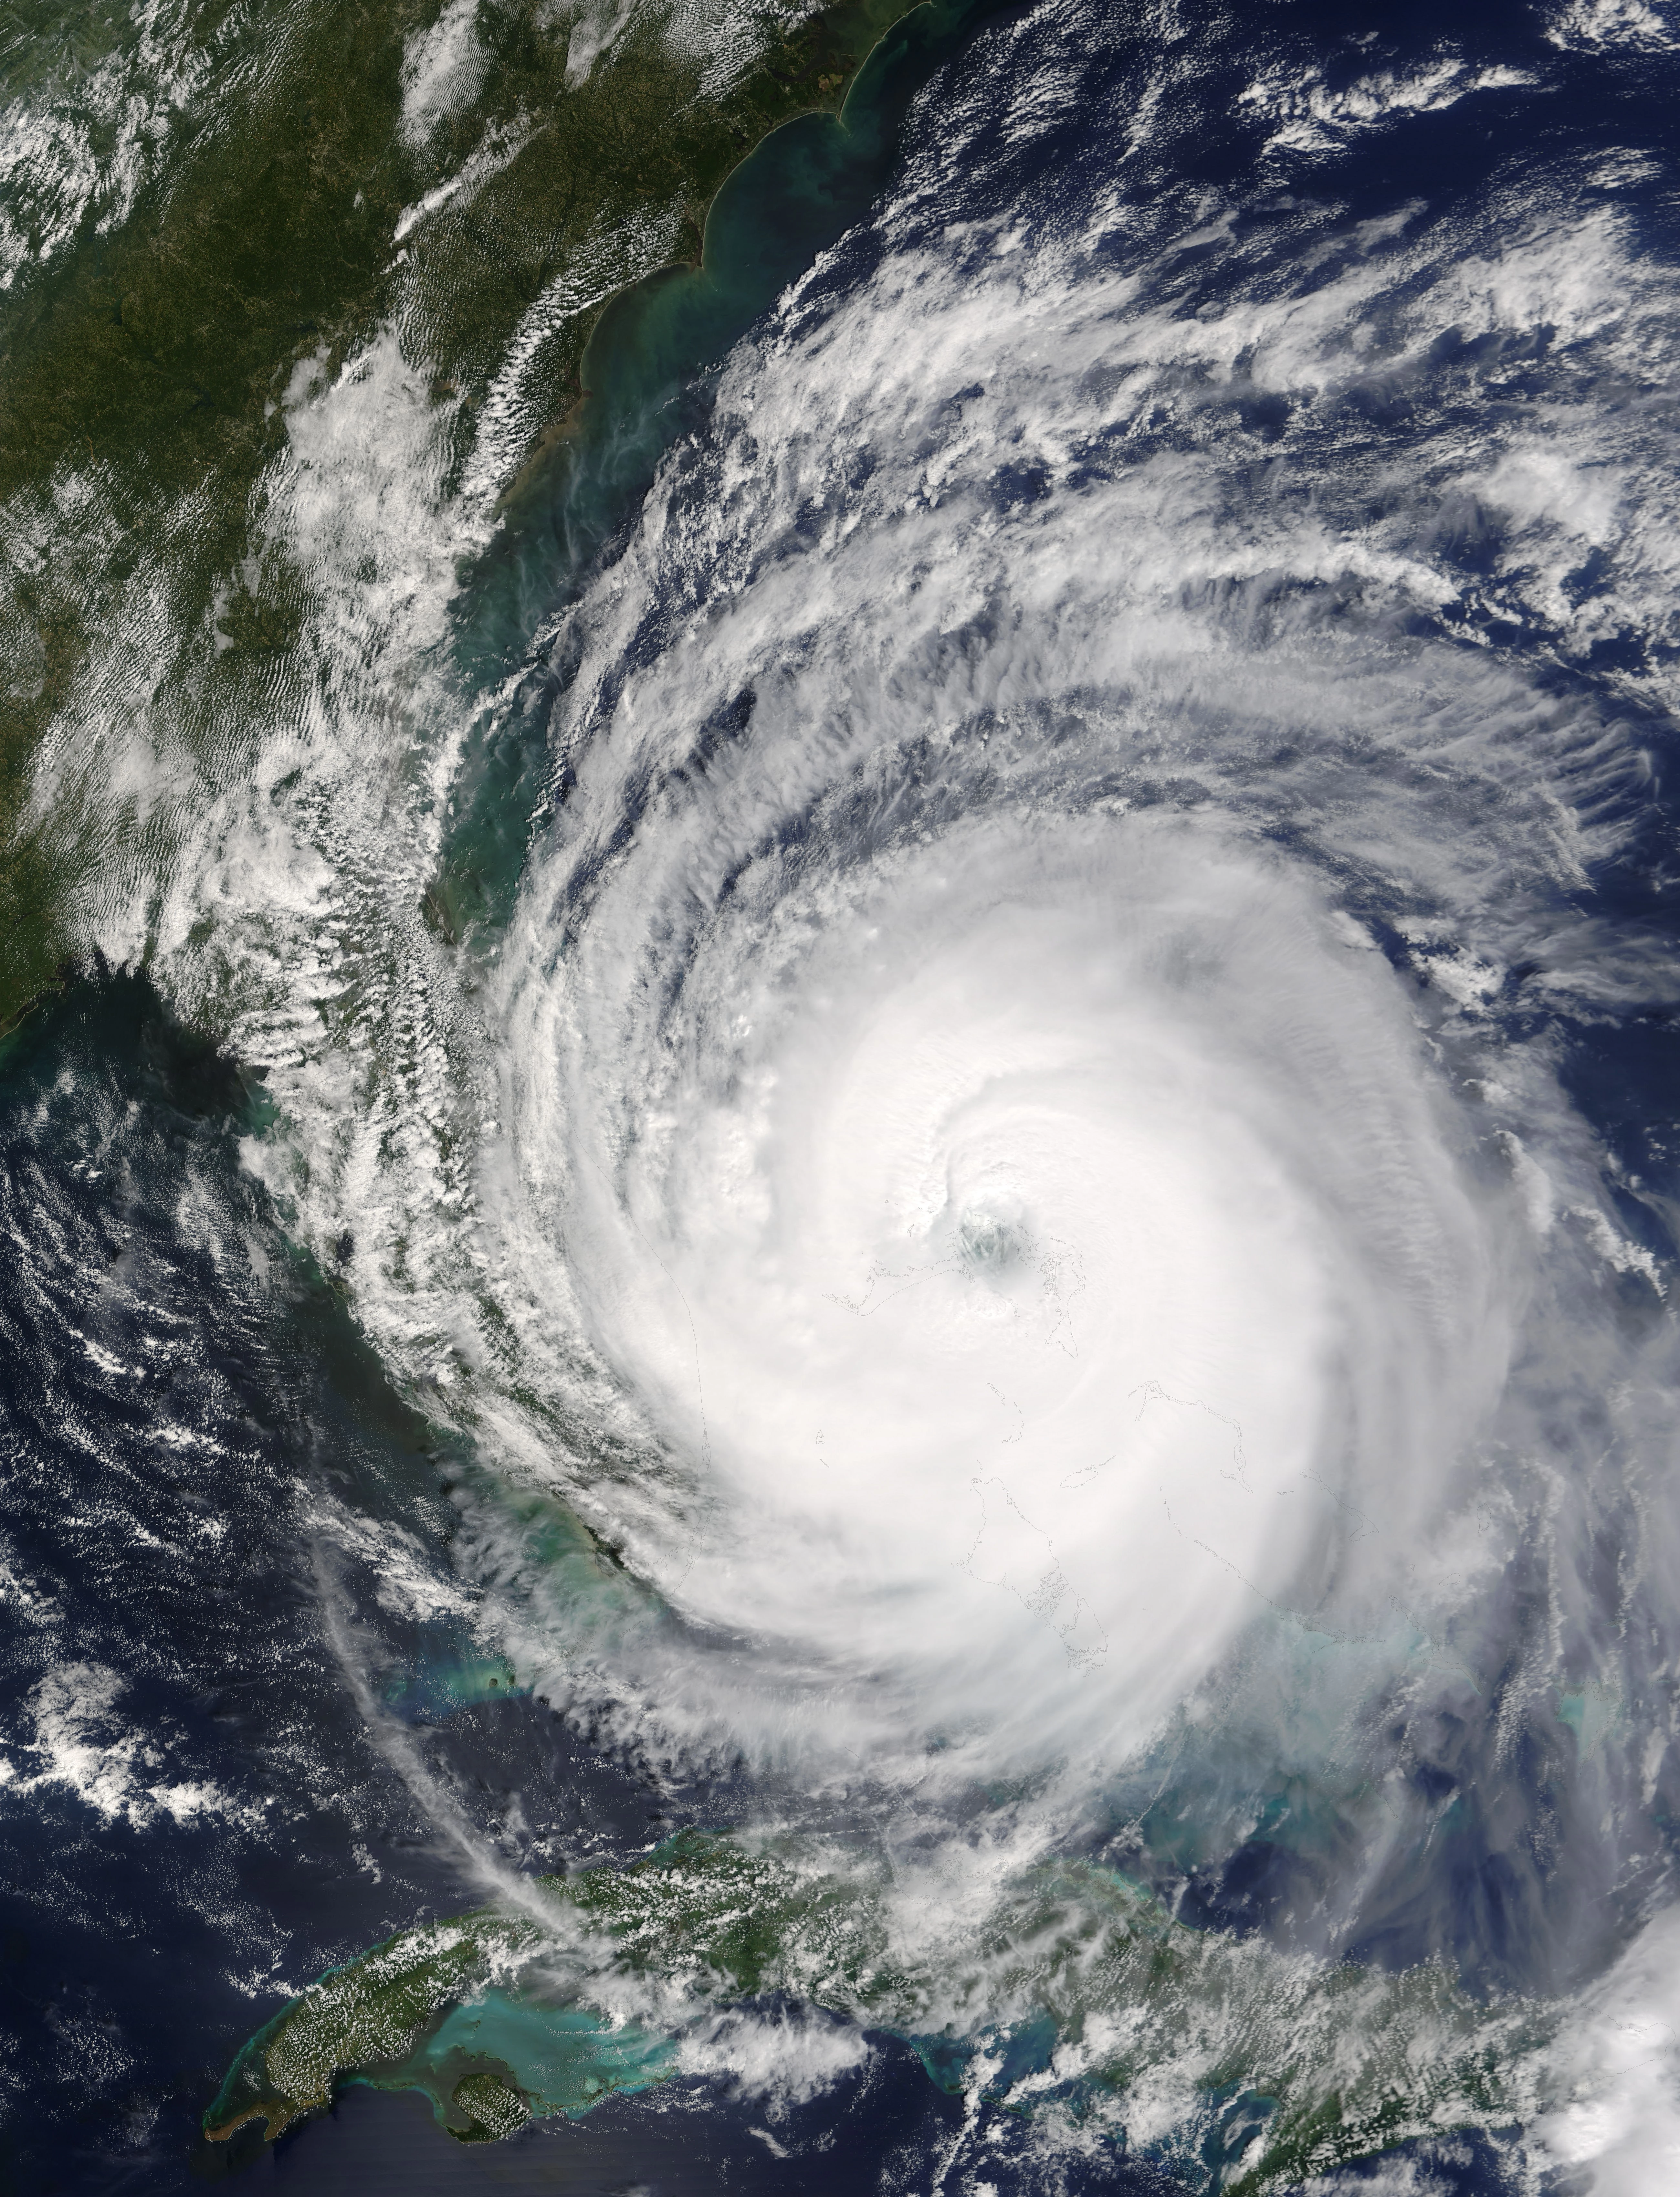
Hurricane Katie[]
| Category 4 hurricane (SSHWS) | |
 | |
| Duration | September 12 – September 24 |
|---|---|
| Peak intensity | 140 mph (220 km/h) (1-min) 930 mbar (hPa) |
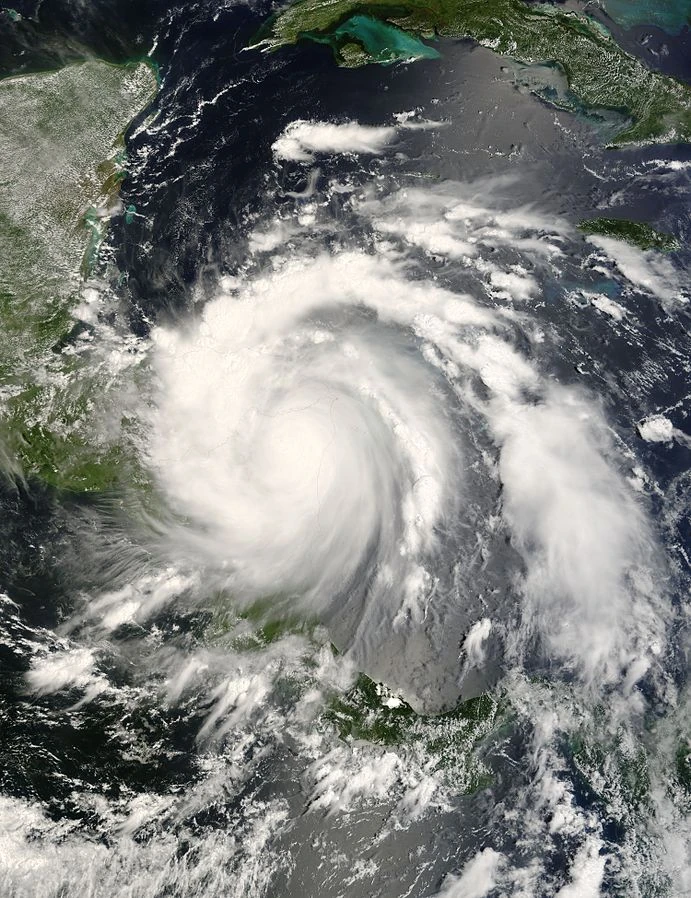
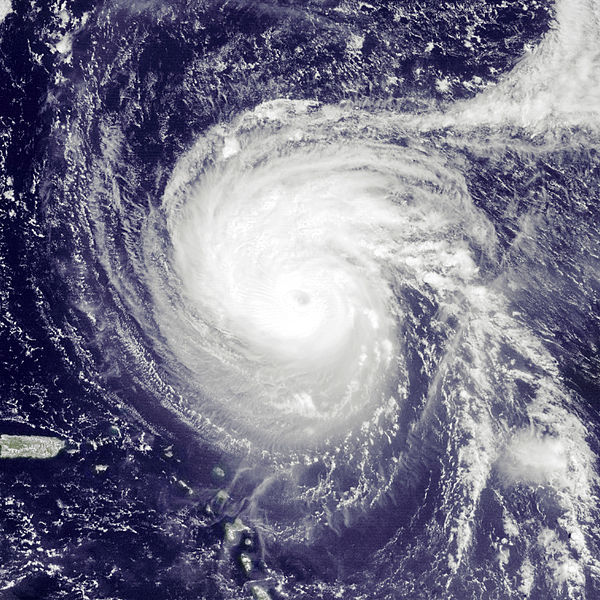
The Bikini Bottom Hurricane Center started to investigate a tropical wave with a closed circulation on September 10 which was the day Ileana and Jack dissipated. Two day later the wave known as Invest 96B was upgraded into Tropical Depression Eleven. Eleven was later upgraded into Tropical Storm Katie, on Friday, September 13. Katie became a category 3 hurricane on September 16 and reached its peak of 140 mph on September 17. It missed Bikini Bottom but caused significant rip-currents. However, it made a direct hit on Ukelele Bottom as a Category 2 hurricane on September 21. Ukelele Bottom was previously hit by Ileana on September 8. Katie spawned 5 tornadoes in Ukelele Bottom - 3 EF0s, 1 EF1, and an EF2. Katie finally became post-tropical on September 24 very up north becoming the northernmost storm on record in the Bikini Bottom region. During its existence, Katie killed ten people.
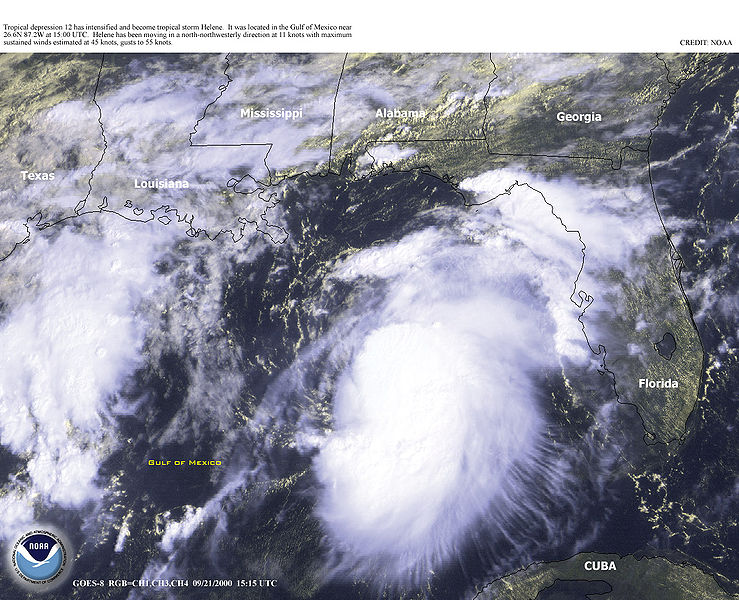
Tropical Storm Lee[]
| Tropical storm (SSHWS) | |
 | |
| Duration | September 17 – September 22 |
|---|---|
| Peak intensity | 70 mph (110 km/h) (1-min) 997 mbar (hPa) |
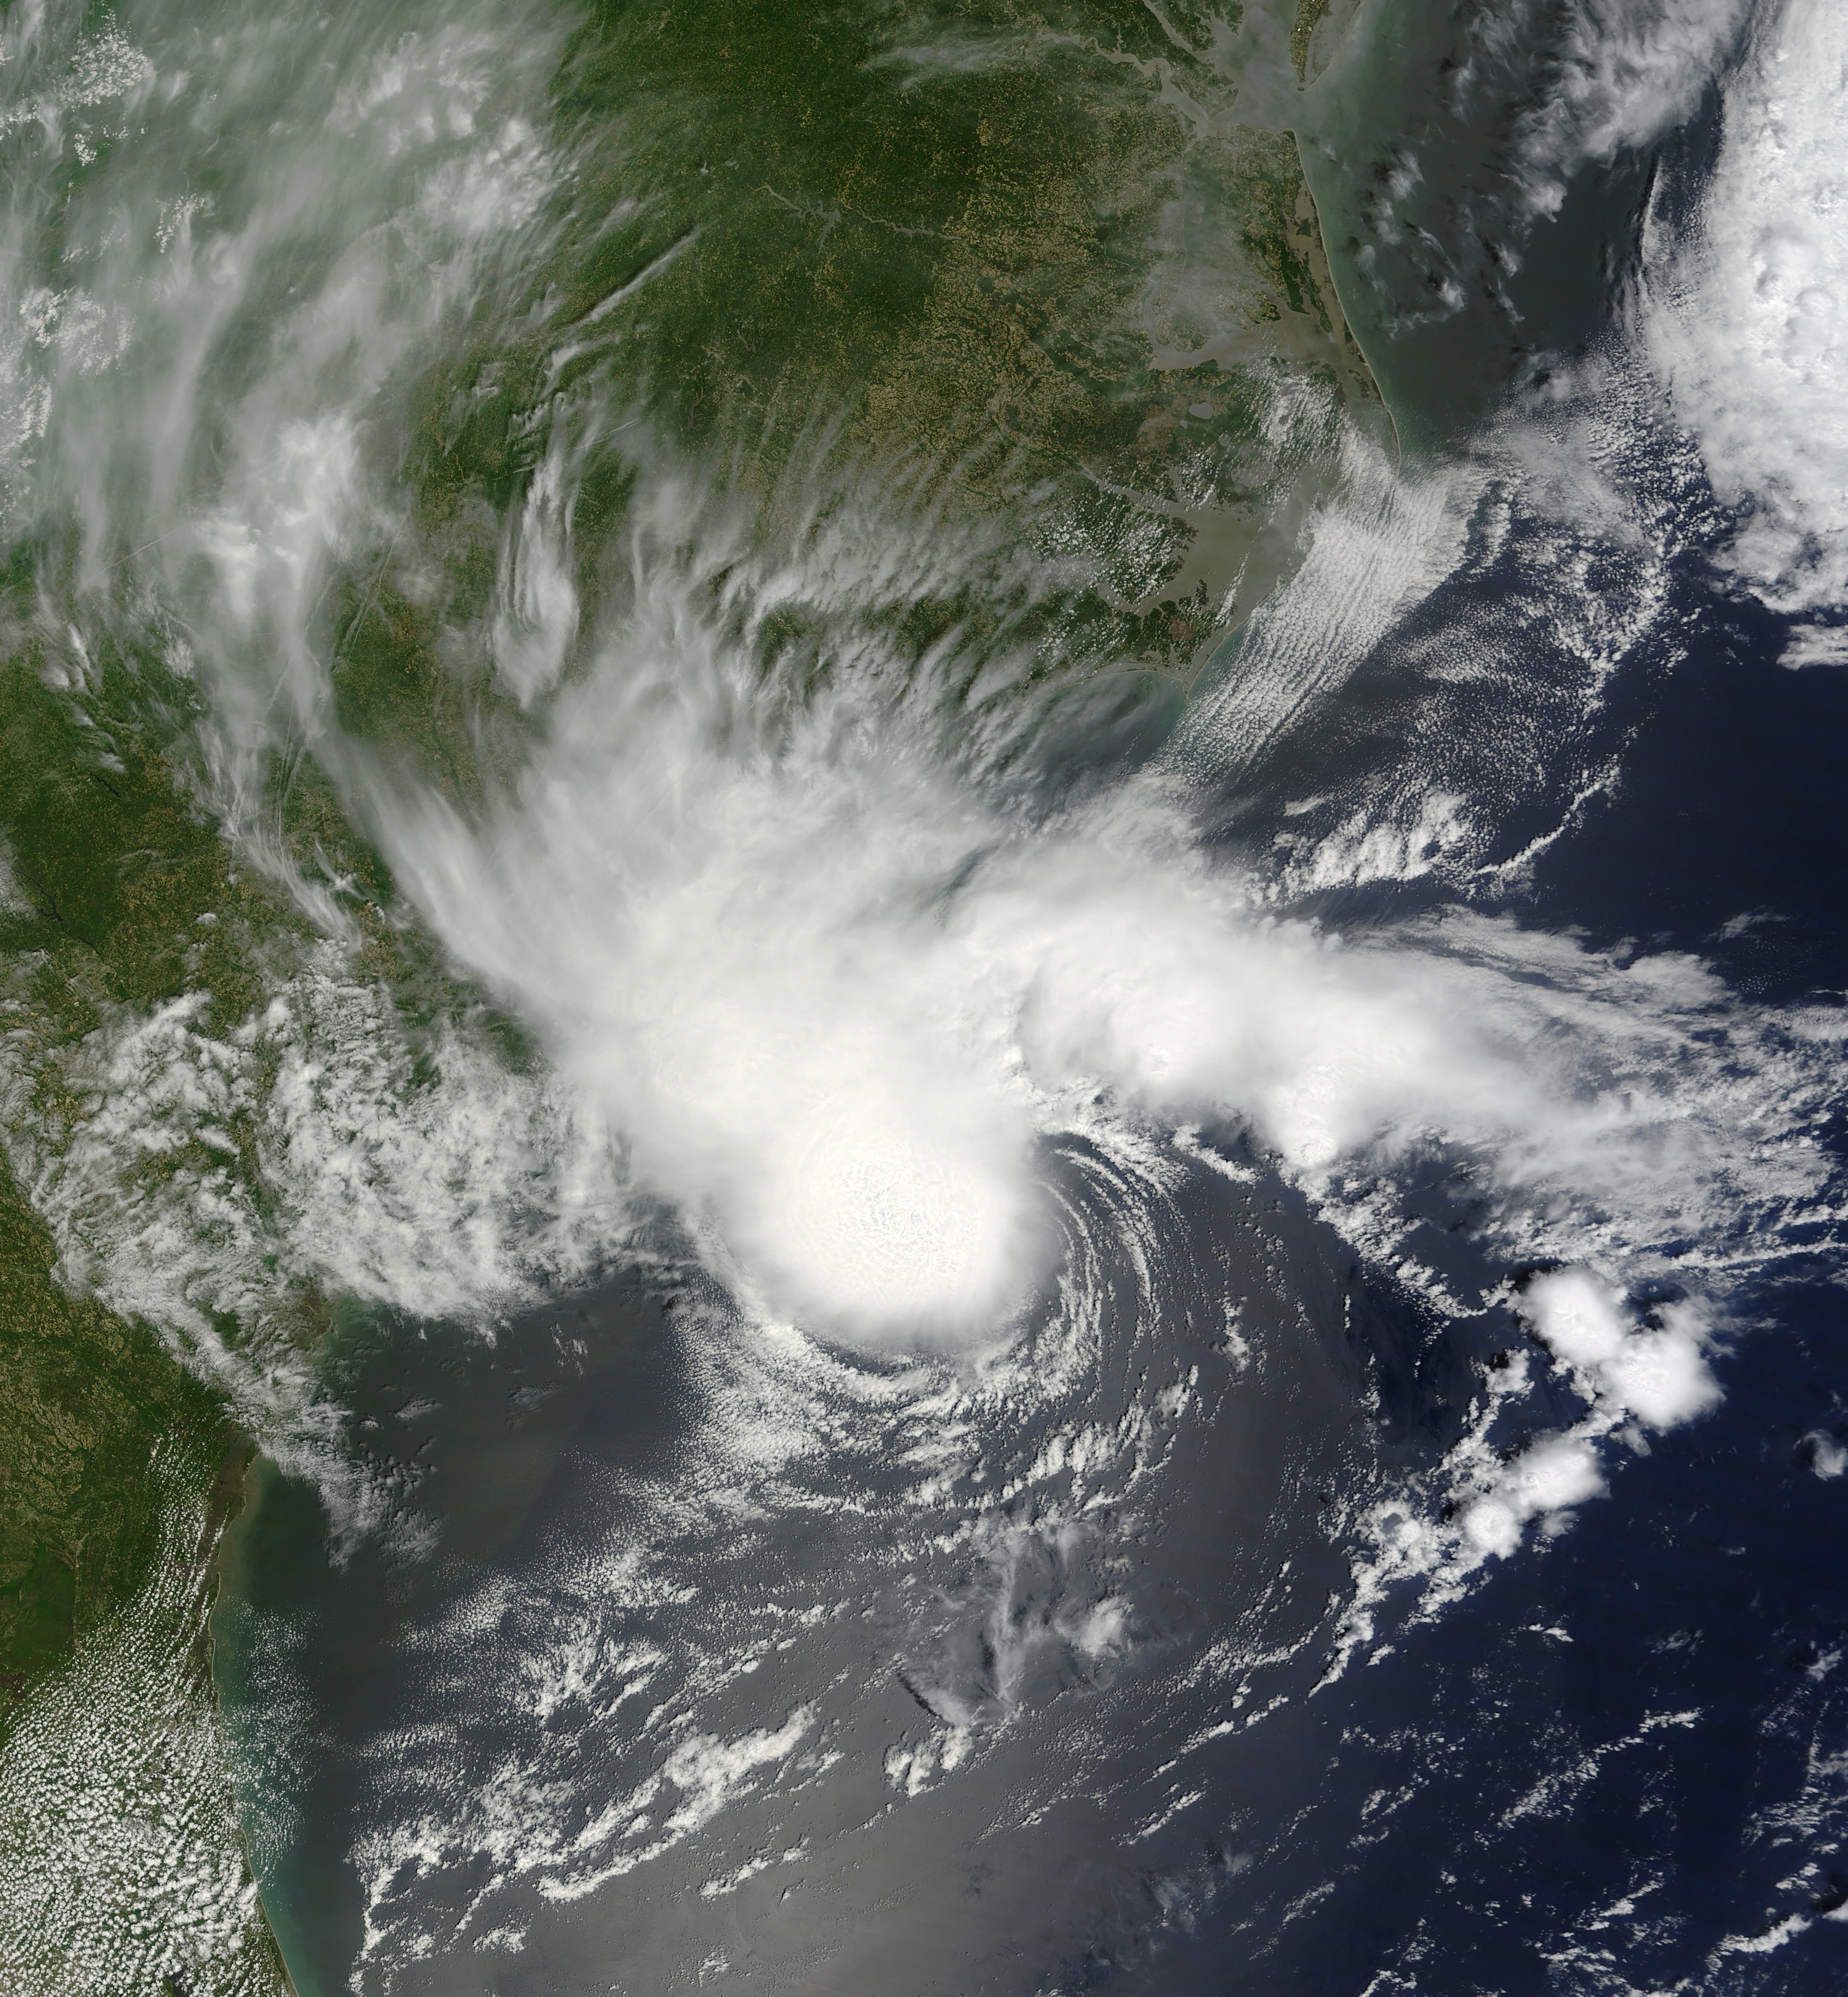
The Bikini Bottom Hurricane Warning Center began investigating a low-level circulation developing to the northeast of Katie; it quickly strengthened into Tropical Depression Twelve. A couple hours later, the depression was upgraded into Tropical Storm Lee. Lee was forecast to bring severe flooding to Rina Bottom. This became true when Lee strengthened into a very severe and strong tropical storm on the September 19 and hit Rina Bottom on September 20, deluging the islands with 12 successive hours of flooding, power outages, storm surges and tornadoes. Afterwards, Lee continued progressing northwards, but it spawned a lot of thunderstorms. In the end, Rina Bottom endured the thunderstorms until September 26. All in all, Lee killed 50 people, making it a very deadly tropical storm.
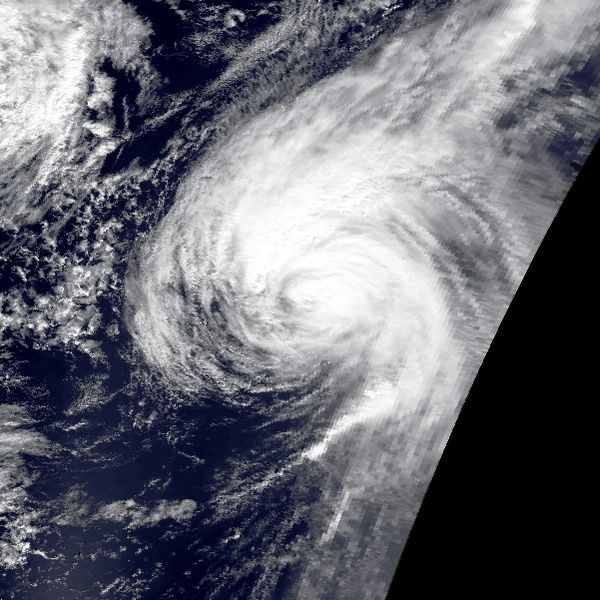
Hurricane Muriel[]
| Category 2 hurricane (SSHWS) | |
 | |
| Duration | September 22 – October 1 |
|---|---|
| Peak intensity | 105 mph (165 km/h) (1-min) 973 mbar (hPa) |
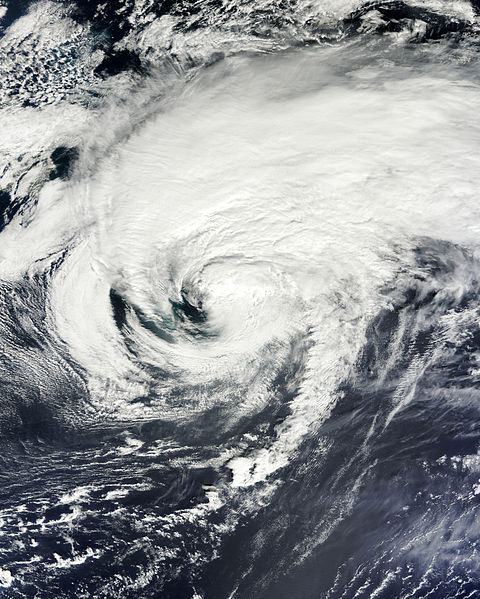
On September 20, as Tropical Storm Lee was affecting Rina Bottom, the Bikini Bottom Hurricane Center began monitoring another tropical wave. On September 22, the wave developed into Tropical Depression Thirteen; it later strengthened into Tropical Storm Muriel a couple hours later. Muriel then reached its peak intensity of 105 mph on September 26. Muriel later weakened into a tropical storm on September 29, before dissipating on October 1.
Tropical Storm Nestor[]
| Tropical storm (SSHWS) | |
 | |
| Duration | September 30 – October 3 |
|---|---|
| Peak intensity | 40 mph (65 km/h) (1-min) 1010 mbar (hPa) |
A tropical wave developed into Tropical Depression Fourteen on September 30 and rapidly strengthened into Tropical Storm Nestor. Nestor formed in an abnormally northwards location, similar to Hurricane Nick of the previous season. Nestor did not strengthen much, but it killed one person from its surf off the coast of Rock Bottom. It later degenerated on October 3.
Tropical Storm Ophelia[]
| Tropical storm (SSHWS) | |
 | |
| Duration | October 8 – October 12 |
|---|---|
| Peak intensity | 50 mph (85 km/h) (1-min) 1005 mbar (hPa) |
On October 7, The Bikini Bottom Weather Center started to investigate a cluster of tropical waves forming off the coast of Bikini Atoll. Five hours later, the wave was upgraded into Tropical Depression Fifteen. The next day, it strengthened into Tropical Storm Ophelia. Ophelia traveled rather quickly up the Bikini Bottom coast, killing ten people while going past Rina and Rock Bottom. Later, Ophelia became extratropical on October 12, 2013.
Hurricane Paul[]
| Category 3 hurricane (SSHWS) | |
 | |
| Duration | October 21 – November 1 |
|---|---|
| Peak intensity | 115 mph (180 km/h) (1-min) 957 mbar (hPa) |
A tropical wave was numbered Tropical Depression Sixteen on October 21, 2013. A couple of hours later, it was declared as Tropical Storm Paul. On October 26, at Category 3 intensity, Paul made landfall at Ukelele Bottom and lasted until October 27. The hurricane dissipated on November 1st as a sub-tropical low, killing 40 people.
Tropical Storm Rita[]
| Tropical storm (SSHWS) | |
 | |
| Duration | October 23 – October 31 |
|---|---|
| Peak intensity | 55 mph (85 km/h) (1-min) 1004 mbar (hPa) |
The Bikini Bottom Hurricane Center began investigating a massive tropical wave forming behind Hurricane Paul. The wave strengthened immediately into Tropical Storm Rita on October 23. Rita made landfall at Rina Bottom on October 29, but did not cause the profound impacts Tropical Storm Lee did earlier in the season. Shortly afterwards, Rita became post-tropical just six miles off of Rock Bottom on October 31.
Tropical Storm Stan[]
| Tropical storm (SSHWS) | |
 | |
| Duration | November 9 – November 13 |
|---|---|
| Peak intensity | 60 mph (95 km/h) (1-min) 1003 mbar (hPa) |
On November 8, the Bikini Bottom Hurricane Center began monitoring a tropical wave simultaneously ingesting dry and humid air. The next day, it was upgraded into Tropical Depression Eighteen. Two hours later, the depression immediately strengthened into Tropical Storm Stan. Stan was not forecast to strengthen significantly,but it was able to become a strong tropical storm. After five days, Stan dissipated on November 13, after it went over Rock Bottom.