The 2095 Pacific hurricane season was an active season that took place in the Eastern Pacific.
The Season began on May 15, 2095 and ended November 30th, 2095.
This season consisted of 23 depressions, of which, 22 became named storms, 15 became hurricanes and 8 became major hurricanes. One of these storms, Hurricane Ana, formed in the Central Pacific and peaked out as a Category-2 Late on June 30.
The season began with Hurricane Acotas, a Category-2, Forming on May 18 and ending with the Dissipation of Hurricane Wilton, a Category-3, on November 17.
Two storms in the season peaked out as Category-5 storms, both reaching 160 mph (260 km/h) in intensity but with Othello being the most intense of the season.
Many storms made landfall in this season, but the deadliest and costliest by far in the season was Hurricane Sakura, whom made landfall as a Weak Category-4 in North Western Mexico late on October 5, causing $825 million in damage and killing 970 in total. The other Storms landfalling storms of the season were responsible for the other damages and fatalities but where nowhere near as severe as Hurricane Sakura.
Storms[]
Hurricane Acotas[]
| Category 2 hurricane (SSHWS) | |
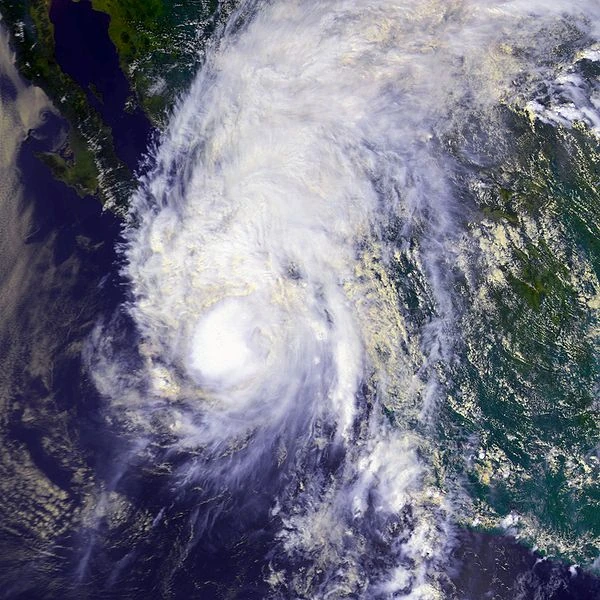 | |
| Duration | May 18 – May 24 |
|---|---|
| Peak intensity | 100 mph (155 km/h) (1-min) 967 mbar (hPa) |
Tropical Depression Two-E[]
| Tropical depression (SSHWS) | |
 | |
| Duration | May 26 – May 27 |
|---|---|
| Peak intensity | 35 mph (55 km/h) (1-min) 1004 mbar (hPa) |
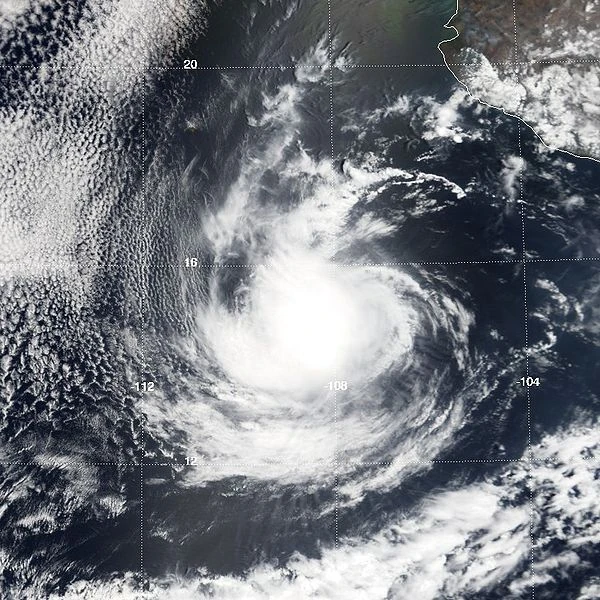
Hurricane Benicia[]
| Category 1 hurricane (SSHWS) | |
 | |
| Duration | May 31 – June 6 |
|---|---|
| Peak intensity | 90 mph (150 km/h) (1-min) 972 mbar (hPa) |
Tropical Storm Chung[]
| Tropical storm (SSHWS) | |
 | |
| Duration | June 13 – June 16 |
|---|---|
| Peak intensity | 45 mph (75 km/h) (1-min) 1000 mbar (hPa) |
Hurricane Darlita[]
| Category 1 hurricane (SSHWS) | |
 | |
| Duration | June 20 – June 24 |
|---|---|
| Peak intensity | 75 mph (120 km/h) (1-min) 987 mbar (hPa) |
Hurricane Ephraim[]
| Category 4 hurricane (SSHWS) | |
 | |
| Duration | June 21 – June 30 |
|---|---|
| Peak intensity | 145 mph (230 km/h) (1-min) 936 mbar (hPa) |
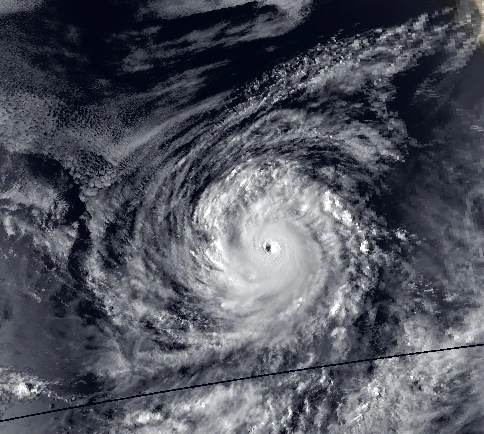
Hurricane Fjola[]
| Category 5 hurricane (SSHWS) | |
 | |
| Duration | June 26 – July 5 |
|---|---|
| Peak intensity | 160 mph (260 km/h) (1-min) 917 mbar (hPa) |
Hurricane Ana[]
| Category 2 hurricane (SSHWS) | |
 | |
| Duration | June 28 – July 4 (Crossed into Western Pacific) |
|---|---|
| Peak intensity | 105 mph (165 km/h) (1-min) 963 mbar (hPa) |
Ana formed in the central pacific and crossed into the Western Pacific as a Dying TD.
Hurricane Gilmore[]
| Category 1 hurricane (SSHWS) | |
 | |
| Duration | July 6 – July 11 |
|---|---|
| Peak intensity | 85 mph (140 km/h) (1-min) 980 mbar (hPa) |
Tropical Storm Hamako[]
| Tropical storm (SSHWS) | |
 | |
| Duration | July 17 – July 21 |
|---|---|
| Peak intensity | 65 mph (100 km/h) (1-min) 990 mbar (hPa) |
Tropical Storm Ismet[]
| Tropical storm (SSHWS) | |
 | |
| Duration | July 25 – July 30 |
|---|---|
| Peak intensity | 65 mph (100 km/h) (1-min) 991 mbar (hPa) |
Hurricane Jailene[]
| Category 4 hurricane (SSHWS) | |
 | |
| Duration | July 31 – August 7 |
|---|---|
| Peak intensity | 150 mph (240 km/h) (1-min) 929 mbar (hPa) |
Hurricane Kapena[]
| Category 3 hurricane (SSHWS) | |
 | |
| Duration | August 6 – August 13 |
|---|---|
| Peak intensity | 125 mph (205 km/h) (1-min) 947 mbar (hPa) |
Hurricane Lilac[]
| Category 3 hurricane (SSHWS) | |
 | |
| Duration | August 19 – August 25 |
|---|---|
| Peak intensity | 120 mph (195 km/h) (1-min) 953 mbar (hPa) |
Hurricane Merric[]
| Category 2 hurricane (SSHWS) | |
 | |
| Duration | August 24 – September 1 |
|---|---|
| Peak intensity | 110 mph (175 km/h) (1-min) 961 mbar (hPa) |
Tropical Storm Nerina[]
| Tropical storm (SSHWS) | |
 | |
| Duration | August 31 – September 4 |
|---|---|
| Peak intensity | 70 mph (110 km/h) (1-min) 988 mbar (hPa) |
Hurricane Othello[]
| Category 5 hurricane (SSHWS) | |
 | |
| Duration | September 2 – September 23 |
|---|---|
| Peak intensity | 160 mph (260 km/h) (1-min) 914 mbar (hPa) |
Hurricane Pieta[]
| Category 2 hurricane (SSHWS) | |
 | |
| Duration | September 10 – September 15 |
|---|---|
| Peak intensity | 100 mph (155 km/h) (1-min) 969 mbar (hPa) |
Tropical Storm Rhett[]
| Tropical storm (SSHWS) | |
 | |
| Duration | September 23 – September 26 |
|---|---|
| Peak intensity | 40 mph (65 km/h) (1-min) 1001 mbar (hPa) |
Hurricane Sakura[]
| Category 4 hurricane (SSHWS) | |
 | |
| Duration | September 30 – October 7 |
|---|---|
| Peak intensity | 135 mph (215 km/h) (1-min) 941 mbar (hPa) |
Tropical Storm Terrel[]
| Tropical storm (SSHWS) | |
 | |
| Duration | October 19 – October 22 |
|---|---|
| Peak intensity | 50 mph (85 km/h) (1-min) 996 mbar (hPa) |
Tropical Storm Varali[]
| Tropical storm (SSHWS) | |
 | |
| Duration | October 28 – October 31 |
|---|---|
| Peak intensity | 45 mph (75 km/h) (1-min) 999 mbar (hPa) |
Hurricane Wilton[]
| Category 3 hurricane (SSHWS) | |
 | |
| Duration | November 11 – November 17 |
|---|---|
| Peak intensity | 115 mph (185 km/h) (1-min) 959 mbar (hPa) |
Timeline[]
