The 2011 Atlantic hurricane season was an extraordinarily active Atlantic hurricane season that tied with 1887, 1995, 2010, and the subsequent 2012 for the third-highest number of named storms on record. The dates that typically delimit tropical cyclone formation in the North Atlantic are from June 1 to November 30, though the first storm, Arlene, did not develop until nearly a month in. The final storm, Sean, dissipated in mid-November. Despite somewhat unfavorable conditions, especially in the Caribbean Sea and Gulf of Mexico, seven storms attained hurricane intensity. In addition, five of those hurricanes (Irene, Katia, Maria, Ophelia, and Rina) became major hurricanes (Category 3 or higher according to the Saffir–Simpson hurricane wind scale). Hurricane Katia peaked with the highest maximum winds (150 miles per hour), though Hurricane Irene reached overall peak with a minimum pressure of 934 millibars. Operationally, the season achieved a maximum number of 18 total storms plus a supplemental tropical depression, though in post-analysis the National Hurricane Center determined a previously unnamed tropical storm briefly existed near Newfoundland in early September.
Due to the presence of a La Niña in the Pacific Ocean, many pre-season forecasts called for an above-average hurricane season. In Colorado State University (CSU)'s spring outlook, the organization called for 16 named storms and 9 hurricanes, of which 4 would intensify further into major hurricanes. On May 19, 2011, the National Oceanic and Atmospheric Administration (NOAA) issued their pre-season forecast, predicting 12–18 named storms, 6–10 hurricanes, and 3–6 major hurricanes. Following a quick start to the season, NOAA subsequently increased their outlook to 14–19 named storms, 7–10 hurricanes, and 3–5 major hurricanes on August 4; CSU made no changes to the number of cyclones forecast throughout the year.
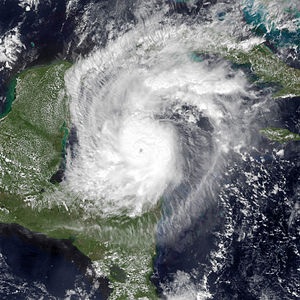
Most tropical cyclones affected land at some point this season, though only some caused catastrophic damage. In late June, Tropical Storm Arlene caused moderate damage and up to 20 fatalities when it moved ashore eastern Mexico. Approximately a month later, Tropical Storm Don struck Texas, causing extensive flooding in the Brownsville area. In August, Hurricane Harvey struck central America, causing up to 30 fatalities and millions of dollars in losses. In addition, Hurricane Emily struck eastern Cuba at minimal hurricane strength and caused torrential rainfall and mudslides in Haiti. In September, Hurricane Katia struck the United Kingdom as an unusually vicious extratropical cyclone, inducing widespread destruction. Later that month, Tropical Storm Lee and Hurricane Nate caused losses in the United States and Mexico, respectively. As Lee moved across Louisiana, its vast circulation dropped torrential precipitation, leading to extensive damage.
In late September, Hurricane Ophelia passed near Bermuda as a major hurricane, subjecting the territory to hurricane-force wind gusts for hours, while both Ophelia and the preceding Hurricane Maria struck Newfoundland, compounding damage from Hurricane Igor the year prior. In October, Hurricane Rina brushed the Mexican state of Quintana Roo and later made landfall near Port Charlotte, Florida at minimal hurricane strength - the first hurricane to strike the state since Hurricane Wilma. However, the costliest and deadliest hurricane this season formed east of the Leeward Islands in mid-August. Hurricane Irene struck the Bahamas at peak strength, prior to turning north and advancing up the East Coast of the United States. Irene later made landfall in North Carolina at Category 3 strength, the first storm of such a strength to strike the United States since Hurricane Wilma of 2005, ultimately resulting in the name's retirement. Collectively, the storms this season caused over $22.6 billion in damage and approximately 152 fatalities.
Seasonal Forecasts[]
| Source | Date | Named | Hurricanes | Major |
|---|---|---|---|---|
| Average (1981–2010) | 12.1 | 6.4 | 2.7 | |
| Record high activity | 28 | 15 | 7 | |
| Record low activity | 4 | 2† | 0 | |
| ––––––––––––––––––––––––––––––––––––––––––––––––––––––– | ||||
| TSR | December 16, 2010 | 13 | 5 | 2 |
| TSR | April 5, 2011 | 12 | 6 | 2 |
| CSU | April 14, 2011 | 13 | 6 | 2 |
| NCSU | April 15, 2011 | 15-18 | 8-11 | 3-5 |
| UKMO | May 12, 2011 | 14 | 8 | N/A |
| NOAA | May 31, 2011 | 15 | 8 | 3 |
| TSR | June 6, 2011 | 14 | 8 | 4 |
| WSI | June 8, 2011 | 16 | 9 | 3 |
| NOAA | August 4, 2011 | 15-17 | 6-9 | 3-4 |
| TSR | August 4, 2011 | 16 | 8 | 4 |
| WSI | September 11, 2011 | 20 | 11 | 6 |
| Actual activity |
19 | 11 | 5 | |
| * June–November only † Most recent of several such occurrences. (See all) | ||||
Overview[]

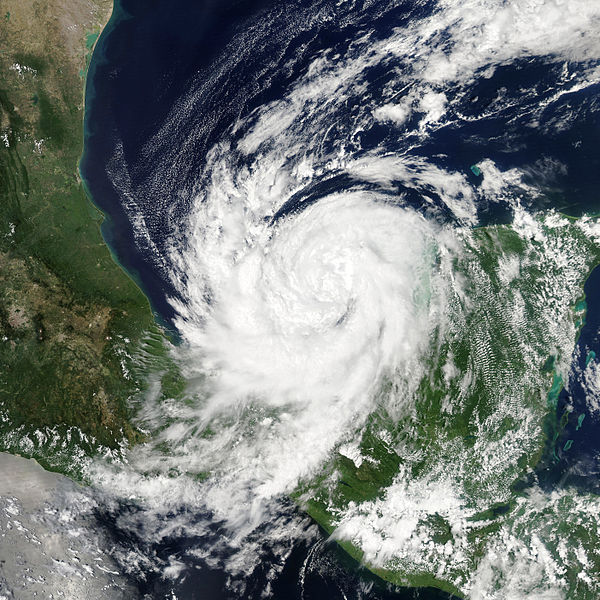
The season commenced with Tropical Storm Arlene, a near hurricane-strength tropical cyclone that formed in the Bay of Campeche and eventually made landfall in Veracruz. Hurricane Bret followed in mid-July, brushing the island nation of Bermuda with minimal impact. Operationally a strong tropical storm, Bret was later upgraded in post-season analysis. Tropical Storm Cindy subsequently followed, attaining a near hurricane-strength intensity, later dissipating without affecting land. In late July came Tropical Storm Don, which eventually stuck the U.S. state of Texas, alleviating drought conditions there. At the start of August was Hurricane Emily, a compact storm that crossed the Leeward Islands and eventually made landfall in eastern Cuba at peak intensity. Following Emily was a storm with an ephemeral life - Franklin - of which later dissipated, never striking land. Tropical Storm Gert came shortly after, brushing the island of Bermuda but causing no known damage. In late August, Hurricane Harvey caused extensive damage in Nicaragua after making landfall there.
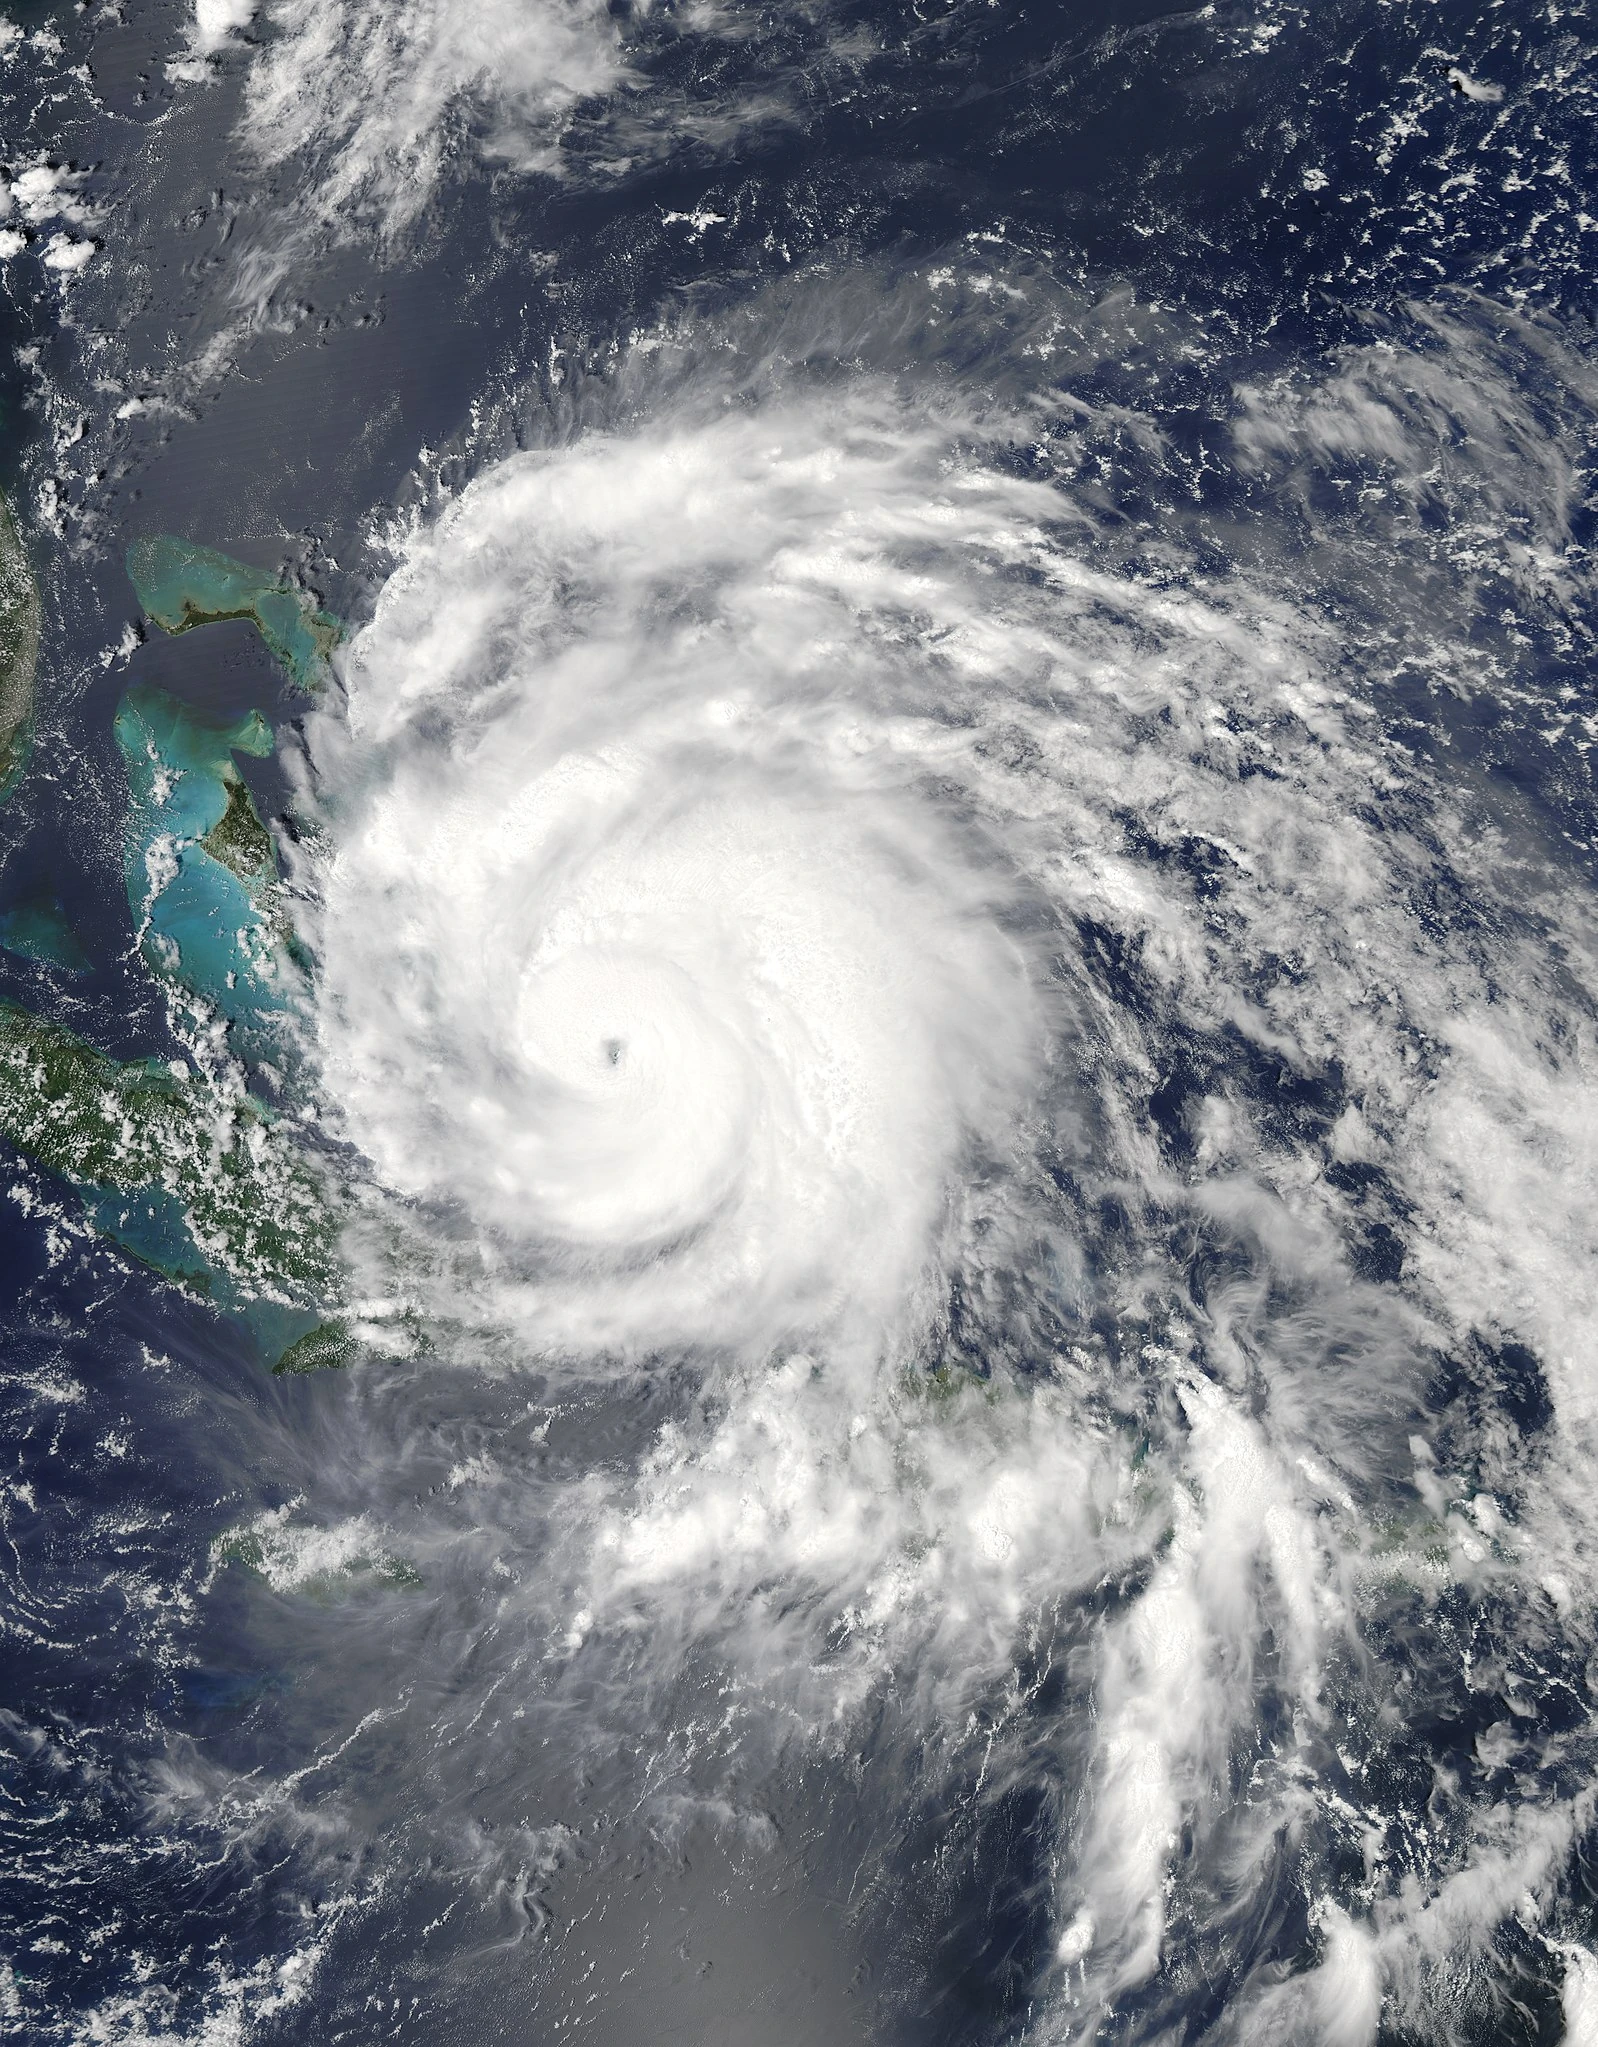
Hurricane Irene damage in North Carolina.
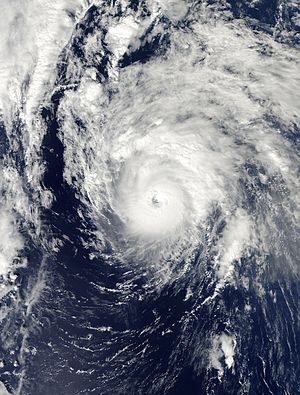
The next storm, Hurricane Irene, was the strongest, costliest, and deadliest tropical cyclone of the season. Developing northeast of the Leeward Islands on August 20, Irene caused significant damage across many Caribbean Islands and United States Eastern Seaboard, ultimately resulting in the name's retirement. A briefly-lived Tropical Depression Ten formed near Cape Verde days later. Another storm, Jose, formed near Bermuda and later brushed the territory prior to dissipating. Jose's successor was Katia, an exceedingly powerful Cape Verde-type major hurricane that had substantial impact across the British Isles as an extratropical cyclone. In post-analysis, the National Hurricane Center determined an unnamed tropical storm existed for three days in early September south of Atlantic Canada. Tropical Storm Lee followed, with its large circulation enveloping nearly all of the United States Gulf Coast from Texas to the Florida panhandle, causing considerable damage. Subsequent to Lee was Hurricane Maria, another Cape Verde hurricane that struck the Leeward Islands, Bermuda, and, eventually, Newfoundland.
Hurricane Nate was a rapidly intensifying tropical cyclone that formed in the Bay Campeche, ultimately making landfall in Veracruz. The next storm, Ophelia, was a powerful Cape Verde hurricane that passed through the Leeward Islands, Bermuda, Newfoundland, and United Kingdom. Ophelia had the most crucial impact in Bermuda, having passed close to the territory while near peak intensity. In late September, a long-lived Hurricane Philippe formed near Cape Verde and drifted erratically, alternating several times between tropical storm and hurricane intensity. In late October was Hurricane Rina, which threatened to strike the Yucatán Peninsula as a major hurricane and eventually made landfall in Florida, the first hurricane to strike the state since a storm in 2005. The final storm of the season, Sean, formed in early November and brushed Bermuda with primarily minimal impact.
Activity[]
The Atlantic hurricane season officially began on June 1, 2011. However, the first storm, Arlene, did not develop until nearly a month in - forming on June 28, 2011. This year was above-average with a total of 20 tropical cyclones, with all but one tropical depression attaining storm-force winds. A further eleven became hurricanes, and five of these intensified to major hurricane status. Due to a particularly strong La Niña in the equatorial Pacific Ocean - activity was well above-average, matching the same number of named storms as depicted in the previous season. This season, five hurricanes and an additional five tropical storms made landfall, culminating in approximately $22.6 billion in damages and 152 fatalities. Hurricanes Bret and Katia also caused losses and fatalities, despite never making landfall while tropical. The season officially ended November 30, 2011, though the season's final storm - Sean - became extratropical on November 12.
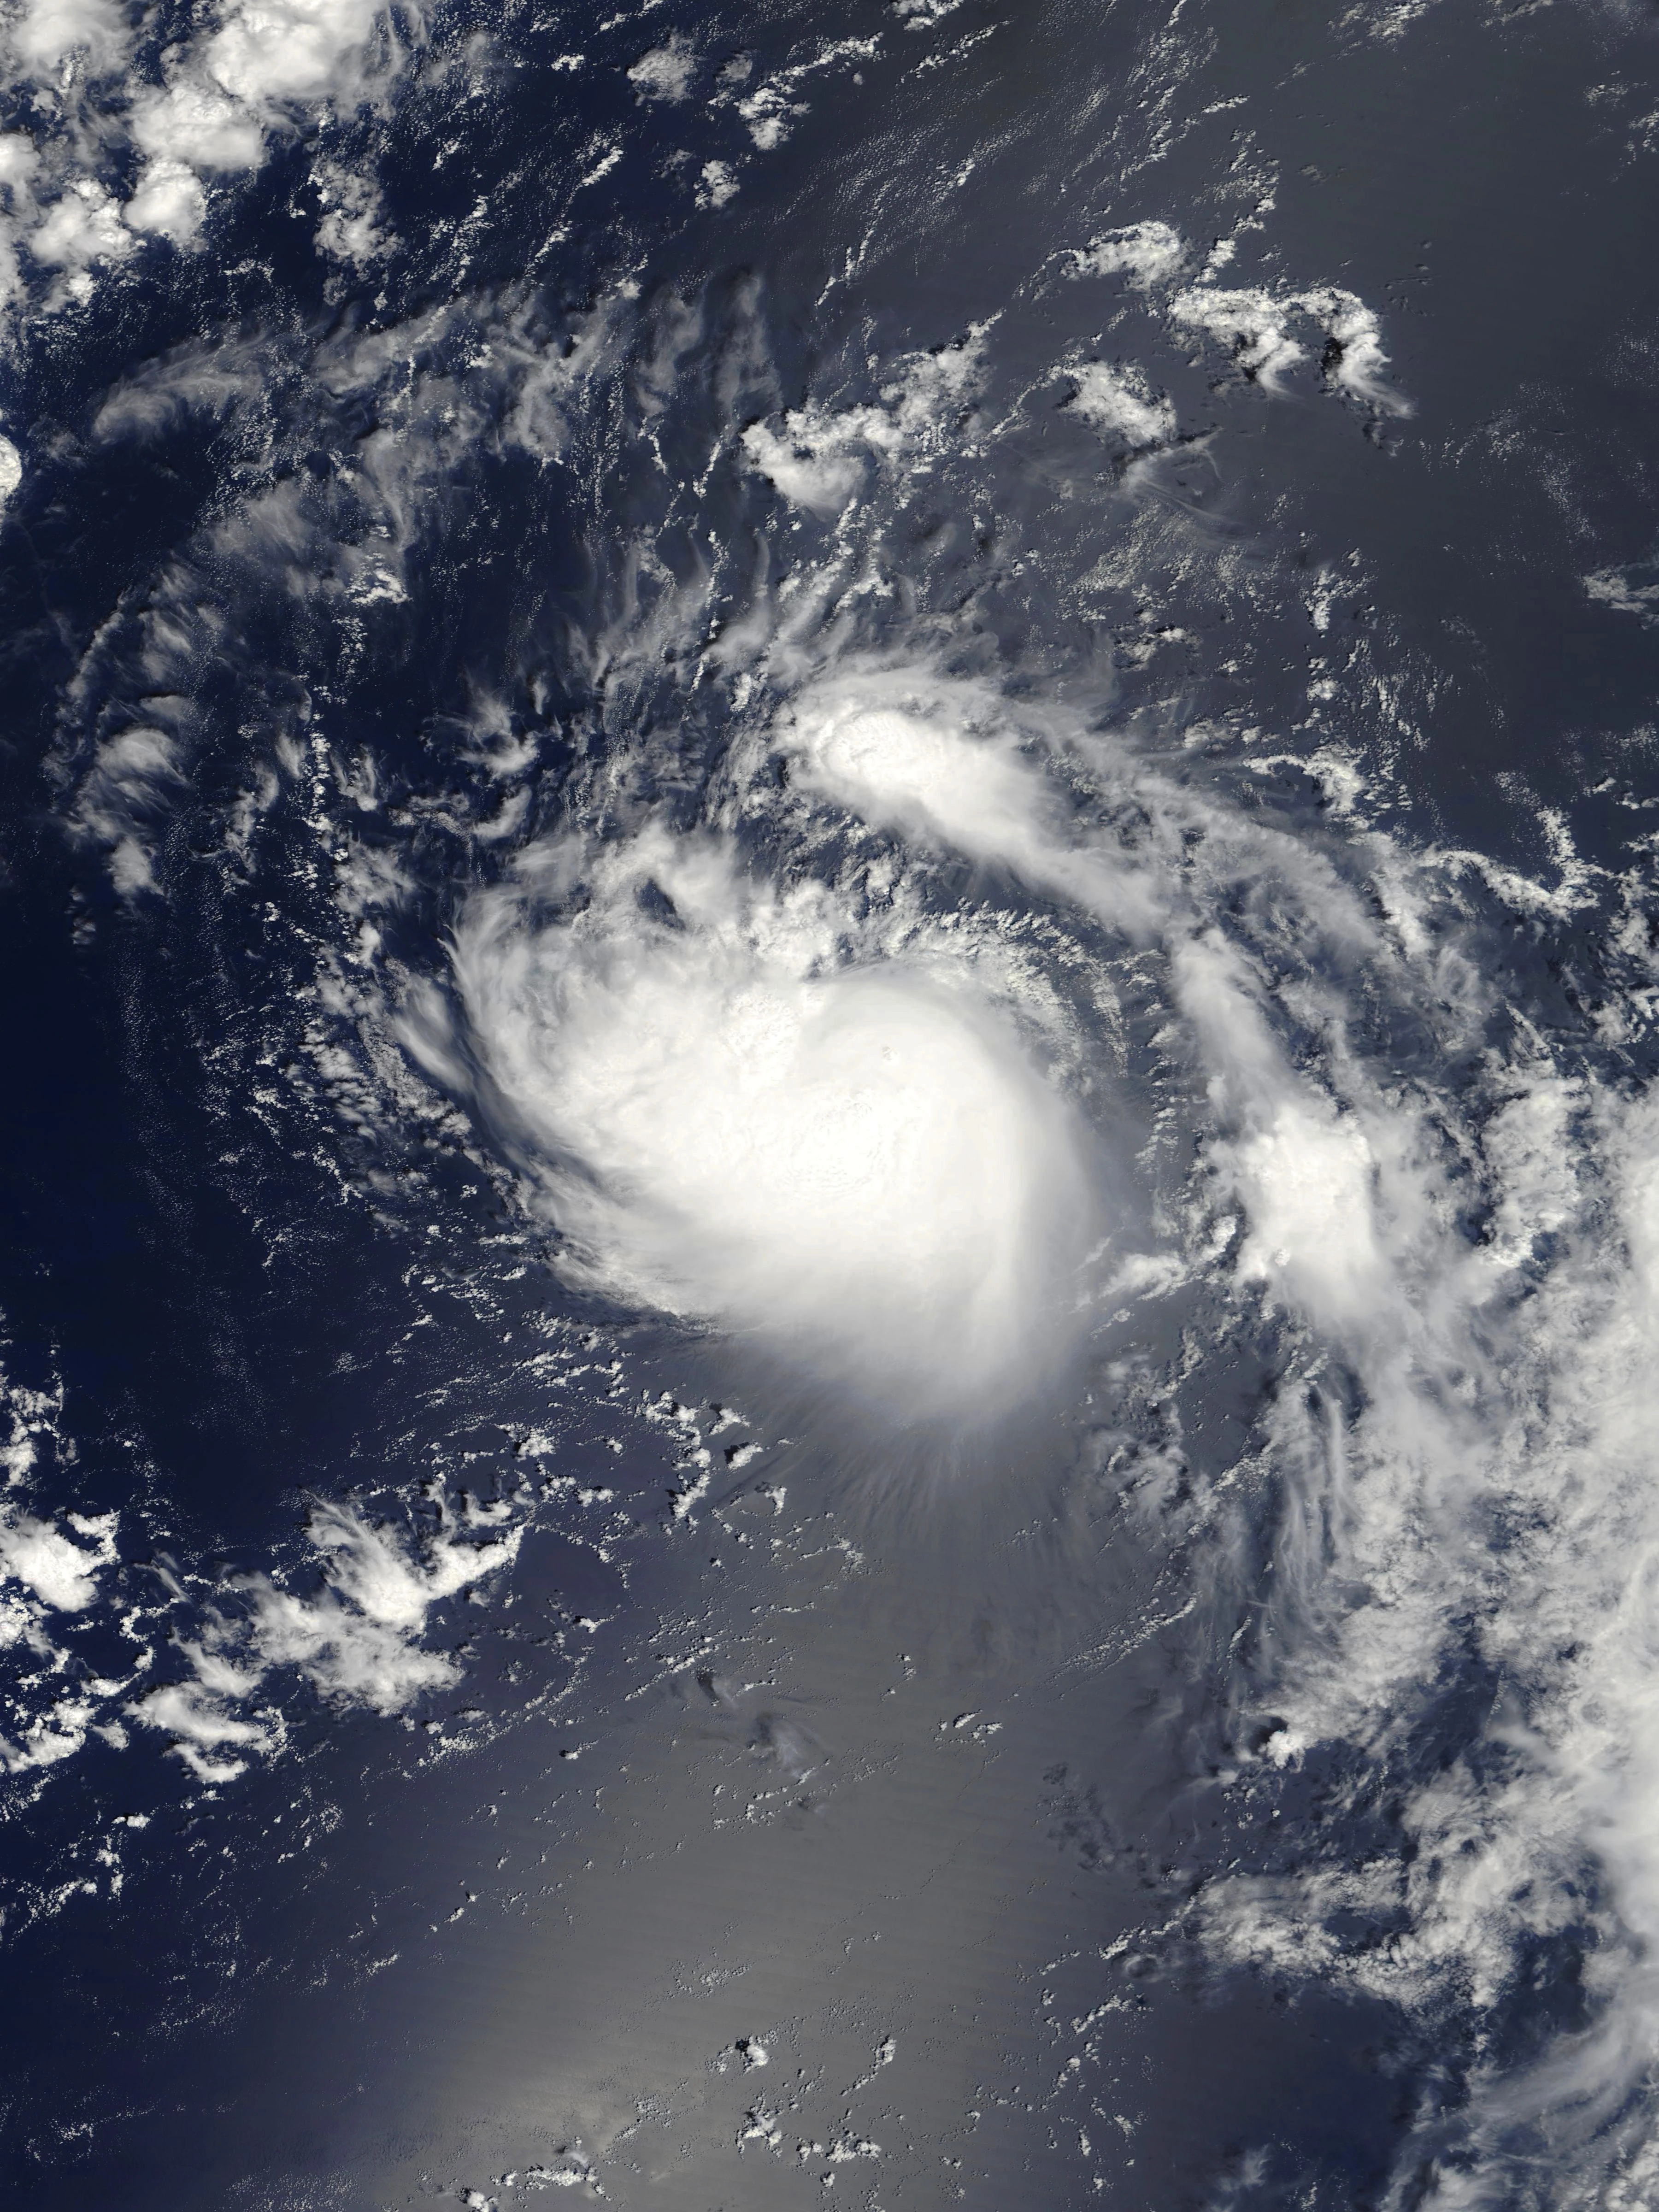
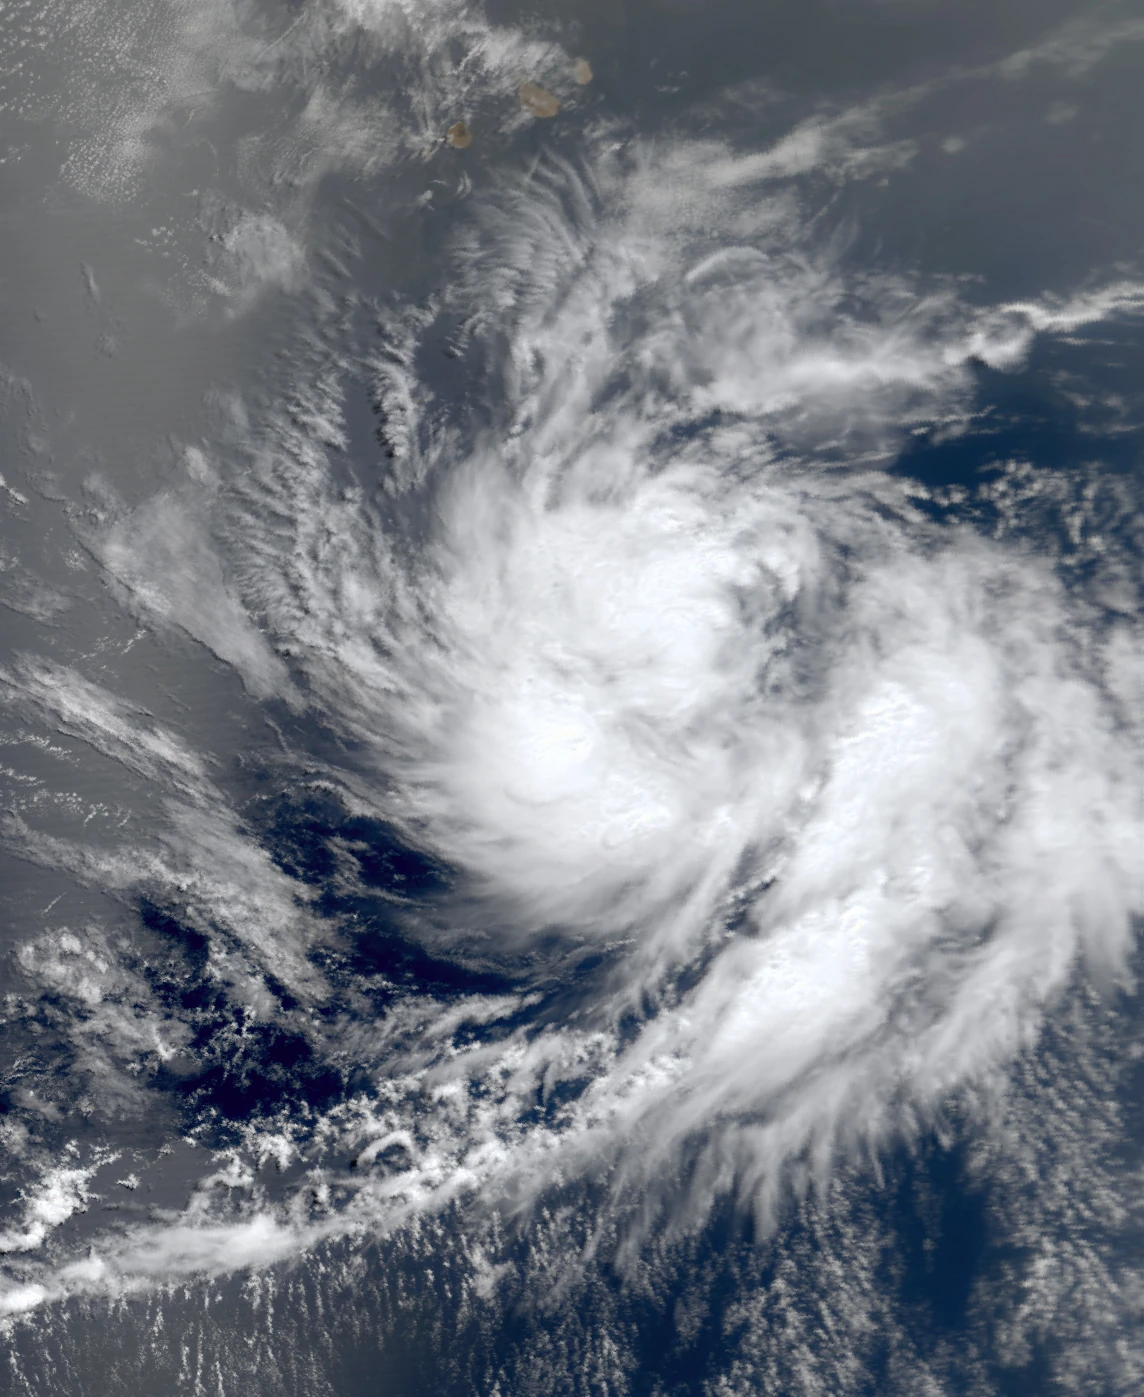
Emily shortly after being classified on August 1.
As mentioned above, tropical cyclogenesis officially began with the development of Tropical Storm Arlene on June 28. July was active, featuring the genesis of the subsequent three named storms - Bret, Cindy, and Don. Bret was the first hurricane in the month since Hurricane Dolly of 2008. August was an unusually active month, with at least seven named storms - Emily, Franklin, Gert, Harvey, Irene, Jose, and Katia - developing during the aforesaid month, only one named storm shy of the record number of eight, set by the 2004 season. Of these seven storms, four became hurricanes and two became major hurricanes, including the most intense storm of the season - Hurricane Irene. In September, six tropical storms formed, with, much like in the previous month, four becoming hurricanes and two becoming major hurricanes. Activity decreased well into October, with the only storm development of the month being Hurricane Rina. 2011 ultimately concluded with Hurricane Sean, which existed for a few days in early November.
Impact[]
The 2011 was destructive, mainly due in part to the effects of Hurricane Irene and Tropical Storm Lee. The United States was particularly hard hit, suffering extensive damage at the mercy of Irene, which caused over $18 billion in damage as it moved up the East Coast - the fifth-costliest hurricane in United States history. Irene struck North Carolina as a Category 3 hurricane; the last storm to strike the United States at such an intensity and deal a great degree of damage was Hurricane Wilma, which struck southern Florida in October 2005. Tropical Storm Lee also caused widespread flooding across the United States Gulf Coast, especially in Louisiana. While inland, the system was also held responsible for additional flooding and a deadly tornado outbreak that swept across the Midwest. In addition, Tropical Storm Don and Hurricane Rina also made landfall in the United States. Total damage from tropical cyclones in the U.S. this year exceed $19 billion, the most destructive season for the country since 2008.
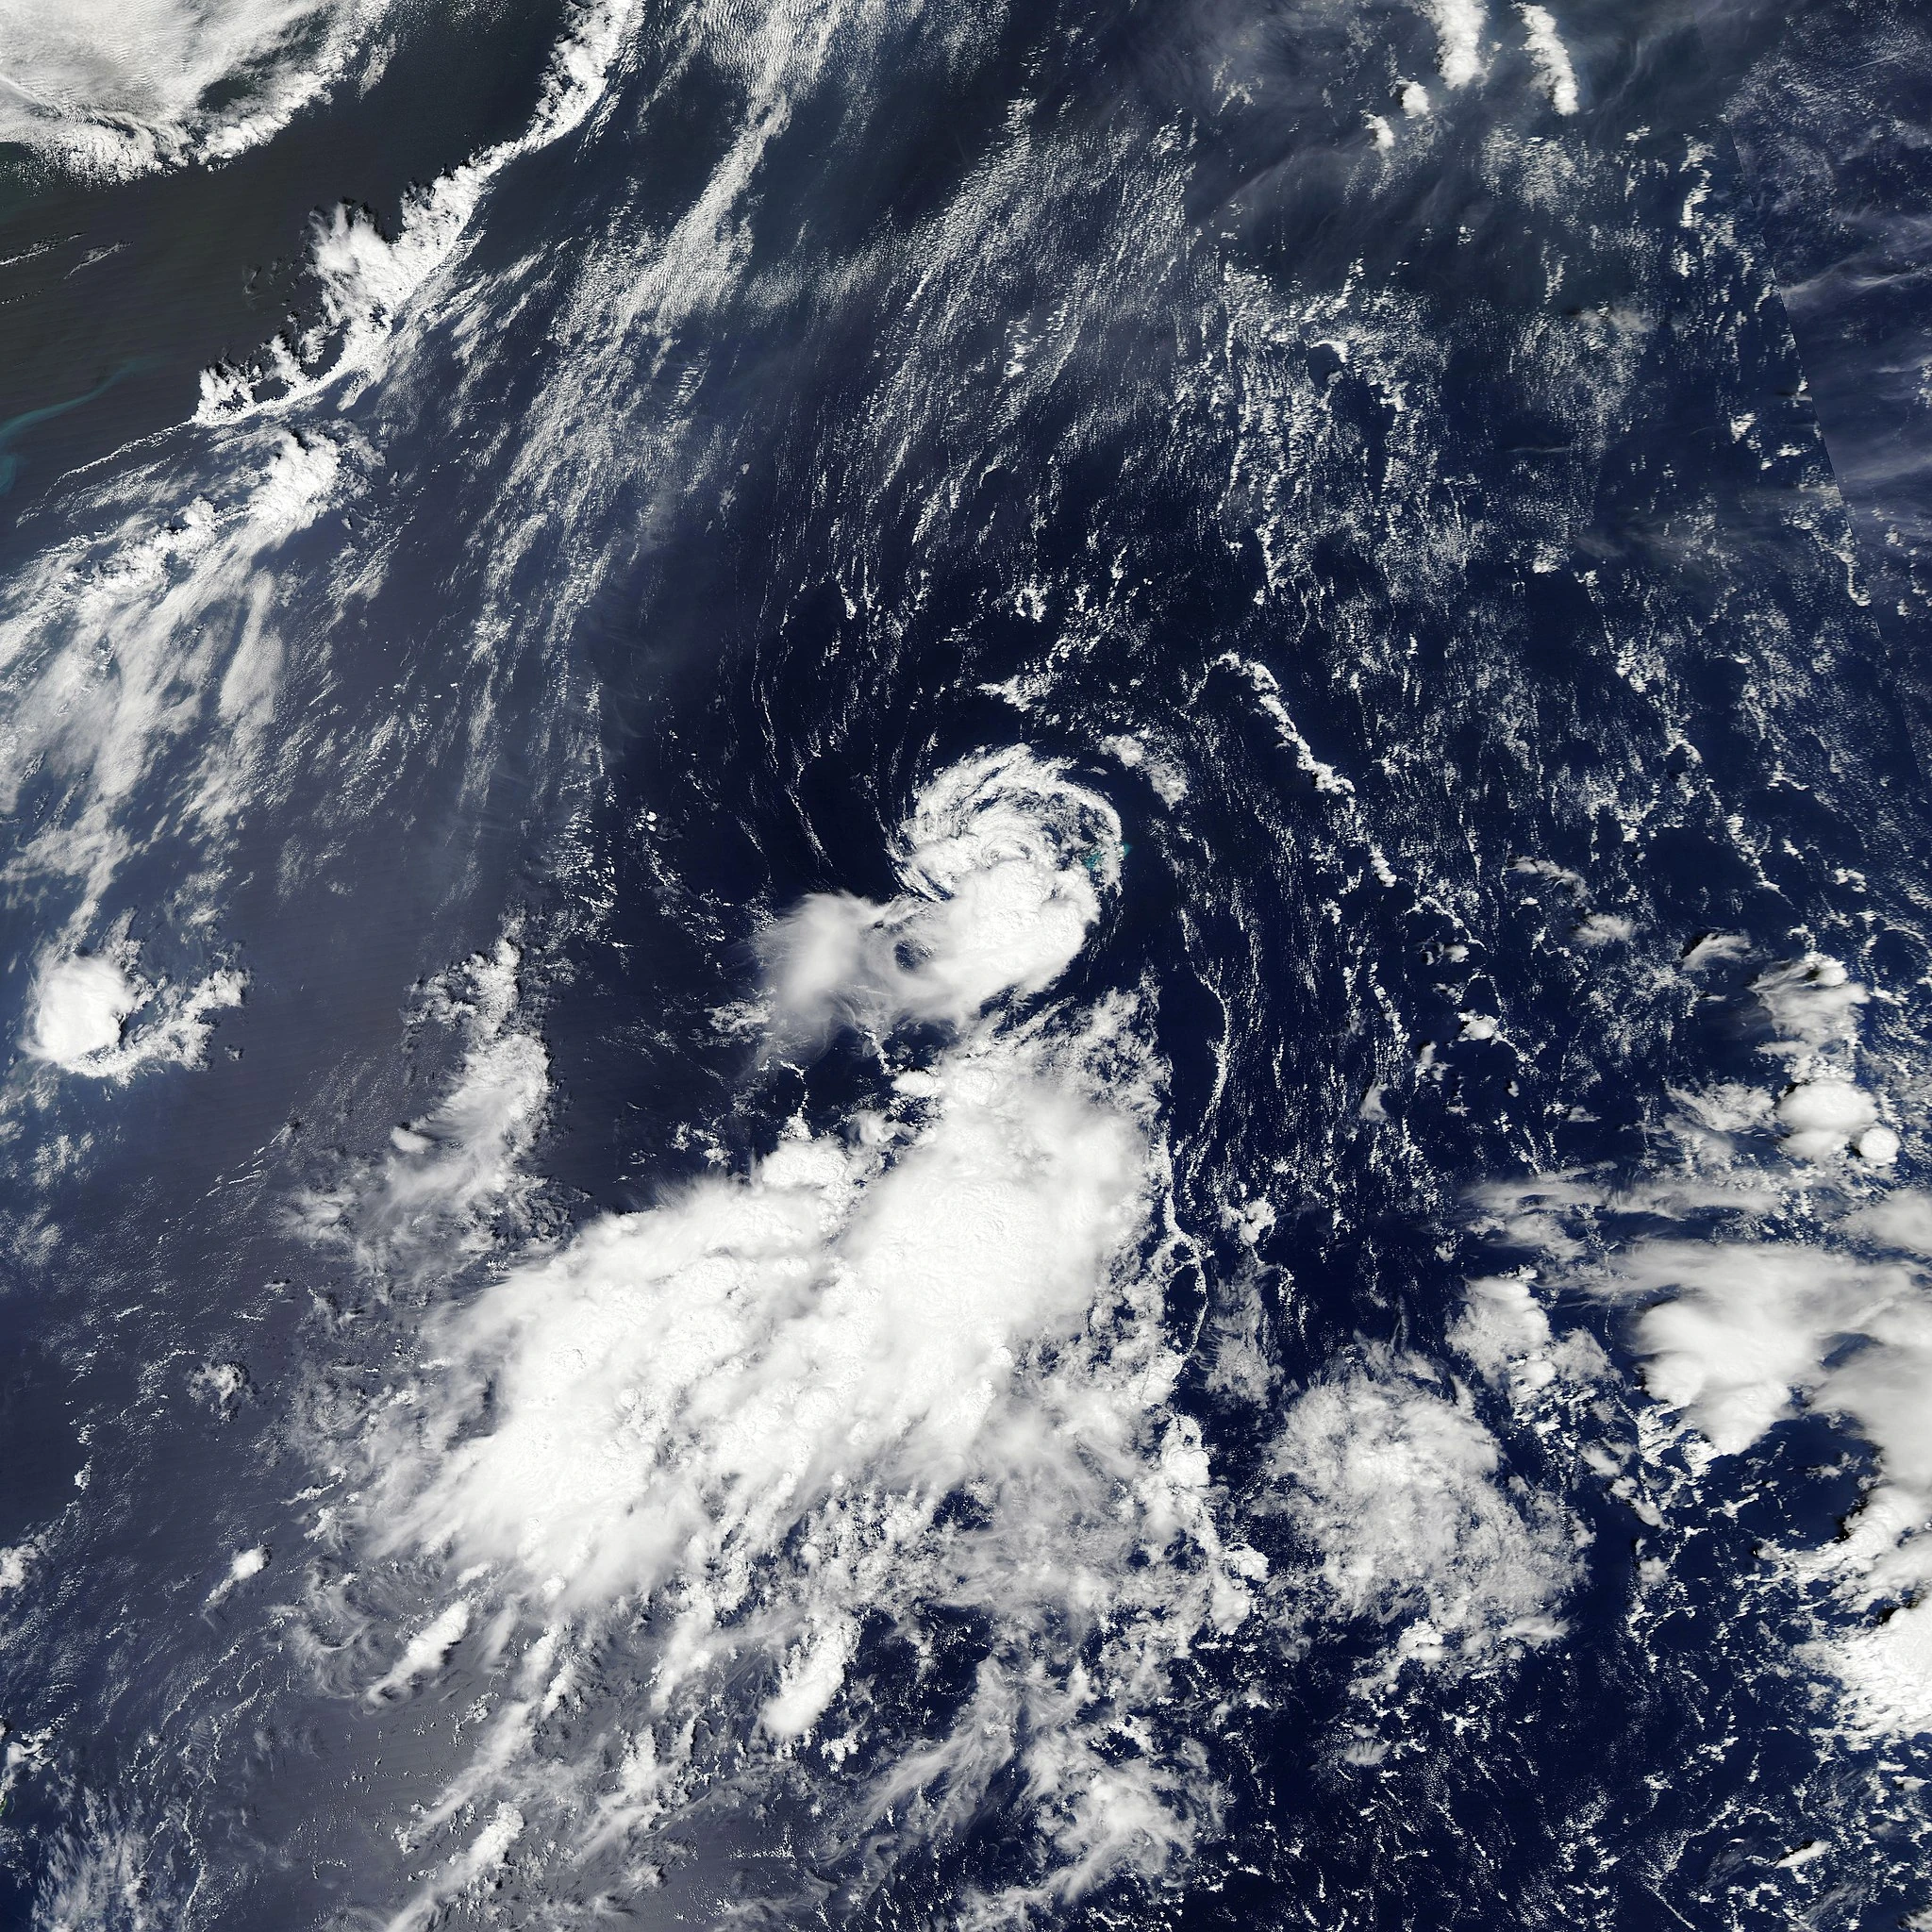
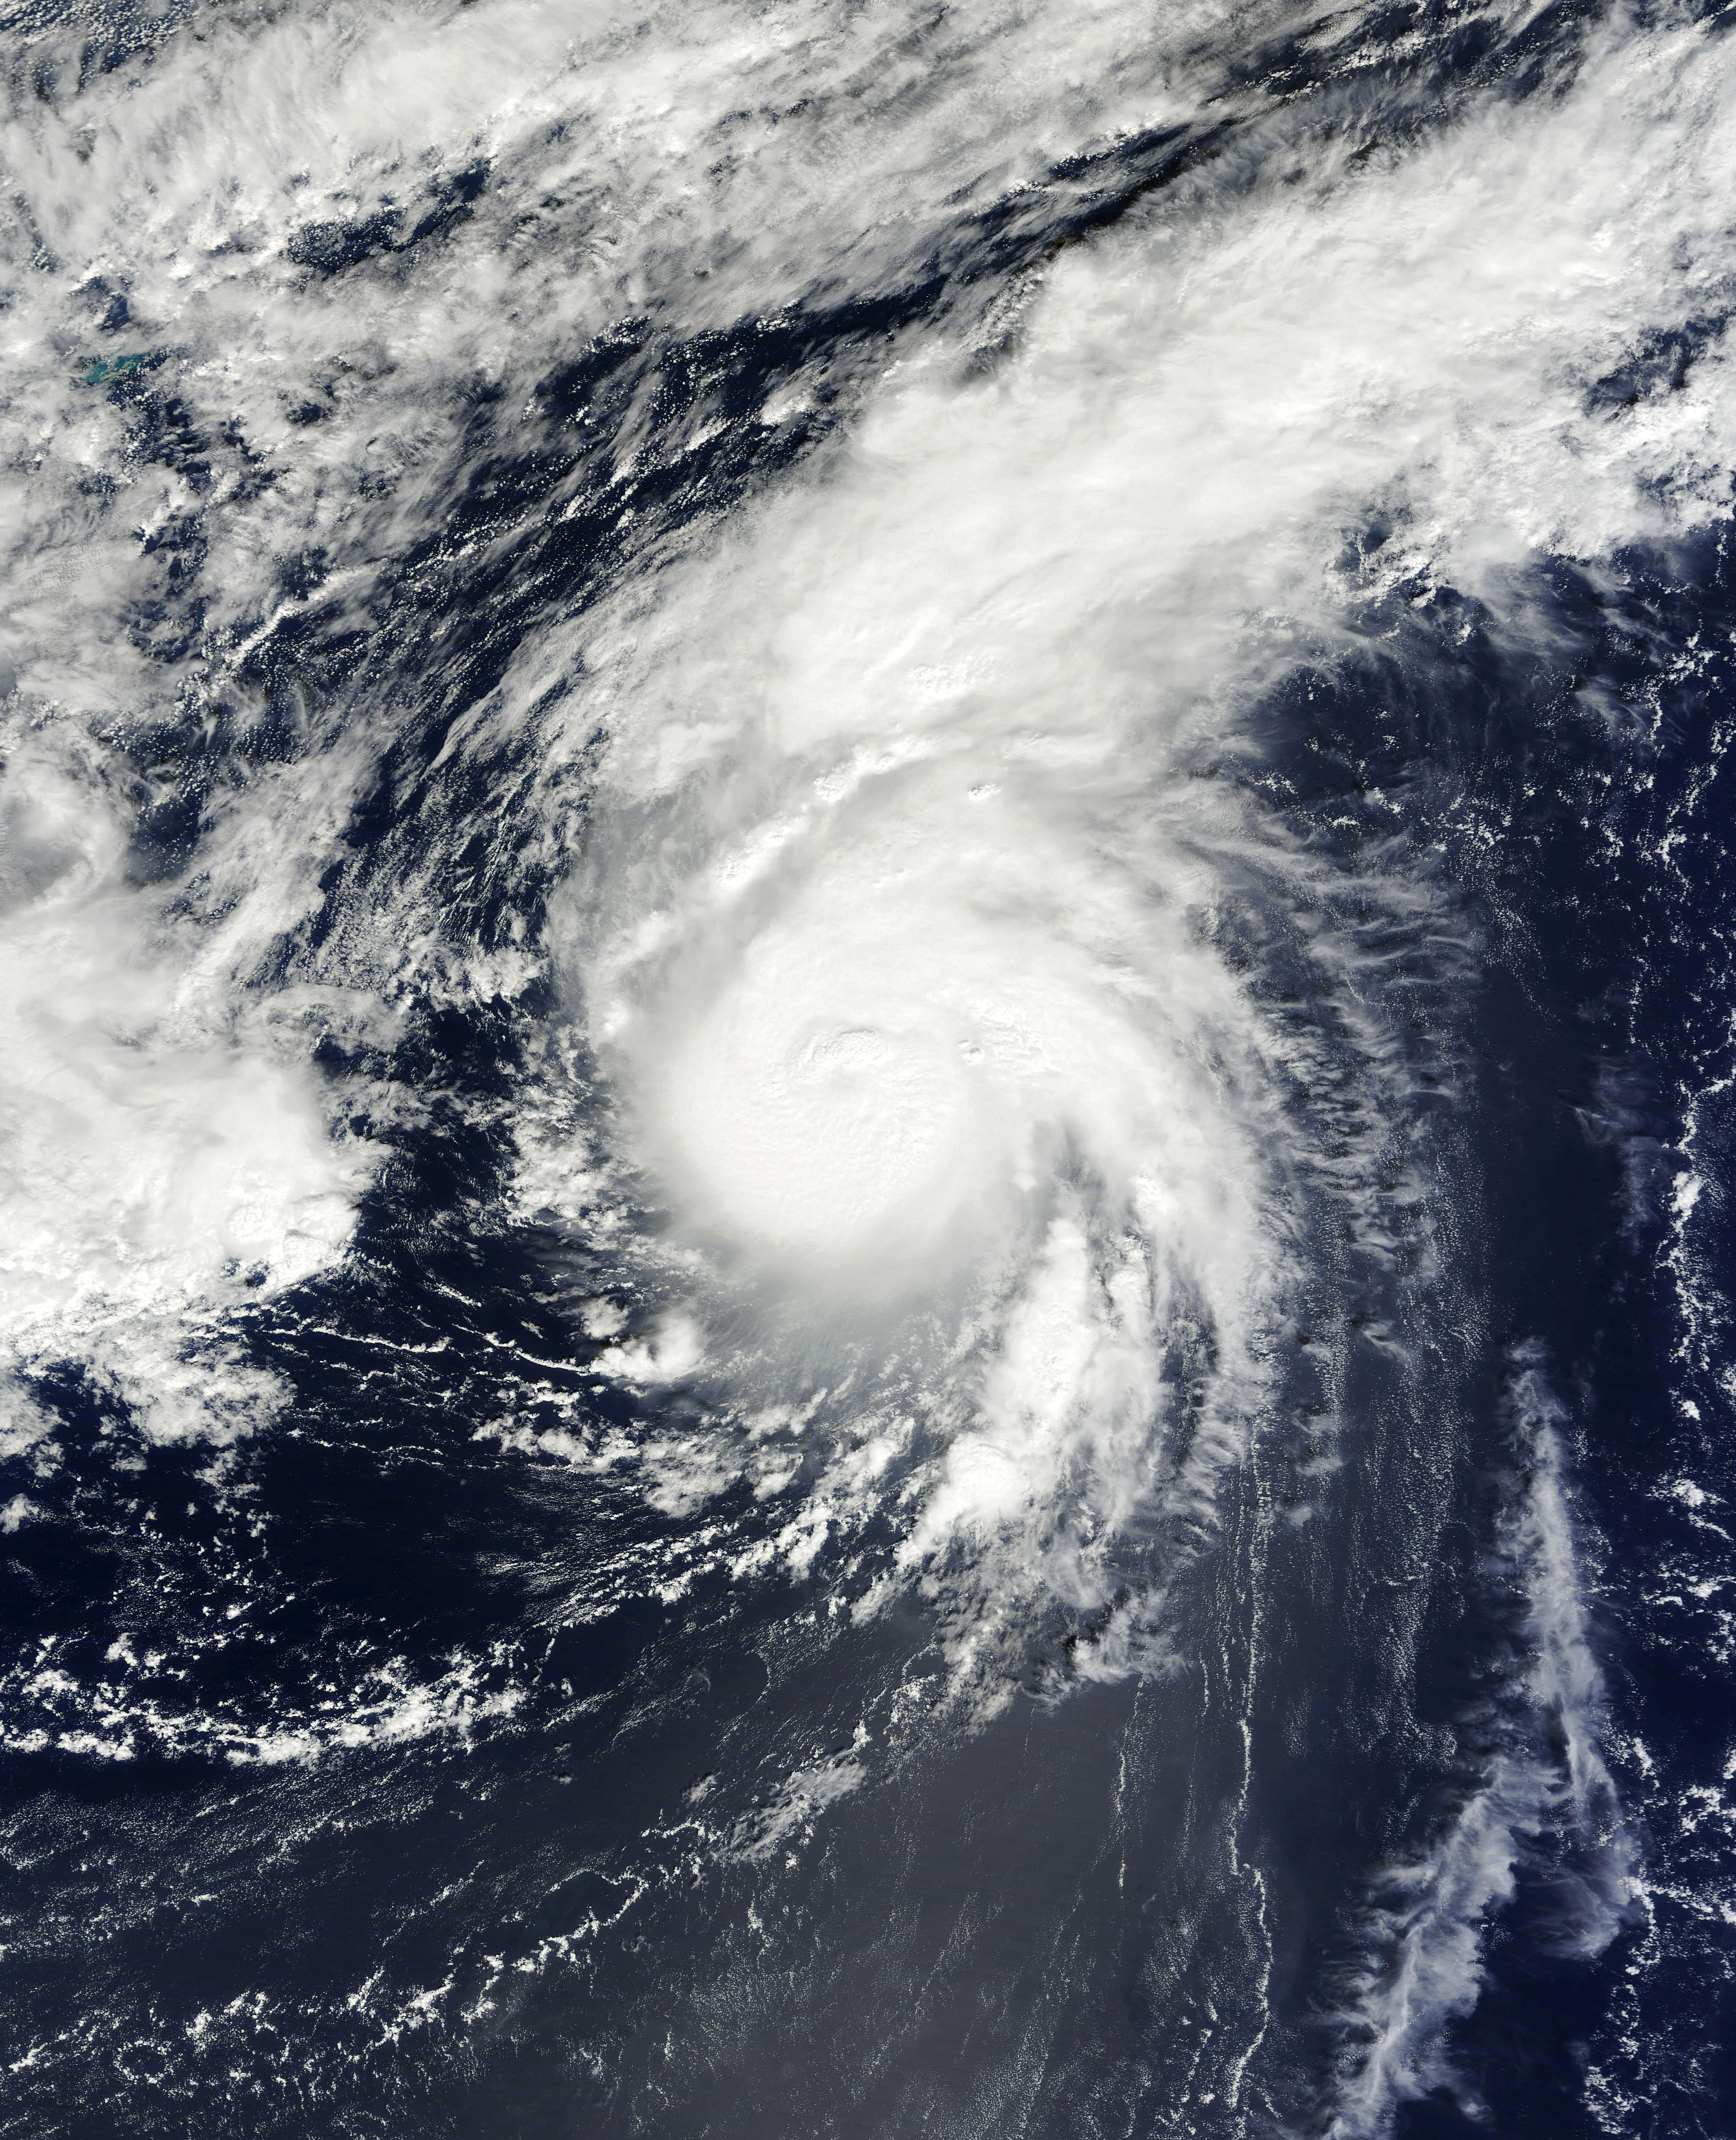
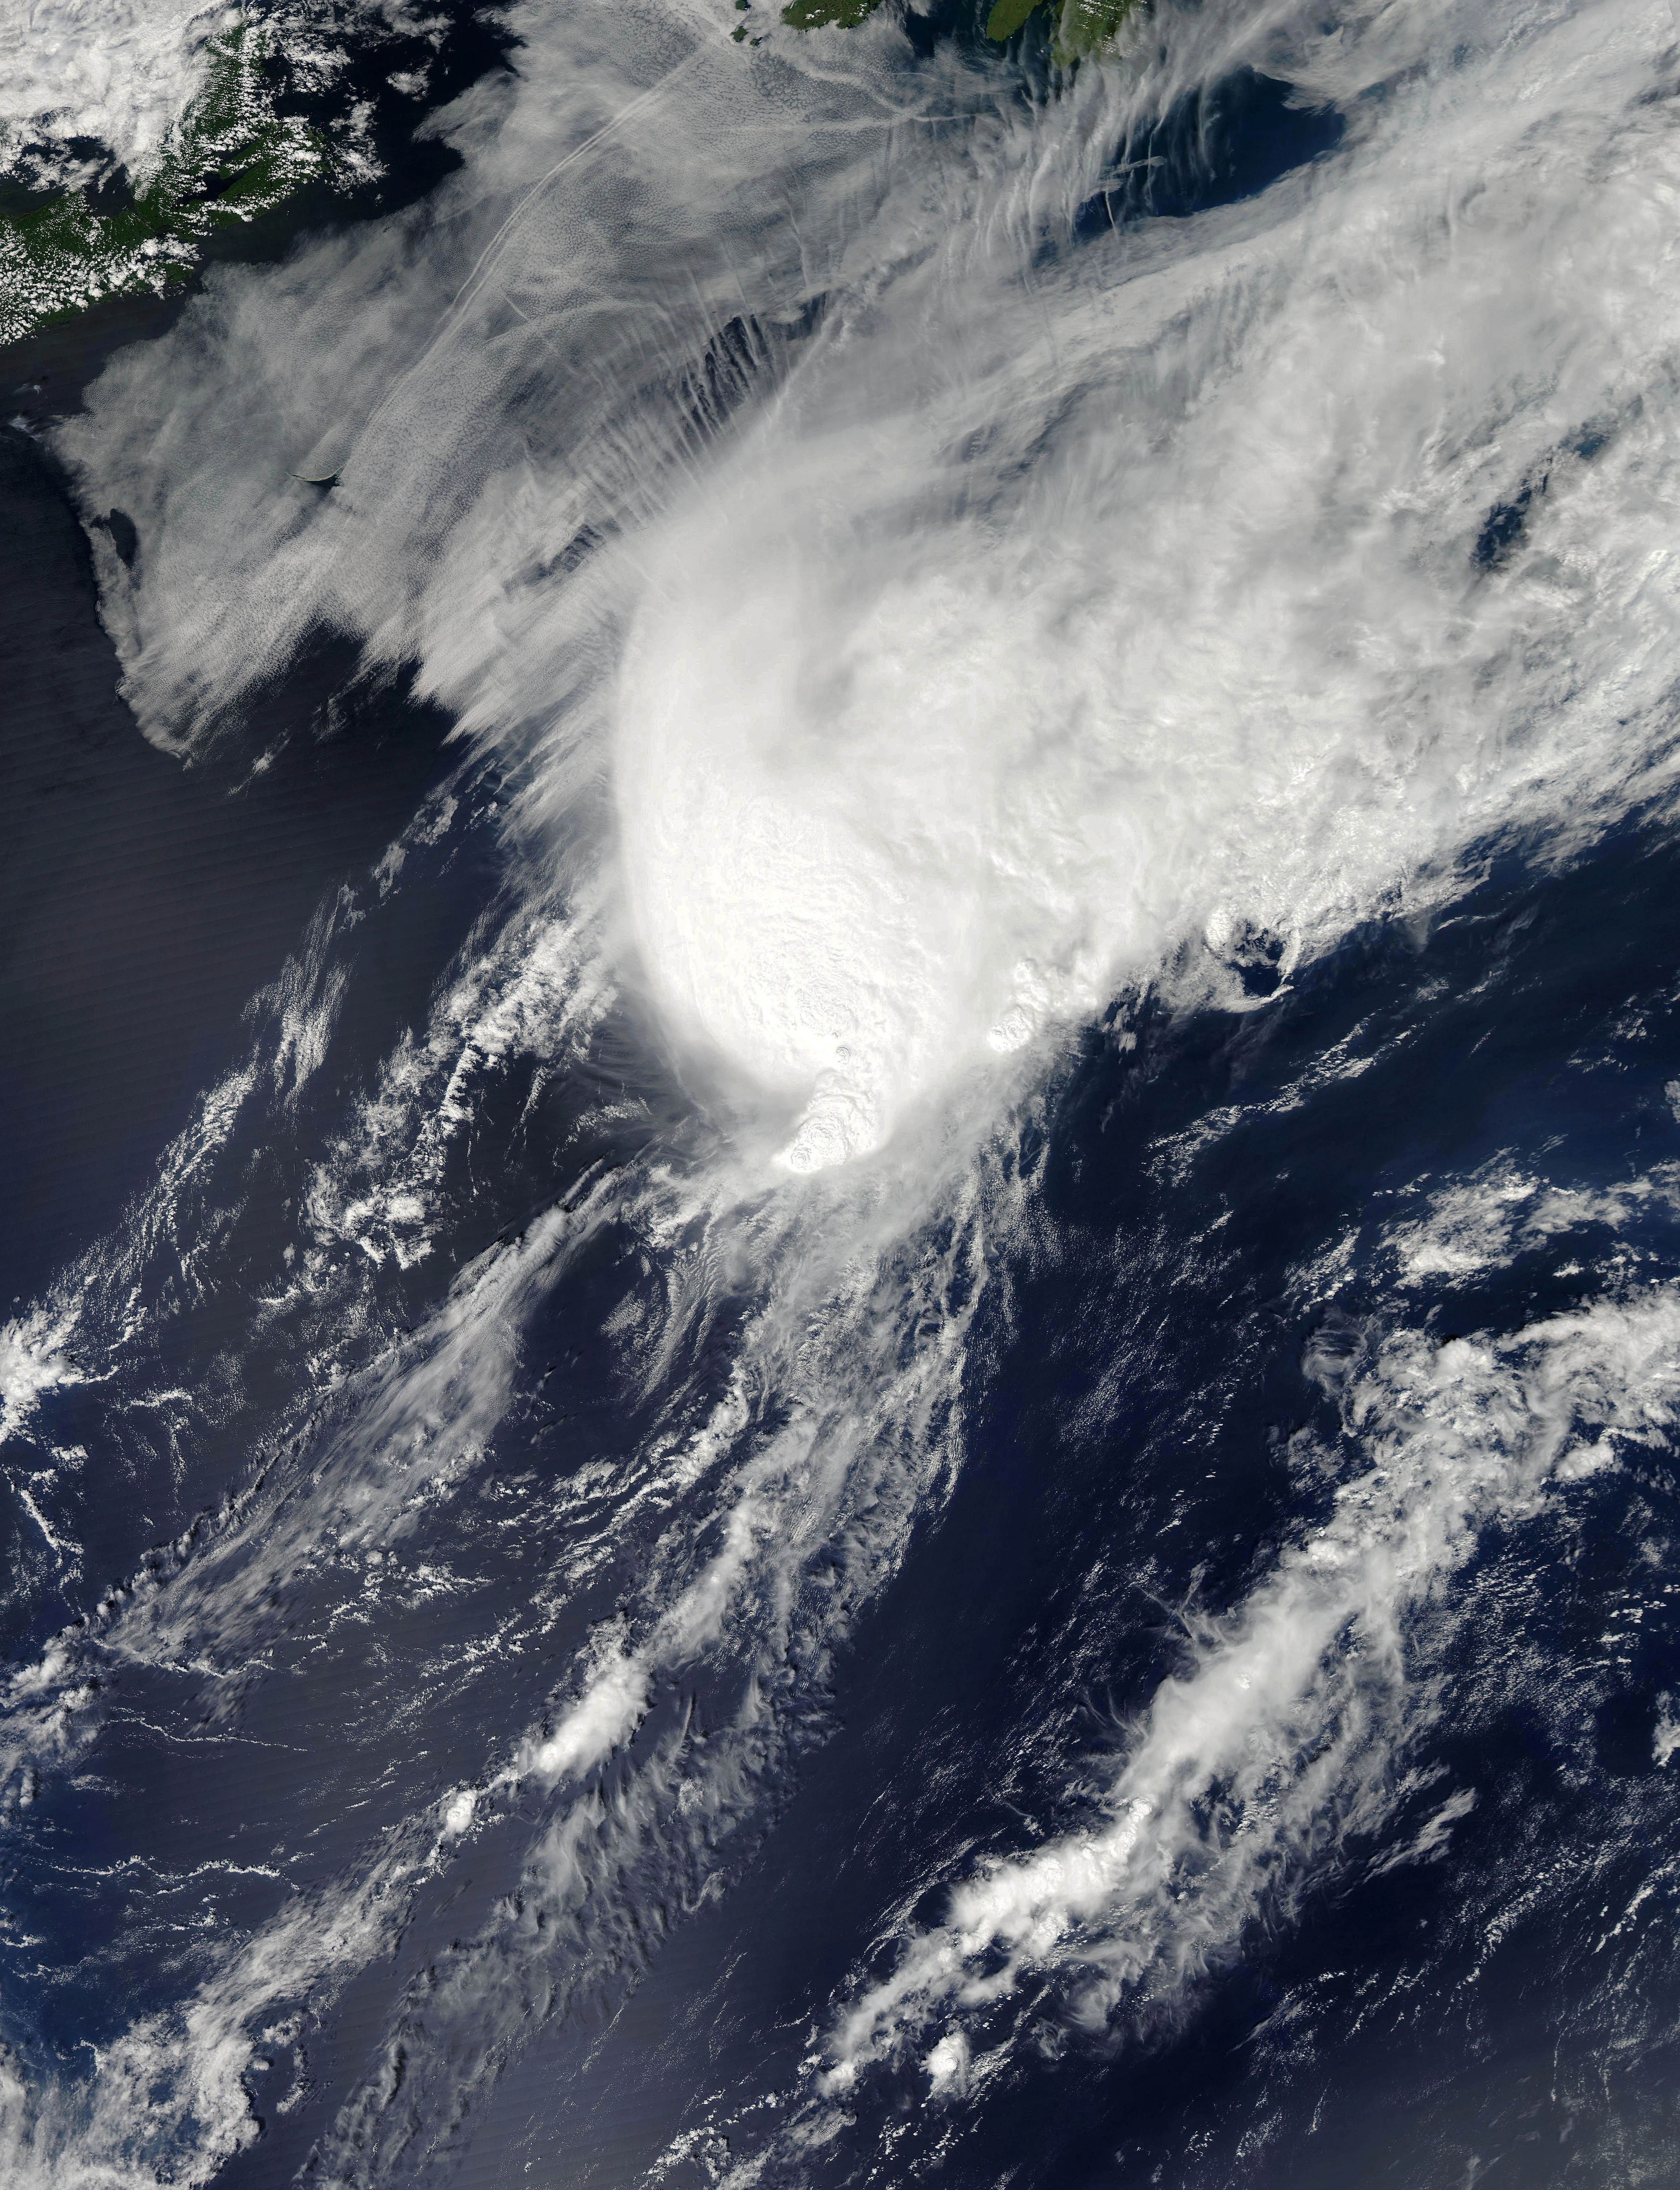
Maria approaching Newfoundland.
Europe, especially the United Kingdom and Ireland, was heavily affected by storms this season, particularly by the the extratropical remnants of Hurricane Katia. Katia, while extratropical, intensified as it swept across the British Isles, causing an unexpectedly great degree of damage. The remnants of Hurricane Ophelia also struck the United Kingdom, bringing unsettled weather to the region. The Canadian nation of Newfoundland was another area consistently struck by this season's storms, with damage compounded from the previous year's Hurricane Igor. Hurricanes Maria and Ophelia caused extensive damage, with the latter resulting in approximately $430.5 million in damage, becoming the most crucifying storm on record for the nation. Several Caribbean islands were struck multiple times, though all effects were minimal in nature. Bermuda was brushed at least seven separate times, though only Hurricane Ophelia resulted in any sort of significant damage. Hurricane Harvey also devastated Central America, causing at least 30 fatalities after making landfall in Nicaragua.
Records[]
The 2011 season featured numerous unusual instances. Hurricane Ophelia was the strongest hurricane to occur north of 35º N latitude. The storm may have also been responsible for a 95-foot rogue wave that came ashore the coast of St. Pierre just a day prior to its landfall. While the verifiability of the wave is debatable, it is the highest ever recorded since Hurricane Ivan produced a 131 ft wave in September 2004. In addition, Hurricane Philippe was the first Atlantic storm to obtain hurricane status thrice since Hurricane Tomas, and was the longest-lived of the decade, only to be surpassed by Hurricane Nadine the subsequent year. With a seasonal total of nineteen named storms, the season tied for third-most active on record, and retains the third-highest number of hurricanes on record, behind 2010 and 1969, and 2005. Hurricane Irene ranks as the fifth-costliest hurricane on record for the United States, as well as being the seventh-costliest overall for the basin. The season was also the most destructive since 2008.
Accumulated Cyclone Energy[]
The season's activity was reflected with an exceptionally high ACE value of TBA. ACE is, broadly speaking, a measure of the power of the hurricane multiplied by the length of time it existed, so storms that last a long time, as well as particularly strong hurricanes, have high ACEs. It is only calculated for full advisories on tropical systems at or exceeding 39 mph (63 km/h), which is tropical storm strength. Subtropical cyclones, such as the initial portion of Sean, are excluded from the total ACE value.
Storms[]
Tropical Storm Arlene[]
| Tropical storm (SSHWS) | |
 | |
| Duration | June 28 – July 1 |
|---|---|
| Peak intensity | 70 mph (110 km/h) (1-min) 993 mbar (hPa) |
Hurricane Bret[]
| Category 1 hurricane (SSHWS) | |
 | |
| Duration | July 17 – July 24 |
|---|---|
| Peak intensity | 75 mph (120 km/h) (1-min) 989 mbar (hPa) |
Tropical Storm Cindy[]
| Tropical storm (SSHWS) | |
 | |
| Duration | July 19 – July 23 |
|---|---|
| Peak intensity | 70 mph (110 km/h) (1-min) 991 mbar (hPa) |
Tropical Storm Don[]
| Tropical storm (SSHWS) | |
 | |
| Duration | July 26 – July 30 |
|---|---|
| Peak intensity | 60 mph (95 km/h) (1-min) 997 mbar (hPa) |
Hurricane Emily[]
| Category 1 hurricane (SSHWS) | |
 | |
| Duration | August 1 – August 9 |
|---|---|
| Peak intensity | 80 mph (130 km/h) (1-min) 984 mbar (hPa) |
Tropical Storm Franklin[]
| Tropical storm (SSHWS) | |
 | |
| Duration | August 12 – August 14 |
|---|---|
| Peak intensity | 60 mph (95 km/h) (1-min) 998 mbar (hPa) |
Tropical Storm Gert[]
| Tropical storm (SSHWS) | |
 | |
| Duration | August 13 – August 18 |
|---|---|
| Peak intensity | 65 mph (100 km/h) (1-min) 996 mbar (hPa) |
Hurricane Harvey[]
| Category 1 hurricane (SSHWS) | |
 | |
| Duration | August 18 – August 22 |
|---|---|
| Peak intensity | 85 mph (140 km/h) (1-min) 986 mbar (hPa) |
Hurricane Irene[]
| Category 4 hurricane (SSHWS) | |
 | |
| Duration | August 20 – August 28 |
|---|---|
| Peak intensity | 140 mph (220 km/h) (1-min) 934 mbar (hPa) |
Tropical Depression Ten[]
| Tropical depression (SSHWS) | |
 | |
| Duration | August 25 – August 26 |
|---|---|
| Peak intensity | 35 mph (55 km/h) (1-min) 1008 mbar (hPa) |
Tropical Storm Jose[]
| Tropical storm (SSHWS) | |
 | |
| Duration | August 26 – August 31 |
|---|---|
| Peak intensity | 45 mph (75 km/h) (1-min) 1005 mbar (hPa) |
Hurricane Katia[]
| Category 4 hurricane (SSHWS) | |
 | |
| Duration | August 28 – September 14 |
|---|---|
| Peak intensity | 150 mph (240 km/h) (1-min) 936 mbar (hPa) |
Unnamed Tropical Storm[]
| Tropical storm (SSHWS) | |
 | |
| Duration | September 1 – September 3 |
|---|---|
| Peak intensity | 40 mph (65 km/h) (1-min) 1006 mbar (hPa) |
Tropical Storm Lee[]
| Tropical storm (SSHWS) | |
 | |
| Duration | September 1 – September 6 |
|---|---|
| Peak intensity | 60 mph (95 km/h) (1-min) 987 mbar (hPa) |
Hurricane Maria[]
| Category 3 hurricane (SSHWS) | |
 | |
| Duration | September 4 – September 16 |
|---|---|
| Peak intensity | 115 mph (185 km/h) (1-min) 959 mbar (hPa) |
Hurricane Nate[]
| Category 1 hurricane (SSHWS) | |
 | |
| Duration | September 6 – September 11 |
|---|---|
| Peak intensity | 75 mph (120 km/h) (1-min) 988 mbar (hPa) |
Hurricane Ophelia[]
| Category 4 hurricane (SSHWS) | |
 | |
| Duration | September 17 – October 4 |
|---|---|
| Peak intensity | 145 mph (230 km/h) (1-min) 940 mbar (hPa) |
Hurricane Philippe[]
| Category 1 hurricane (SSHWS) | |
 | |
| Duration | September 24 – October 10 |
|---|---|
| Peak intensity | 90 mph (150 km/h) (1-min) 975 mbar (hPa) |
Hurricane Rina[]
| Category 3 hurricane (SSHWS) | |
 | |
| Duration | October 23 – November 3 |
|---|---|
| Peak intensity | 120 mph (195 km/h) (1-min) 965 mbar (hPa) |
Hurricane Sean[]
| Category 1 hurricane (SSHWS) | |
 | |
| Duration | November 6 – November 12 |
|---|---|
| Peak intensity | 85 mph (140 km/h) (1-min) 982 mbar (hPa) |
Storm Names[]
The following names were used for named storms in the North Atlantic in 2011. Names that were not assigned are marked in gray. This is the same list used in the 2005 season, with the exception of Don, Katia, Rina, Sean, and Whitney, which replaced Dennis, Katrina, Rita, Stan, and Wilma, respectively. The names Don, Katia, Rina, and Sean were used for the first time this year. The names not retired from this list will be used again in the 2017 season.
|
|
|
Retirement[]
On April 13, 2012, at the 34th Session of the World Meteorological Organization's Regional Association Hurricane Committee, the names Irene, Lee, and Ophelia were retired from its rotating name list. They will be replaced with Irma, Louis, and Oprah for the 2017 Atlantic hurricane season, respectively. Lee is one of three Atlantic tropical cyclones to have its name retired without ever reaching hurricane intensity, with others being Allison in 2001, and, eventually, Erika in 2015.
Season Effects[]
| Storm name |
Dates active | Storm category at peak intensity |
Max 1-min wind mph (km/h) |
Min. press. (mbar) |
Areas affected | Damage (USD) |
Deaths | |||
|---|---|---|---|---|---|---|---|---|---|---|
| Arlene | June 28– July 1 | Tropical storm | 70 | 993 | Mexico | $235.6 million | 20 | |||
| Bret | July 17- July 24 | Category 1 hurricane | 75 | 989 | United States (South Carolina, North Carolina), Bermuda | Minimal | 1 | |||
| Cindy | July 19- July 23 | Tropical storm | 70 | 991 | None | None | None | |||
| Don | July 26– July 30 | Tropical storm | 60 | 997 | Yucatán Peninsula, Cuba, Texas | >$1.1 million | None | |||
| Emily | August 1- August 9 | Category 1 hurricane | 80 | 984 | Lesser Antilles, Jamaica, Haiti, Cuba, Bahamas, United States (Florida, South Carolina) | $45.8 million | 2 (2) | |||
| Franklin | August 12- August 14 | Tropical storm | 50 | 998 | None | None | None | |||
| Gert | August 13– August 18 | Tropical storm | 65 | 996 | Bermuda | None | None | |||
| Harvey | August 18- August 22 | Category 1 hurricane | 85 | 986 | Nicaragua, Honduras | $21.2 million | 34 | |||
| Irene | August 20- August 28 | Category 4 hurricane | 140 | 934 | Greater Antilles, Turks & Caicos, Bahamas, United States (Florida, North Carolina, Virginia, New Jersey, New York), Atlantic Canada | $20.4 billion | 54 (10) | |||
| Ten | August 25– August 26 | Tropical depression | 35 | 1008 | None | None | None | |||
| Jose | August 26- August 31 | Tropical storm | 45 | 1005 | Bermuda | None | None | |||
| Katia | August 28- September 14 | Category 4 hurricane | 150 | 936 | Greater Antilles, East Coast of the United States, Europe (England) | $206.2 million | 3 (1) | |||
| Unnamed | September 1– September 3 | Tropical storm | 40 | 1006 | Atlantic Canada | None | None | |||
| Lee | September 1- September 6 | Tropical storm | 60 | 987 | United States (Louisiana, Texas, Mississippi, Alabama, Georgia, Florida) | $1.08 billion | 9 (2) | |||
| Maria | September 4- September 16 | Category 3 hurricane | 115 | 959 | Leeward Islands, Bermuda, Newfoundland | Minimal | None | |||
| Nate | September 6– September 11 | Category 1 hurricane | 75 | 988 | Yucatán, Veracruz | $2.5 million | 5 | |||
| Ophelia | September 17- October 4 | Category 4 hurricane | 145 | 940 | Lesser Antilles, Bermuda, Newfoundland, Europe | $890 million | 1 (1) | |||
| Philippe | September 24- October 10 | Category 1 hurricane | 90 | 975 | None | None | None | |||
| Rina | October 23- November 3 | Category 3 hurricane | 120 | 965 | Honduras, Yucatán Peninsula (Quintana Roo), Florida | $670.4 million | 6 (1) | |||
| Sean | November 6- November 12 | Category 1 hurricane | 85 | 982 | Bermuda, East Coast of the United States | Minor | None | |||
| Season aggregates | ||||||||||
| 20 systems | June 28 – November 12 | 150 | 934 | Caribbean Islands, Central America, Mexico, United States, Europe, Atlantic Canada | $22.6 billion (2011 USD) | 152 | ||||