The 2027 Atlantic hurricane season was an relatively active season.
Storms[]
Tropical Storm Abby[]
| Tropical storm (SSHWS) | |
  | |
| Duration | June 3 – June 8 |
|---|---|
| Peak intensity | 60 mph (95 km/h) (1-min) 994 mbar (hPa) |
Hurricane Bart[]
| Category 1 hurricane (SSHWS) | |
 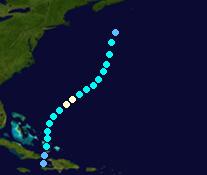 | |
| Duration | June 30 – July 6 |
|---|---|
| Peak intensity | 75 mph (120 km/h) (1-min) 987 mbar (hPa) |
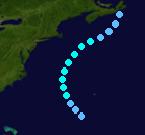
Tropical Storm Carmen[]
| Tropical storm (SSHWS) | |
  | |
| Duration | July 21 – July 23 |
|---|---|
| Peak intensity | 40 mph (65 km/h) (1-min) 1000 mbar (hPa) |
Tropical Storm Diego[]
| Tropical storm (SSHWS) | |
  | |
| Duration | July 26 – July 31 |
|---|---|
| Peak intensity | 50 mph (85 km/h) (1-min) 994 mbar (hPa) |
Tropical Depression Five[]
| Tropical depression (SSHWS) | |
  | |
| Duration | July 30 – August 1 |
|---|---|
| Peak intensity | 35 mph (55 km/h) (1-min) 1002 mbar (hPa) |
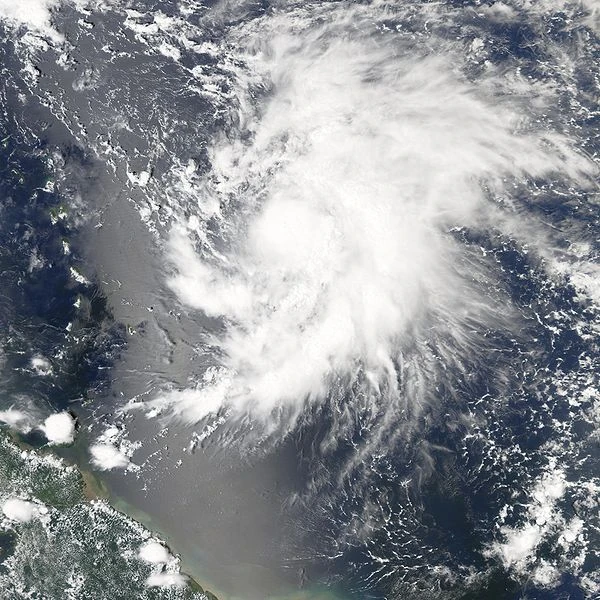
Hurricane Elaine[]
| Category 2 hurricane (SSHWS) | |
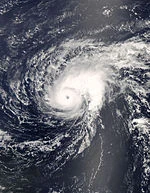  | |
| Duration | August 6 – August 14 |
|---|---|
| Peak intensity | 110 mph (175 km/h) (1-min) 958 mbar (hPa) |
Tropical Storm Francis[]
| Tropical storm (SSHWS) | |
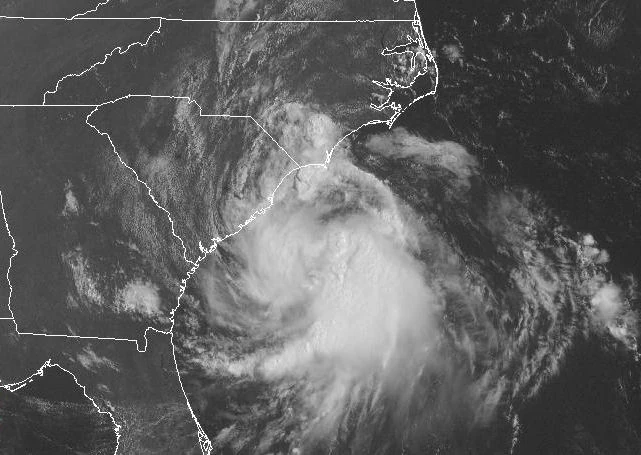  | |
| Duration | August 12 – August 15 |
|---|---|
| Peak intensity | 40 mph (65 km/h) (1-min) 1000 mbar (hPa) |
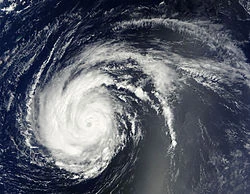
Tropical Storm Gracie[]
| Tropical storm (SSHWS) | |
  | |
| Duration | August 13 – August 18 |
|---|---|
| Peak intensity | 70 mph (110 km/h) (1-min) 986 mbar (hPa) |
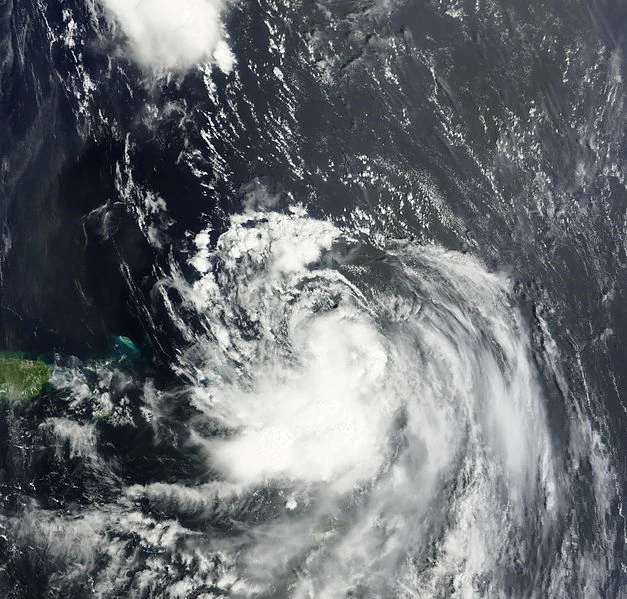
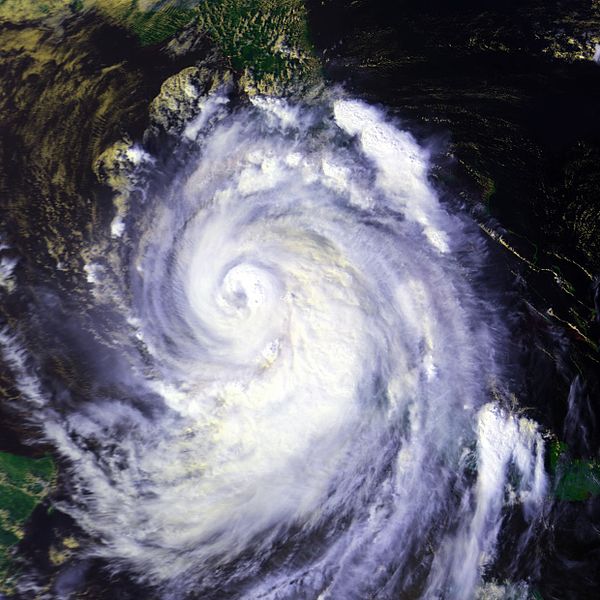
Hurricane Harold[]
| Category 4 hurricane (SSHWS) | |
  | |
| Duration | August 24 – September 7 |
|---|---|
| Peak intensity | 145 mph (230 km/h) (1-min) 936 mbar (hPa) |
Hurricane Ida[]
| Category 1 hurricane (SSHWS) | |
  | |
| Duration | August 31 – September 6 |
|---|---|
| Peak intensity | 85 mph (140 km/h) (1-min) 979 mbar (hPa) |
Tropical Storm Jack[]
| Tropical storm (SSHWS) | |
 | |
| Duration | September 2 – September 7 |
|---|---|
| Peak intensity | 65 mph (100 km/h) (1-min) 990 mbar (hPa) |
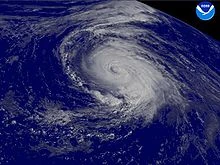
Hurricane Katie[]
| Category 5 hurricane (SSHWS) | |
 | |
| Duration | September 10 – September 23 |
|---|---|
| Peak intensity | 165 mph (270 km/h) (1-min) 911 mbar (hPa) |
Hurricane Lee[]
| Category 1 hurricane (SSHWS) | |
 | |
| Duration | September 27 – October 4 |
|---|---|
| Peak intensity | 80 mph (130 km/h) (1-min) 985 mbar (hPa) |
Tropical Depression Fourteen[]
| Tropical depression (SSHWS) | |
 | |
| Duration | September 30 – October 2 |
|---|---|
| Peak intensity | 35 mph (55 km/h) (1-min) 1004 mbar (hPa) |
Hurricane Melissa[]
| Category 3 hurricane (SSHWS) | |
 | |
| Duration | October 19 – October 30 |
|---|---|
| Peak intensity | 125 mph (205 km/h) (1-min) 944 mbar (hPa) |
Hurricane Norman[]
| Category 2 hurricane (SSHWS) | |
 | |
| Duration | November 14 – November 23 |
|---|---|
| Peak intensity | 105 mph (165 km/h) (1-min) 961 mbar (hPa) |
Tropical Storm Ophelia[]
| Tropical storm (SSHWS) | |
 | |
| Duration | December 30 – January 2, 2028 |
|---|---|
| Peak intensity | 45 mph (75 km/h) (1-min) 999 mbar (hPa) |
Timeline[]

Accumulated Cyclone Energy (ACE) Rating[]
| ACE (104 kt2) – Storm: Source | |||||
|---|---|---|---|---|---|
| 1 | 31.5 | Katie | 12 | 0.00 | Storm |
| 2 | 23.6 | Harold | 13 | 0.00 | Storm |
| 3 | 0.00 | Storm | 14 | 0.00 | Storm |
| 4 | 0.00 | Storm | 15 | 0.00 | Storm |
| 5 | 0.00 | Storm | 16 | 0.00 | Storm |
| 6 | 0.00 | Storm | 17 | 0.00 | Storm |
| 7 | 0.00 | Storm | 18 | 0.00 | Storm |
| 8 | 0.00 | Storm | 19 | 0.00 | Storm |
| 9 | 0.00 | Storm | 20 | 0.00 | Storm |
| 10 | 0.00 | Storm | 21 | 0.00 | Storm |
| 11 | 0.00 | Storm | 22 | 0.00 | Storm |
| Total=55.1 | |||||
ACE is the result of a storm's winds multiplied by how long it lasted for, so storms or subtropical storms (Originally not included up until 2012) that at lasted a long time , as well as particularly strong hurricanes , have higher ACE totals. Tropical Depressions are not included in season total.
Season effects[]
This is a table of the storms and their effects in the 2025 Atlantic hurricane season. This table includes the storm's names, duration, peak intensity, Areas affected (bold indicates made landfall in that region at least once), damages, and death totals. Deaths in parentheses are additional and indirect (an example of an indirect death would be a traffic accident), but are still storm-related. Damage and deaths include totals while the storm was extratropical, a wave or a low. All of the damage figures are in 2025 USD (the listed damage figure is in millions).
|
Tropical cyclones of the 2027 Atlantic hurricane season | ||||||||||||||||||||||||
|
|
| |||||||||||||||||||||||
|
| ||||||||||||||||||||||||
| Storm name |
Dates active | Storm category at peak intensity |
Max 1-min wind mph (km/h) |
Min. press. (mbar) |
Areas affected | Damage (USD) |
Deaths |
|---|---|---|---|---|---|---|---|
| Abby | June 3 – June 8 | Tropical storm | 60 (95) | 994 | Nova Scotia | 5 | 3 |
| Bart | June 30 – July 6 | Category 1 hurricane | 75 (120) | 987 | Bermuda , Cuba , Hispaniola | 15 | 5 |
| Carmen | July 21 – July 23 | Tropical storm | 40 (65) | 1000 | None | 0 | 0 |
| Diego | July 26 – July 31 | Tropical storm | 50 (85) | 994 | None | 0 | 0 |
| Five | July 30 – August 1 | Tropical depression | 35 (55) | 1002 | US East Coast (North Carolina) | 1 | 1 |
| Elaine | August 6 – August 14 | Category 2 hurricane | 110 (175) | 958 | None | 0 | 0 |
| Francis | August 12 – August 15 | Tropical storm | 40 (65) | 1000 | US East Coast (North Carolina) | 2 | 2 |
| Gracie | August 13 – August 18 | Tropical storm | 70 (110) | 986 | US East Coast (Florida), The Bahamas | 5 | 3 |
| Harold | August 24 – September 7 | Category 4 hurricane | 145 (230) | 936 | None | 0 | 0 |
| Ida | August 31 – September 6 | Category 1 hurricane | 85 (140) | 979 | None | 0 | 0 |