Hypothetical Hurricanes Wiki

Welcome to the wiki! Learn more about it here.

Disclaimer: The content on this wiki is fictional and NOT a resource for real tropical cyclones. NONE of this wiki's content should be taken as a real indication of inclement weather.

READ MORE

Hypothetical Hurricanes Wiki
Advertisement
Hypothetical Hurricanes Wiki

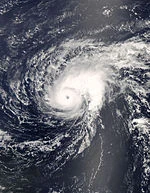
The 2017 Atlantic hurricane season was an active Atlantic hurricane season which featured many intense systems. The season began on June 1, 2017, and it ended on November 30, 2017, dates which delimit the timeframe for tropical cyclone formation. Overall, the 2017 Atlantic hurricane season produced 20 tropical cyclones, of which 19 developed into tropical storms; twelve storms attained hurricane intensity, and three hurricanes further reached major hurricane status. With nineteen storms, the season was tied for the third most active Atlantic hurricane season on record. The strongest storm of the season was Hurricane Ophelia, which attained Category 5 intensity on the Saffir-Simpson Hurricane Scale in the Atlantic Ocean; it later recurved out to sea.

The season began with Hurricane Arlene on June 21 and ended with Hurricane Tammy on November 14. In early September, Hurricane Harvey tracked through the Caribbean Sea and the Gulf of Mexico as a Category 5 hurricane, causing major damage to the Greater Antilles, Central America, Yucatán Peninsula, and the United States Gulf Coast. In addition, Hurricane Tammy caused considerable impact to Louisiana as a Category 3 hurricane. Furthermore, Hurricanes Gert and Nate made landfall over South Carolina and Texas, respectively, as minimal hurricanes, and Tropical Storm Cindy also struck Texas as a weak tropical storm; however, none of the three storms caused as much damage as Harvey and Tammy did. Due to their impact on the United States, the names Harvey and Tammy were retired after the end of the season by the World Meteorological Organization (WMO).

Storms[]

Hurricane Arlene[]

Category 1 hurricane (SSHWS)
Hurricane Otto 2010-10-08 Arlene2017 Track (New)
DurationJune 21 – June 26
Peak intensity75 mph (120 km/h) (1-min) 987 mbar (hPa)

Tropical Storm Bret[]

Tropical storm (SSHWS)
Harvey Aug 20 2011 1445Z Bret2017 Track (New)
DurationJuly 21 – July 23
Peak intensity50 mph (85 km/h) (1-min) 990 mbar (hPa)

Tropical Storm Cindy[]

Tropical storm (SSHWS)
Tropical Storm Don Jul 29 2011 1915Z Cindy's track (2017) (Ryne and Andrew)
DurationAugust 4 – August 9
Peak intensity60 mph (95 km/h) (1-min) 992 mbar (hPa)

Tropical Storm Don[]

Tropical storm (SSHWS)
Hurricane Maria Sept 15 2011 1740Z Don's track (2017) (Ryne and Andrew)
DurationAugust 16 – August 19
Peak intensity50 mph (85 km/h) (1-min) 988 mbar (hPa)

Hurricane Emily[]

Category 4 hurricane (SSHWS)
Gordon Sept 13 2006 1450Z
DurationAugust 27 – September 6
Peak intensity130 mph (215 km/h) (1-min) 938 mbar (hPa)

Hurricane Franklin[]

Category 5 hurricane (SSHWS)
Hurricane Felix 14 sept 2001 1653Z
DurationAugust 29 – September 12
Peak intensity165 mph (270 km/h) (1-min) 917 mbar (hPa)

Hurricane Gert[]

Category 2 hurricane (SSHWS)
TS Ernesto 31 aug 2006 aqua
DurationAugust 31 – September 9
Peak intensity110 mph (175 km/h) (1-min) 952 mbar (hPa)


Hurricane Harvey[]

Category 5 hurricane (SSHWS)
Hurricane Ivan 09 sept 2004 1745Z
DurationSeptember 2 – September 20
Peak intensity175 mph (280 km/h) (1-min) 900 mbar (hPa)


Hurricane Irma[]

Category 2 hurricane (SSHWS)
Bertha 07 july 2008 1630Z
DurationSeptember 7 – September 14
Peak intensity105 mph (165 km/h) (1-min) 962 mbar (hPa)

Tropical Storm Ten[]

Tropical storm (SSHWS)
Helene00peak
DurationSeptember 9 – September 10
Peak intensity40 mph (65 km/h) (1-min) 999 mbar (hPa)

Tropical Depression Jose[]

Tropical depression (SSHWS)
Tropical Storm Ana (1997)
DurationSeptember 9 – September 9
Peak intensity35 mph (55 km/h) (1-min) 1002 mbar (hPa)

Tropical Storm Katia[]

Tropical storm (SSHWS)
Hurricanedannytd4july6
DurationSeptember 15 – September 24
Peak intensity65 mph (100 km/h) (1-min) 981 mbar (hPa)

Tropical Storm Lee[]

Tropical storm (SSHWS)
Hurricane Georges 17 sept 1998 1735Z
DurationSeptember 18 – September 30
Peak intensity70 mph (110 km/h) (1-min) 974 mbar (hPa)

Hurricane Maria[]

Category 4 hurricane (SSHWS)
Hurr-Edouard
DurationSeptember 24 – October 13
Peak intensity150 mph (240 km/h) (1-min) 923 mbar (hPa)

Hurricane Nate[]

Category 1 hurricane (SSHWS)
Tropical Storm Arlene (1993)
DurationSeptember 26 – October 12
Peak intensity90 mph (150 km/h) (1-min) 967 mbar (hPa)

Hurricane Ophelia[]

Category 5 hurricane (SSHWS)
Hurricane Charley (1992)
DurationSeptember 29 – October 21
Peak intensity185 mph (295 km/h) (1-min) 885 mbar (hPa)

Hurricane Philippe[]

Category 1 hurricane (SSHWS)
Felix sept 5 1989 1632Z
DurationOctober 2 – October 17
Peak intensity90 mph (150 km/h) (1-min) 967 mbar (hPa)

Tropical Storm Rina[]

Tropical storm (SSHWS)
TS Rita 18 sept 2005 1540Z
DurationOctober 13 – October 19
Peak intensity70 mph (110 km/h) (1-min) 988 mbar (hPa)

Hurricane Sean[]

Category 1 hurricane (SSHWS)
Hurricane Olga 27 nov 2001 1148Z
DurationOctober 24 – October 31
Peak intensity85 mph (140 km/h) (1-min) 976 mbar (hPa)

Hurricane Tammy[]

Category 3 hurricane (SSHWS)
Lili 03 oct 2002 1900Z
DurationNovember 6 – November 14
Peak intensity115 mph (185 km/h) (1-min) 957 mbar (hPa)

Timeline[]

wikipedia:Saffir-Simpson Hurricane Scale

Accumulated Cyclone Energy (ACE)[]

ACE (104 kt2) – Storm: Source
1 74.65 Ophelia 12 9.75 Lee
2 63.85 Maria 13 8.53 Katia
3 56.65 Franklin 14 5.97 Arlene
4 51.72 Harvey 15 4.52 Rina
5 30.42 Nate 16 2.15 Cindy
6 27.54 Emily 17 1.97 Don
7 26.39 Philippe 18 1.03 Bret
8 24.97 Tammy 19 0.97 Ten
9 21.57 Gert 20 0.00 Storm
10 19.84 Irma 21 0.00 Storm
11 14.32 Sean 22 0.00 Storm
Total=446.81

The table to the right shows the tropical storms of the 2017 season ranked from highest to lowest ACE, given to two significant figures. The total for the season was 446.81 x 10⁴kt2, which was the highest seasonal ACE value ever recorded. It is significantly higher than that of the 1933 season, which had an ACE of 250 x 104kt2.

ACE measures the combination of both a tropical or subtropical storm's intensity and duration, so longer-lasting storms can accumulate an ACE greater than that of a stronger storm that lasted a shorter duration. This discrepancy is most obvious in the comparatively high ACE value of Hurricane Nate to Hurricane Emily. Despite being weaker than Emily, Hurricane Nate formed far out to sea in the Atlantic Ocean and trekked many miles across the Caribbean Sea before making its Texas landfall. In the case of Emily, it did not generate as much ACE as Nate did because it lasted for a shorter duration than Nate. In addition, Hurricane Philippe and Tropical Storms Katia and Lee also have high ACEs for their intensities because all three storms lasted for a long time, were rather slow to develop, and never exceeded tropical storm or Category 1 intensity.

Also, the average ACE per storm, 23.51, was far above average. This was due to many of the more intense systems, such as Ophelia and Maria, forming far out to sea (Cape Verde-type hurricane) and lasted for a very long time, similar to 2004 and 1995's storms.

Advertisement