The 2014 Atlantic hurricane season was an active season.
Storms[]
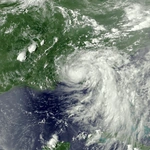
Tropical Storm Alberto[]
| Tropical storm (SSHWS) | |
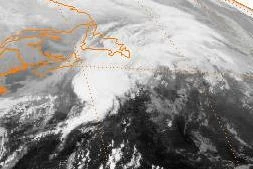 | |
| Duration | June 3 – June 7 |
|---|---|
| Peak intensity | 65 mph (100 km/h) (1-min) 989 mbar (hPa) |
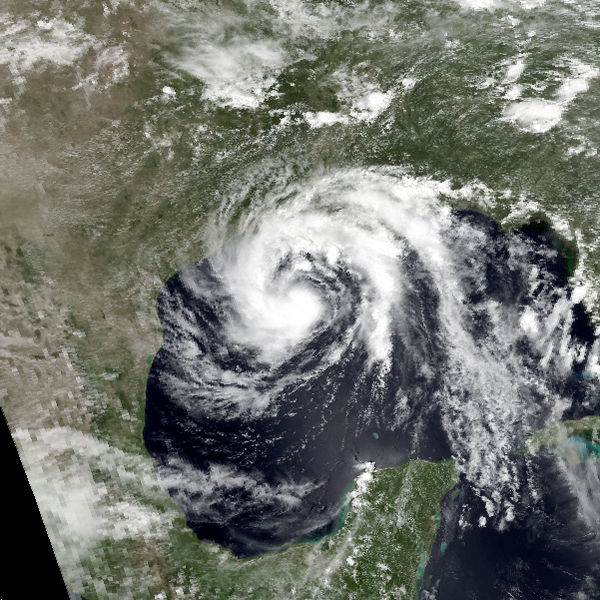
Hurricane Beryl[]
| Category 1 hurricane (SSHWS) | |
 | |
| Duration | June 24 – June 30 |
|---|---|
| Peak intensity | 80 mph (130 km/h) (1-min) 981 mbar (hPa) |
Tropical Storm Chris[]
| Tropical storm (SSHWS) | |
 | |
| Duration | July 1 – July 4 |
|---|---|
| Peak intensity | 50 mph (85 km/h) (1-min) 1000 mbar (hPa) |
Tropical Storm Debby[]
| Tropical storm (SSHWS) | |
 | |
| Duration | July 7 – July 12 |
|---|---|
| Peak intensity | 60 mph (95 km/h) (1-min) 994 mbar (hPa) |
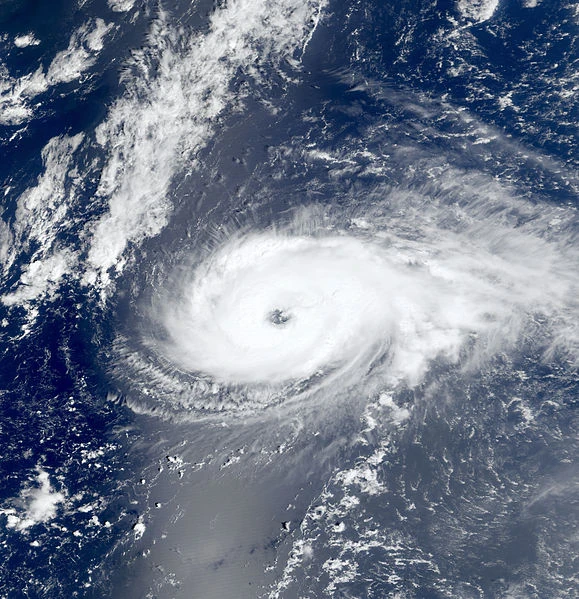
Hurricane Ernesto[]
| Category 3 hurricane (SSHWS) | |
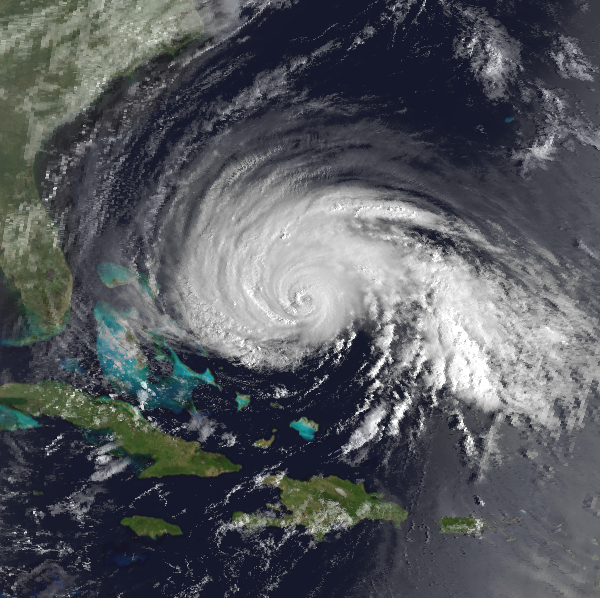 | |
| Duration | July 16 – July 27 |
|---|---|
| Peak intensity | 125 mph (205 km/h) (1-min) 944 mbar (hPa) |
Hurricane Florence[]
| Category 2 hurricane (SSHWS) | |
 | |
| Duration | July 21 – July 29 |
|---|---|
| Peak intensity | 100 mph (155 km/h) (1-min) 970 mbar (hPa) |
Tropical Storm Gordon[]
| Tropical storm (SSHWS) | |
 | |
| Duration | July 31 – August 5 |
|---|---|
| Peak intensity | 70 mph (110 km/h) (1-min) 986 mbar (hPa) |
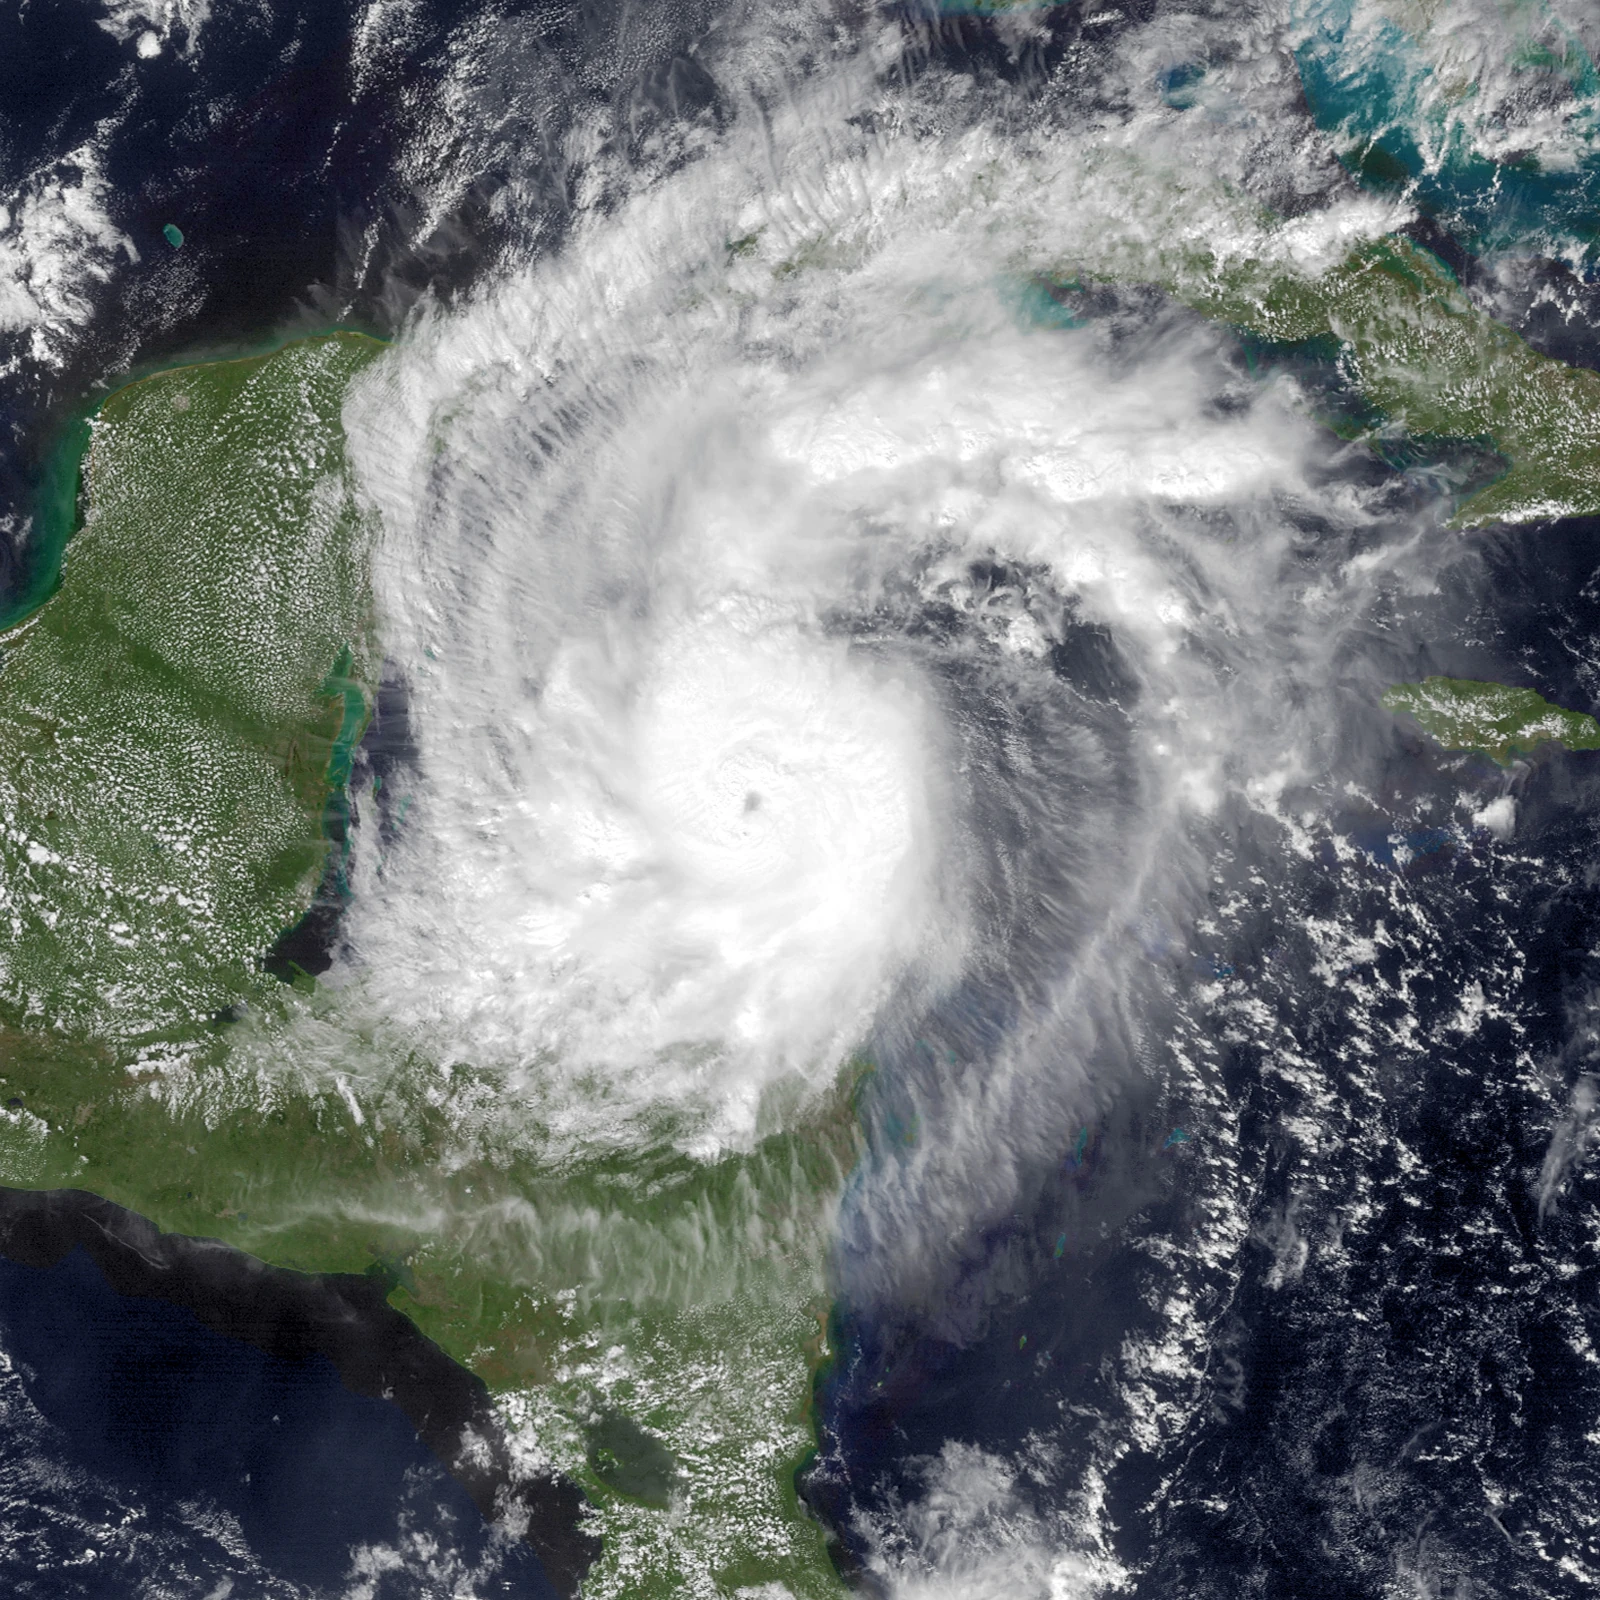
Hurricane Helene[]
| Category 4 hurricane (SSHWS) | |
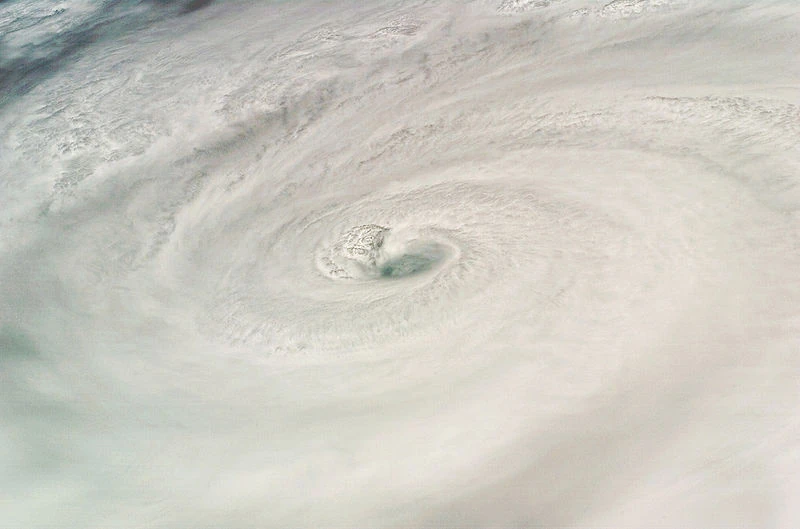 | |
| Duration | August 6 – August 18 |
|---|---|
| Peak intensity | 150 mph (240 km/h) (1-min) 930 mbar (hPa) |
Hurricane Isaac[]
| Category 2 hurricane (SSHWS) | |
 | |
| Duration | August 14 – August 22 |
|---|---|
| Peak intensity | 110 mph (175 km/h) (1-min) 963 mbar (hPa) |
Timeline[]

Accumulated Cyclone Energy (ACE) Rating[]
| ACE (104 kt2) – Storm: Source | |||||
|---|---|---|---|---|---|
| 1 | 0.00 | Storm | 12 | 0.00 | Storm |
| 2 | 0.00 | Storm | 13 | 0.00 | Storm |
| 3 | 0.00 | Storm | 14 | 0.00 | Storm |
| 4 | 0.00 | Storm | 15 | 0.00 | Storm |
| 5 | 0.00 | Storm | 16 | 0.00 | Storm |
| 6 | 0.00 | Storm | 17 | 0.00 | Storm |
| 7 | 0.00 | Storm | 18 | 0.00 | Storm |
| 8 | 0.00 | Storm | 19 | 0.00 | Storm |
| 9 | 0.00 | Storm | 20 | 0.00 | Storm |
| 10 | 0.00 | Storm | 21 | 0.00 | Storm |
| 11 | 0.00 | Storm | 22 | 0.00 | Storm |
| Total=0.0 | |||||
ACE is the result of a storm's winds multiplied by how long it lasted for, so storms or subtropical storms (Originally not included up until 2012) that at lasted a long time , as well as particularly strong hurricanes , have higher ACE totals. Tropical Depressions are not included in season total.
Season effects[]
This is a table of the storms and their effects in the 2024 Atlantic hurricane season. This table includes the storm's names, duration, peak intensity, Areas affected (bold indicates made landfall in that region at least once), damages, and death totals. Deaths in parentheses are additional and indirect (an example of an indirect death would be a traffic accident), but are still storm-related. Damage and deaths include totals while the storm was extratropical, a wave or a low. All of the damage figures are in 2024 USD (the listed damage figure is in millions).