The 1998 Atlantic hurricane season began on June 1st, 1998 and ended November 30th, 1998.
Seasonal forecasts[]
| Source | Date | Named
storms |
Hurricanes | Major
hurricanes | |
| NOAA | May 10, 1998 | 18 | 11 | 6 | |
| ––––––––––––––––––––––––––––––––––––––––––––––––––––––– | |||||
| Actual activity | 12 | 9 | 5 | ||
Season Summary[]
Storms[]
|
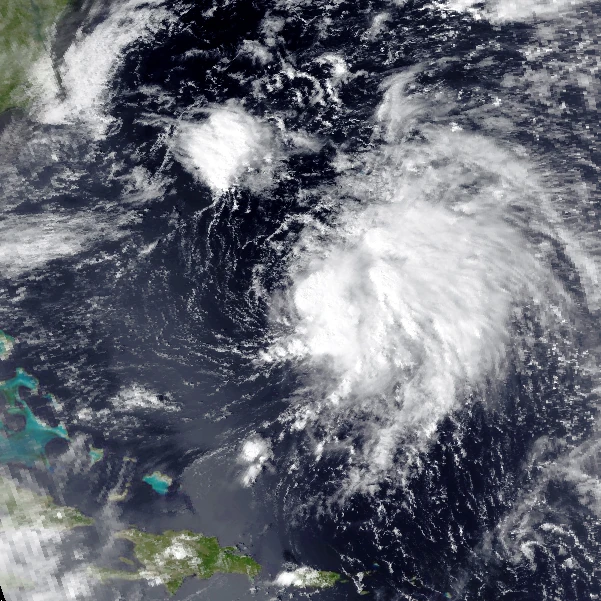
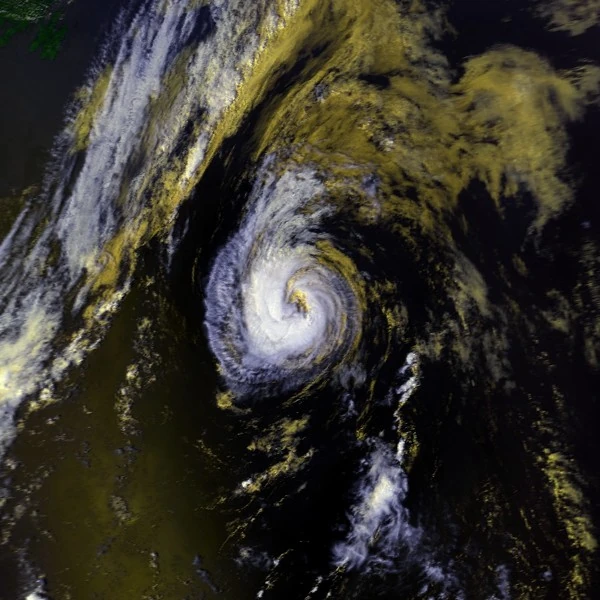
Hurricane Alex[]
| Category 1 hurricane (SSHWS) | |
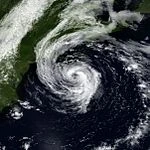 | |
| Duration | June 16 – June 23 |
|---|---|
| Peak intensity | 85 mph (140 km/h) (1-min) 979 mbar (hPa) |
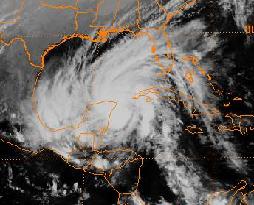
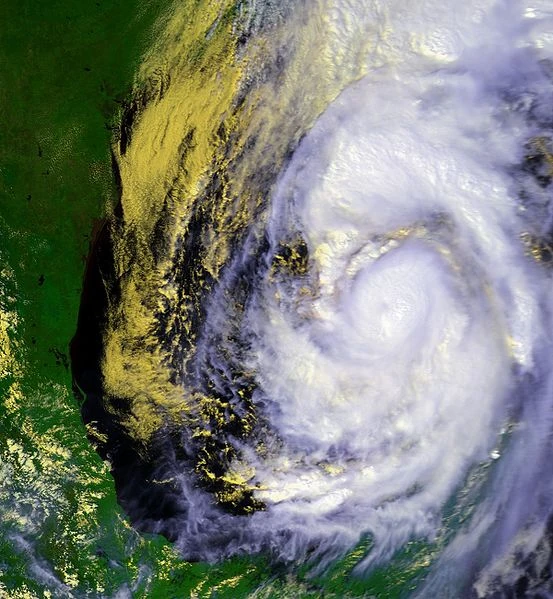
Hurricane Bonnie[]
| Category 3 hurricane (SSHWS) | |
 | |
| Duration | July 31 – August 6 |
|---|---|
| Peak intensity | 120 mph (195 km/h) (1-min) 952 mbar (hPa) |
Tropical Storm Charley[]
| Tropical storm (SSHWS) | |
 | |
| Duration | August 4 – August 10 |
|---|---|
| Peak intensity | 70 mph (110 km/h) (1-min) 986 mbar (hPa) |
Tropical Storm Danielle[]
| Tropical storm (SSHWS) | |
 | |
| Duration | August 10 – August 14 |
|---|---|
| Peak intensity | 60 mph (95 km/h) (1-min) 995 mbar (hPa) |
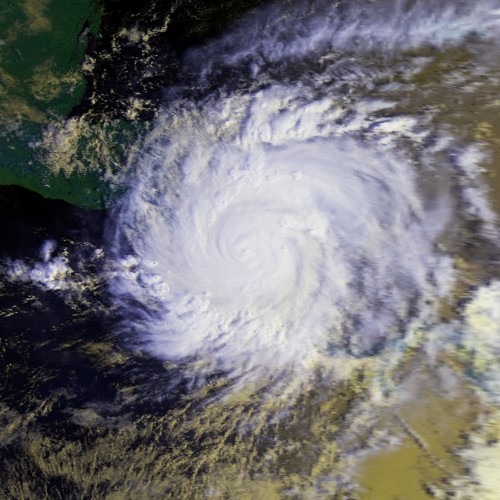
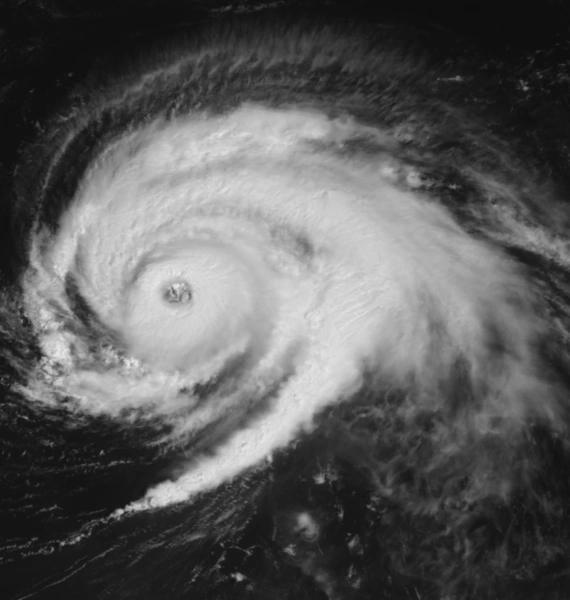
Hurricane Earl[]
| Category 3 hurricane (SSHWS) | |
 | |
| Duration | August 21 – August 31 |
|---|---|
| Peak intensity | 125 mph (205 km/h) (1-min) 946 mbar (hPa) |
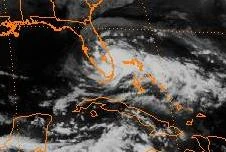
Hurricane Frances[]
| Category 1 hurricane (SSHWS) | |
 | |
| Duration | August 30 – September 6 |
|---|---|
| Peak intensity | 75 mph (120 km/h) (1-min) 987 mbar (hPa) |
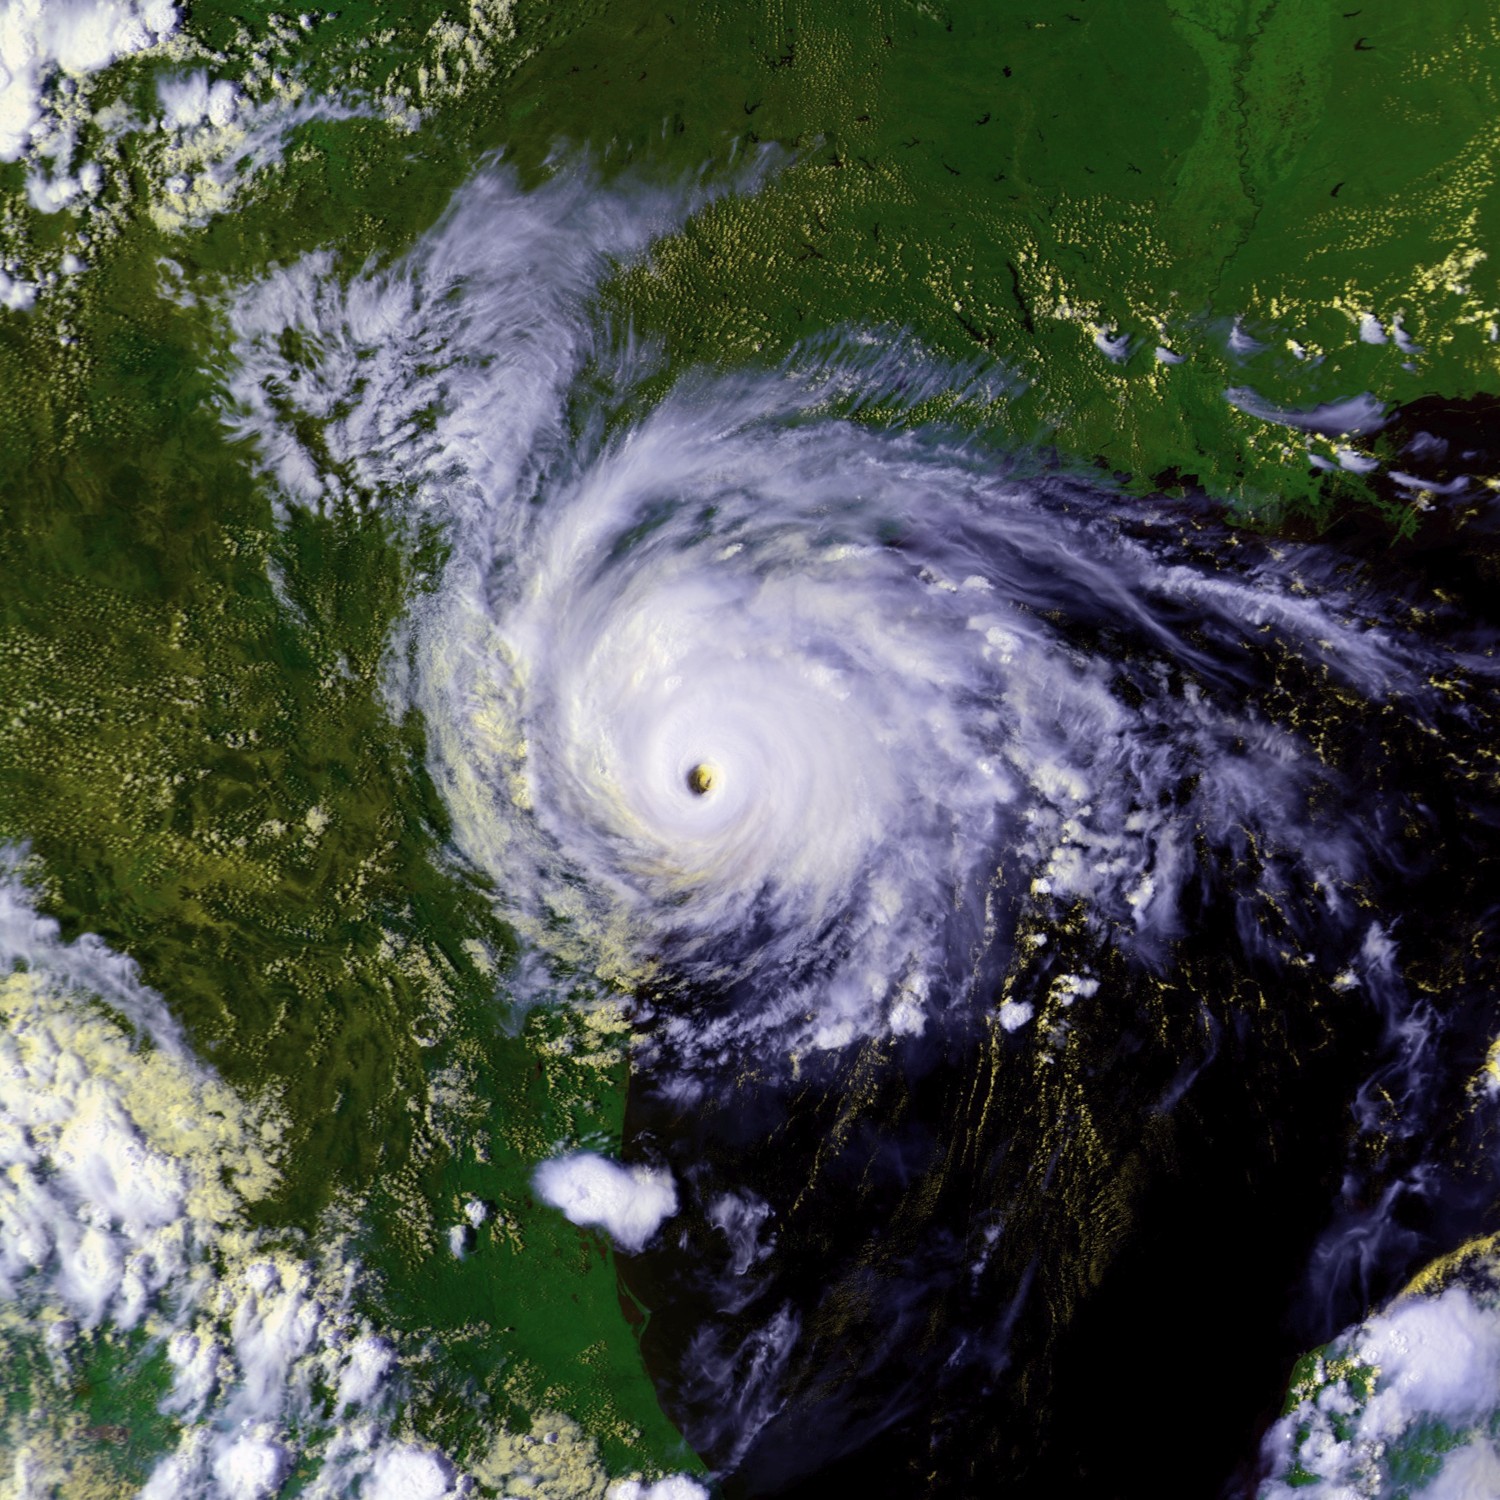
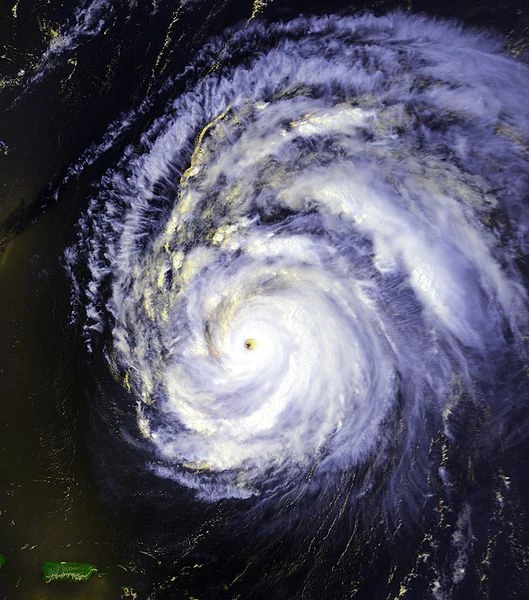
Hurricane Georges[]
| Category 5 hurricane (SSHWS) | |
 | |
| Duration | September 2 – September 18 |
|---|---|
| Peak intensity | 160 mph (260 km/h) (1-min) 915 mbar (hPa) |
Tropical Storm Hermine[]
| Tropical storm (SSHWS) | |
 | |
| Duration | September 10 – September 14 |
|---|---|
| Peak intensity | 65 mph (100 km/h) (1-min) 989 mbar (hPa) |
Hurricane Ivan[]
| Category 2 hurricane (SSHWS) | |
 | |
| Duration | September 18 – September 30 |
|---|---|
| Peak intensity | 110 mph (175 km/h) (1-min) 960 mbar (hPa) |
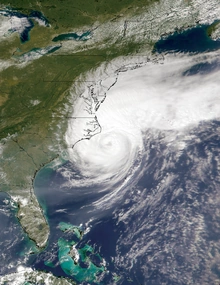
Hurricane Jeanne[]
| Category 4 hurricane (SSHWS) | |
 | |
| Duration | September 26 – October 10 |
|---|---|
| Peak intensity | 145 mph (230 km/h) (1-min) 934 mbar (hPa) |
Hurricane Karl[]
| Category 3 hurricane (SSHWS) | |
 | |
| Duration | September 28 – October 7 |
|---|---|
| Peak intensity | 125 mph (205 km/h) (1-min) 943 mbar (hPa) |
Hurricane Lisa[]
| Category 1 hurricane (SSHWS) | |
 | |
| Duration | September 29 – October 7 |
|---|---|
| Peak intensity | 80 mph (130 km/h) (1-min) 981 mbar (hPa) |
Timeline[]

Storm names[]
The following names will be used to name tropical and subtropical cyclones in the 1998 season.
|
|
|
Accumulated Cyclone Energy (ACE) Rating[]
| ACE (104 kt2) – Storm: Source | |||||
|---|---|---|---|---|---|
| 1 | 0.00 | Storm | 12 | 0.00 | Storm |
| 2 | 0.00 | Storm | 13 | 0.00 | Storm |
| 3 | 0.00 | Storm | 14 | 0.00 | Storm |
| 4 | 0.00 | Storm | 15 | 0.00 | Storm |
| 5 | 0.00 | Storm | 16 | 0.00 | Storm |
| 6 | 0.00 | Storm | 17 | 0.00 | Storm |
| 7 | 0.00 | Storm | 18 | 0.00 | Storm |
| 8 | 0.00 | Storm | 19 | 0.00 | Storm |
| 9 | 0.00 | Storm | 20 | 0.00 | Storm |
| 10 | 0.00 | Storm | 21 | 0.00 | Storm |
| 11 | 0.00 | Storm | 22 | 0.00 | Storm |
| Total=0.0 | |||||
ACE is the result of a storm's winds multiplied by how long it lasted for, so storms or subtropical storms (Originally not included up until 2012) that at lasted a long time , as well as particularly strong hurricanes , have higher ACE totals. Tropical Depressions are not included in season total.
Season effects[]
This is a table of the storms and their effects in the 1998 Atlantic hurricane season. This table includes the storm's names, duration, peak intensity, Areas affected (bold indicates made landfall in that region at least once), damages, and death totals. Deaths in parentheses are additional and indirect (an example of an indirect death would be a traffic accident), but are still storm-related. Damage and deaths include totals while the storm was extratropical, a wave or a low. All of the damage figures are in 2015 USD (the listed damage figure is in millions).
| Storm name |
Dates active | Storm category at peak intensity |
Max 1-min wind mph (km/h) |
Min. press. (mbar) |
Areas affected | Damage (USD) |
Deaths |
|---|---|---|---|---|---|---|---|
| Storm | June 0 – June 0 | Tropical depression | 0 (0) | 0 | 0 | 0 |