The 2012 Atlantic hurricane season was as active as 2005.
This season originally saw 19 storms, 10 hurricanes and 2 major. But this re-creation will see much more activity because of the December 21st, 2012 Event that was Originally supposed to happen
Seasonal forecasts[]
| Source | Date | Named
storms |
Hurricanes | Major
hurricanes | |
| NOAA | May 31, 2012 | 19 | 11 | 5 | |
| ––––––––––––––––––––––––––––––––––––––––––––––––––––––– | |||||
| Actual activity | 28 | 15 | 7 | ||
Storms[]
|
Tropical Storm Alberto[]
| Tropical storm (SSHWS) | |
 | |
| Duration | May 27 – May 31 |
|---|---|
| Peak intensity | 65 mph (100 km/h) (1-min) 990 mbar (hPa) |
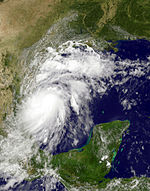
Hurricane Beryl[]
| Category 2 hurricane (SSHWS) | |
 | |
| Duration | June 14 – June 20 |
|---|---|
| Peak intensity | 105 mph (165 km/h) (1-min) 968 mbar (hPa) |
Hurricane Chris[]
| Category 1 hurricane (SSHWS) | |
 | |
| Duration | June 26 – June 30 |
|---|---|
| Peak intensity | 75 mph (120 km/h) (1-min) 987 mbar (hPa) |
Tropical Depression Four[]
| Tropical depression (SSHWS) | |
 | |
| Duration | July 4 – July 7 |
|---|---|
| Peak intensity | 35 mph (55 km/h) (1-min) 1002 mbar (hPa) |
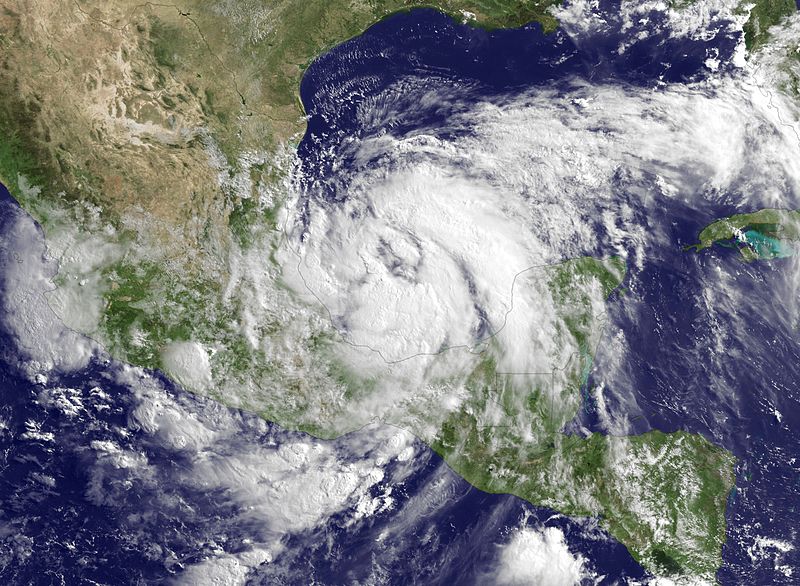
Hurricane Debby[]
| Category 2 hurricane (SSHWS) | |
 | |
| Duration | July 14 – July 23 |
|---|---|
| Peak intensity | 105 mph (165 km/h) (1-min) 961 mbar (hPa) |
Subtropical Storm Ernesto[]
| Subtropical storm (SSHWS) | |
 | |
| Duration | July 20 – July 24 |
|---|---|
| Peak intensity | 50 mph (85 km/h) (1-min) 996 mbar (hPa) |
Hurricane Florence[]
| Category 3 hurricane (SSHWS) | |
 | |
| Duration | July 25 – August 2 |
|---|---|
| Peak intensity | 115 mph (185 km/h) (1-min) 960 mbar (hPa) |
Hurricane Gordon[]
| Category 2 hurricane (SSHWS) | |
 | |
| Duration | July 31 – August 6 |
|---|---|
| Peak intensity | 100 mph (155 km/h) (1-min) 967 mbar (hPa) |
Hurricane Helene[]
| Category 1 hurricane (SSHWS) | |
 | |
| Duration | August 2 – August 7 |
|---|---|
| Peak intensity | 85 mph (140 km/h) (1-min) 980 mbar (hPa) |
Tropical Storm Isaac[]
| Tropical storm (SSHWS) | |
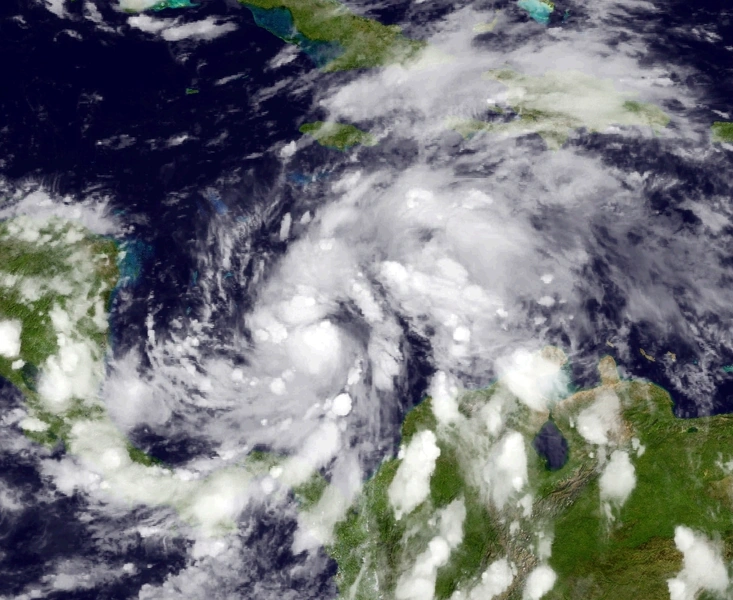 | |
| Duration | August 7 – August 11 |
|---|---|
| Peak intensity | 65 mph (100 km/h) (1-min) 989 mbar (hPa) |
Hurricane Joyce[]
| Category 4 hurricane (SSHWS) | |
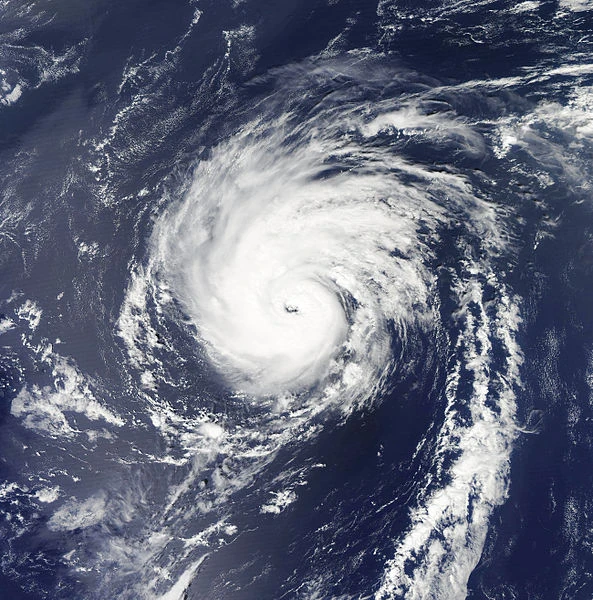 | |
| Duration | August 10 – August 26 |
|---|---|
| Peak intensity | 135 mph (215 km/h) (1-min) 941 mbar (hPa) |
Hurricane Kirk[]
| Category 1 hurricane (SSHWS) | |
 | |
| Duration | August 15 – August 20 |
|---|---|
| Peak intensity | 80 mph (130 km/h) (1-min) 981 mbar (hPa) |
Hurricane Leslie[]
| Category 1 hurricane (SSHWS) | |
 | |
| Duration | August 19 – August 24 |
|---|---|
| Peak intensity | 75 mph (120 km/h) (1-min) 987 mbar (hPa) |
Subtropical Storm Michael[]
| Subtropical storm (SSHWS) | |
 | |
| Duration | August 22 – August 27 |
|---|---|
| Peak intensity | 60 mph (95 km/h) (1-min) 991 mbar (hPa) |
Hurricane Nadine[]
| Category 3 hurricane (SSHWS) | |
 | |
| Duration | August 26 – September 10 |
|---|---|
| Peak intensity | 120 mph (195 km/h) (1-min) 954 mbar (hPa) |
Tropical Depression Sixteen[]
| Tropical depression (SSHWS) | |
 | |
| Duration | August 29 – September 1 |
|---|---|
| Peak intensity | 35 mph (55 km/h) (1-min) 1002 mbar (hPa) |
Tropical Storm Oscar[]
| Tropical storm (SSHWS) | |
 | |
| Duration | August 31 – September 4 |
|---|---|
| Peak intensity | 50 mph (85 km/h) (1-min) 996 mbar (hPa) |
Tropical Storm Patty[]
| Tropical storm (SSHWS) | |
 | |
| Duration | September 2 – September 9 |
|---|---|
| Peak intensity | 65 mph (100 km/h) (1-min) 990 mbar (hPa) |
Tropical Storm Rafael[]
| Tropical storm (SSHWS) | |
 | |
| Duration | September 6 – September 11 |
|---|---|
| Peak intensity | 70 mph (110 km/h) (1-min) 988 mbar (hPa) |
Hurricane Sandy[]
| Category 5 hurricane (SSHWS) | |
 | |
| Duration | September 10 – September 25 |
|---|---|
| Peak intensity | 190 mph (305 km/h) (1-min) 875 mbar (hPa) |
Hurricane Tony[]
| Category 4 hurricane (SSHWS) | |
 | |
| Duration | September 16 – September 29 |
|---|---|
| Peak intensity | 140 mph (220 km/h) (1-min) 935 mbar (hPa) |
Tropical Storm Valerie[]
| Tropical storm (SSHWS) | |
 | |
| Duration | September 20 – September 24 |
|---|---|
| Peak intensity | 60 mph (95 km/h) (1-min) 995 mbar (hPa) |
Tropical Depression Twenty-Three[]
| Tropical depression (SSHWS) | |
 | |
| Duration | September 26 – September 28 |
|---|---|
| Peak intensity | 35 mph (55 km/h) (1-min) 1004 mbar (hPa) |
Hurricane William[]
| Category 5 hurricane (SSHWS) | |
 | |
| Duration | September 30 – October 19 |
|---|---|
| Peak intensity | 165 mph (270 km/h) (1-min) 911 mbar (hPa) |
Tropical Storm Alpha[]
| Tropical storm (SSHWS) | |
 | |
| Duration | October 7 – October 12 |
|---|---|
| Peak intensity | 65 mph (100 km/h) (1-min) 989 mbar (hPa) |
Tropical Storm Beta[]
| Tropical storm (SSHWS) | |
 | |
| Duration | October 11 – October 16 |
|---|---|
| Peak intensity | 70 mph (110 km/h) (1-min) 982 mbar (hPa) |
Hurricane Gamma[]
| Category 5 hurricane (SSHWS) | |
 | |
| Duration | October 21 – November 7 |
|---|---|
| Peak intensity | 160 mph (260 km/h) (1-min) 925 mbar (hPa) |
Subtropical Storm Delta[]
| Subtropical storm (SSHWS) | |
 | |
| Duration | October 31 – November 3 |
|---|---|
| Peak intensity | 45 mph (75 km/h) (1-min) 994 mbar (hPa) |
Tropical Storm Epsilon[]
| Tropical storm (SSHWS) | |
 | |
| Duration | November 10 – November 15 |
|---|---|
| Peak intensity | 60 mph (95 km/h) (1-min) 992 mbar (hPa) |
Hurricane Zeta[]
| Category 2 hurricane (SSHWS) | |
 | |
| Duration | December 21 – December 30 |
|---|---|
| Peak intensity | 110 mph (175 km/h) (1-min) 960 mbar (hPa) |
Tropical Storm Eta[]
| Tropical storm (SSHWS) | |
 | |
| Duration | December 31 – January 2, 2013 |
|---|---|
| Peak intensity | 40 mph (65 km/h) (1-min) 999 mbar (hPa) |
Timeline[]

Accumulated Cyclone Energy (ACE) Rating[]
| ACE (104 kt2) – Storm: Source | |||||
|---|---|---|---|---|---|
| 1 | 0.00 | Storm | 14 | 0.00 | Storm |
| 2 | 0.00 | Storm | 15 | 0.00 | Storm |
| 3 | 0.00 | Storm | 16 | 0.00 | Storm |
| 4 | 0.00 | Storm | 17 | 0.00 | Storm |
| 5 | 0.00 | Storm | 18 | 0.00 | Storm |
| 6 | 0.00 | Storm | 19 | 0.00 | Storm |
| 7 | 0.00 | Storm | 20 | 0.00 | Storm |
| 8 | 0.00 | Storm | 21 | 0.00 | Storm |
| 9 | 0.00 | Storm | 22 | 0.00 | Storm |
| 10 | 0.00 | Storm | 23 | 0.00 | Storm |
| 11 | 0.00 | Storm | 24 | 0.00 | Storm |
| 12 | 0.00 | Storm | 25 | 0.00 | Storm |
| 13 | 0.00 | Storm | 26 | 0.00 | Storm |
| Total=0.00 | |||||
ACE is the result of a storm's winds multiplied by how long it lasted for, so storms or subtropical storms (Originally not included up until 2012) that at lasted a long time , as well as particularly strong hurricanes , have higher ACE totals. Tropical Depressions are not included in season totals.
Storm names[]
The following names will be used to name tropical and subtropical cyclones in the 2012 season.
|
|
|
Season effects[]
This is a table of the storms and their effects in the 2012 Atlantic hurricane season. This table includes the storm's names, duration, peak intensity, Areas affected (bold indicates made landfall in that region at least once), damages, and death totals. Deaths in parentheses are additional and indirect (an example of an indirect death would be a traffic accident), but are still storm-related. Damage and deaths include totals while the storm was extratropical, a wave or a low. All of the damage figures are in 2012 USD (the listed damage figure is in millions).
| Storm name |
Dates active | Storm category at peak intensity |
Max 1-min wind mph (km/h) |
Min. press. (mbar) |
Areas affected | Damage (USD) |
Deaths |
|---|---|---|---|---|---|---|---|
| 0 0 – 0 0 | Tropical depression | 0 (0) | 0 |