The 2016 Atlantic hurricane seasonwas an extremely active season.
Storm names[]
The following names will be used to name tropical and subtropical storms in the 2016 season. This is the same list used in the 2010 season with the exception of Ian and Tobias (which respectively replaced Igor and Tomas). Storms were named Ian, Tobias, Virginie, and Walter for the first time in 2016.
|
|
|
Greek Alphabet[]
Due to the exceptional activity of 2016, the National Hurricane Center (NHC) had to resort to using the Greek alphabet, the secondary naming list. The first six names are shown below:
|
|
|
Seasonal Summary[]
The 2016 Atlantic hurricane season was hyperactive, the season pulled a 2005 style activity but had more hurricanes and major hurricanes than 2005 did.
Alex Become one of the earliest season Category 4 hurricanes on July 6 after having formed June 29th, The earliest behind Audrey from 1957.
The season experienced almost 2 months of hyperactive activity, From August 9 to October 2. 14 depressions, 12 storms , 9 hurricanes and 5 major hurricanes formed within the almost 2 month span, Including Karl, the strongest of the season.
Karl become one of 3 Category-5 hurricanes in the 2016 season, it had top winds of 190 mph and a pressure of 883 milibars, almost becoming the strongest storm recorded in the Atlantic basin, only behind Wilma in 2005, whom had a low pressure of 882 milibars but a top wind of 185 mph.
Hurricane Otto caused record flooding in southern Florida as a Tropical Storm after having made landfall in Cuba as a Hurricane.
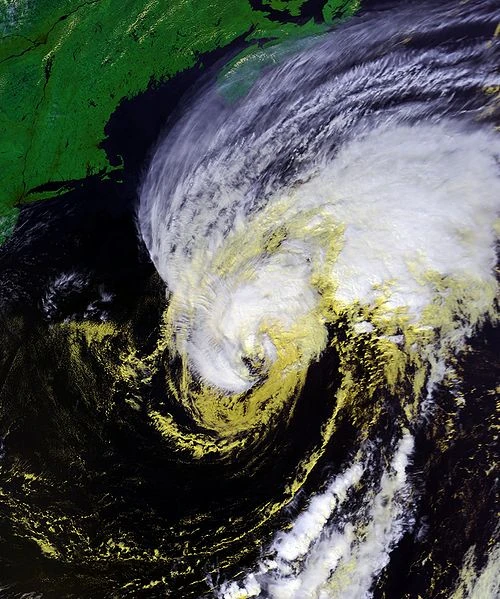
Shary became one of the worst hurricanes to affect New York since Sandy in 2012. Only Shary was a 105 mph storm.
Tobias was a devastating storm whom made landfall in Miami, Florida as a strong 125 mph Category-3 hurricane after weakening from a Category-4..
Gamma Become a very rare November Category-5 hurricane, topping winds of 165 mph and a minimum pressure of 910 milibars, becoming the strongest November hurricane e on record. In Addition, it also made a rare major hurricane landfall in Savannah, Georgia as a 160 mph storm.
Lastly, Hurricane Zeta, a rare December Major hurricane, became a 140 mph Category-4 hurricane in mid December and made landfall in Tampa, Florida as a 135 mph Category-4. A very rare event in December.
Storms[]
Hurricane Alex[]
| Category 4 hurricane (SSHWS) | |
 | |
| Duration | June 29 – July 10 |
|---|---|
| Peak intensity | 145 mph (230 km/h) (1-min) 936 mbar (hPa) |
- Main article: Hurricane Alex (2016)
Subtropical Storm Bonnie[]
| Subtropical storm (SSHWS) | |
 | |
| Duration | July 7 – July 10 |
|---|---|
| Peak intensity | 45 mph (75 km/h) (1-min) 998 mbar (hPa) |
Hurricane Colin[]
| Category 2 hurricane (SSHWS) | |
 | |
| Duration | July 18 – July 27 |
|---|---|
| Peak intensity | 100 mph (155 km/h) (1-min) 966 mbar (hPa) |
Hurricane Danielle[]
| Category 1 hurricane (SSHWS) | |
 | |
| Duration | July 25 – July 31 |
|---|---|
| Peak intensity | 85 mph (140 km/h) (1-min) 984 mbar (hPa) |
Tropical Storm Earl[]
| Tropical storm (SSHWS) | |
 | |
| Duration | August 2 – August 6 |
|---|---|
| Peak intensity | 40 mph (65 km/h) (1-min) 1012 mbar (hPa) |
Hurricane Fiona[]
| Category 5 hurricane (SSHWS) | |
 | |
| Duration | August 9 – August 21 |
|---|---|
| Peak intensity | 160 mph (260 km/h) (1-min) 917 mbar (hPa) |
Hurricane Gaston[]
| Category 4 hurricane (SSHWS) | |
 | |
| Duration | August 17 – August 28 |
|---|---|
| Peak intensity | 155 mph (250 km/h) (1-min) 921 mbar (hPa) |
Hurricane Hermine[]
| Category 1 hurricane (SSHWS) | |
 | |
| Duration | August 25 – September 2 |
|---|---|
| Peak intensity | 85 mph (140 km/h) (1-min) 980 mbar (hPa) |
Hurricane Ian[]
| Category 3 hurricane (SSHWS) | |
 | |
| Duration | August 30 – September 9 |
|---|---|
| Peak intensity | 120 mph (195 km/h) (1-min) 961 mbar (hPa) |
Tropical Depression Ten[]
| Tropical depression (SSHWS) | |
 | |
| Duration | August 31 – September 1 |
|---|---|
| Peak intensity | 35 mph (55 km/h) (1-min) 1002 mbar (hPa) |
Tropical Depression Eleven[]
| Tropical depression (SSHWS) | |
 | |
| Duration | September 3 – September 4 |
|---|---|
| Peak intensity | 35 mph (55 km/h) (1-min) 1001 mbar (hPa) |
Hurricane Julia[]
| Category 2 hurricane (SSHWS) | |
 | |
| Duration | September 6 – September 13 |
|---|---|
| Peak intensity | 105 mph (165 km/h) (1-min) 963 mbar (hPa) |
Hurricane Karl[]
| Category 5 hurricane (SSHWS) | |
 | |
| Duration | September 10 – September 27 |
|---|---|
| Peak intensity | 190 mph (305 km/h) (1-min) 883 mbar (hPa) |
Hurricane Lisa[]
| Category 3 hurricane (SSHWS) | |
 | |
| Duration | September 10 – September 21 |
|---|---|
| Peak intensity | 115 mph (185 km/h) (1-min) 956 mbar (hPa) |
Tropical Storm Matthew[]
| Tropical storm (SSHWS) | |
 | |
| Duration | September 15 – September 19 |
|---|---|
| Peak intensity | 65 mph (100 km/h) (1-min) 991 mbar (hPa) |
Hurricane Nicole[]
| Category 1 hurricane (SSHWS) | |
 | |
| Duration | September 19 – September 25 |
|---|---|
| Peak intensity | 85 mph (140 km/h) (1-min) 968 mbar (hPa) |
Hurricane Otto[]
| Category 1 hurricane (SSHWS) | |
 | |
| Duration | September 22 – September 30 |
|---|---|
| Peak intensity | 75 mph (120 km/h) (1-min) 987 mbar (hPa) |
Tropical Storm Paula[]
| Tropical storm (SSHWS) | |
 | |
| Duration | September 24 – September 29 |
|---|---|
| Peak intensity | 50 mph (85 km/h) (1-min) 1000 mbar (hPa) |
Tropical Storm Richard[]
| Tropical storm (SSHWS) | |
 | |
| Duration | September 28 – October 2 |
|---|---|
| Peak intensity | 45 mph (75 km/h) (1-min) 1000 mbar (hPa) |
Hurricane Shary[]
| Category 3 hurricane (SSHWS) | |
 | |
| Duration | October 3 – October 12 |
|---|---|
| Peak intensity | 115 mph (185 km/h) (1-min) 942 mbar (hPa) |
Hurricane Tobias[]
| Category 4 hurricane (SSHWS) | |
 | |
| Duration | October 10 – October 22 |
|---|---|
| Peak intensity | 135 mph (215 km/h) (1-min) 945 mbar (hPa) |
Tropical Storm Virginie[]
| Tropical storm (SSHWS) | |
 | |
| Duration | October 15 – October 21 |
|---|---|
| Peak intensity | 60 mph (95 km/h) (1-min) 993 mbar (hPa) |
Hurricane Walter[]
| Category 2 hurricane (SSHWS) | |
 | |
| Duration | October 19 – October 30 |
|---|---|
| Peak intensity | 110 mph (175 km/h) (1-min) 962 mbar (hPa) |
Hurricane Alpha[]
| Category 3 hurricane (SSHWS) | |
 | |
| Duration | October 25 – November 1 |
|---|---|
| Peak intensity | 120 mph (190 km/h) (1-min) 958 mbar (hPa) |
Tropical Depression Twenty-Five[]
| Tropical depression (SSHWS) | |
 | |
| Duration | November 2 – November 3 |
|---|---|
| Peak intensity | 35 mph (55 km/h) (1-min) 1006 mbar (hPa) |
Hurricane Beta[]
| Category 1 hurricane (SSHWS) | |
 | |
| Duration | November 10 – November 15 |
|---|---|
| Peak intensity | 90 mph (150 km/h) (1-min) 971 mbar (hPa) |
Hurricane Gamma[]
| Category 5 hurricane (SSHWS) | |
 | |
| Duration | November 14 – November 27 |
|---|---|
| Peak intensity | 165 mph (270 km/h) (1-min) 910 mbar (hPa) |
Hurricane Delta[]
| Category 1 hurricane (SSHWS) | |
 | |
| Duration | November 21 – November 26 |
|---|---|
| Peak intensity | 80 mph (130 km/h) (1-min) 984 mbar (hPa) |
Tropical Storm Epsilon[]
| Tropical storm (SSHWS) | |
 | |
| Duration | November 25 – November 29 |
|---|---|
| Peak intensity | 40 mph (65 km/h) (1-min) 1000 mbar (hPa) |
Hurricane Zeta[]
| Category 4 hurricane (SSHWS) | |
 | |
| Duration | December 10 – December 21 |
|---|---|
| Peak intensity | 140 mph (220 km/h) (1-min) 938 mbar (hPa) |
Timeline[]

Accumulated Cyclone Energy (ACE) Rating[]
| ACE (104 kt2) – Storm: Source | |||||
|---|---|---|---|---|---|
| 1 | 43.6 | Karl | 12 | 8.79 | Nicole |
| 2 | 27.9 | Fiona | 13 | 9.42 | Colin |
| 3 | 27.5 | Ian | 14 | 7.57 | Danielle |
| 4 | 25.2 | Gaston | 15 | 5.36 | Beta |
| 5 | 22.4 | Tobias | 16 | 3.44 | Hermine |
| 6 | 21.2 | Alpha | 17 | 2.85 | Otto |
| 7 | 20.8 | Shary | 18 | 0.767 | Matthew |
| 8 | 17.4 | Julia | 19 | 0.696 | Virginie |
| 9 | 15.8 | Alex | 20 | 0.582 | Paula |
| 10 | 11.1 | Lisa | 21 | 0.329 | Richard |
| 11 | 10.6 | Walter | 22 | 0.135 | Earl |
| Total=283.36 (Record high) | |||||
ACE is the result of a storm's winds multiplied by how long it lasted for, so storms that lasted a long time , as well as particularly strong hurricanes , have higher ACE totals. 2016 was hyperactive in these terms; with an ACE total of 283. Tropical depressions and subtropical storms, namely Subtropical Storm Bonnie and portions of Tropical Storm Richard and Hurricane Alex, are not included in season totals.