The 2017 Atlantic hurricane season began on June 1, 2017 and ended November 30th, 2017.
Seasonal forecasts[]
| Source | Date | Named
storms |
Hurricanes | Major
hurricanes | |
| NOAA | May 21, 2017 | 14 | 8 | 3 | |
| ––––––––––––––––––––––––––––––––––––––––––––––––––––––– | |||||
| Actual activity | 16 | 9 | 5 | ||
Season Summary[]
The 2017 Atlantic hurricane season was an Active season, with the first storm Arlene forming on June 2.
The season saw 18 Depressions, 16 named storms, 9 hurricanes and 5 major hurricanes
with 2 becoming Category-5s.
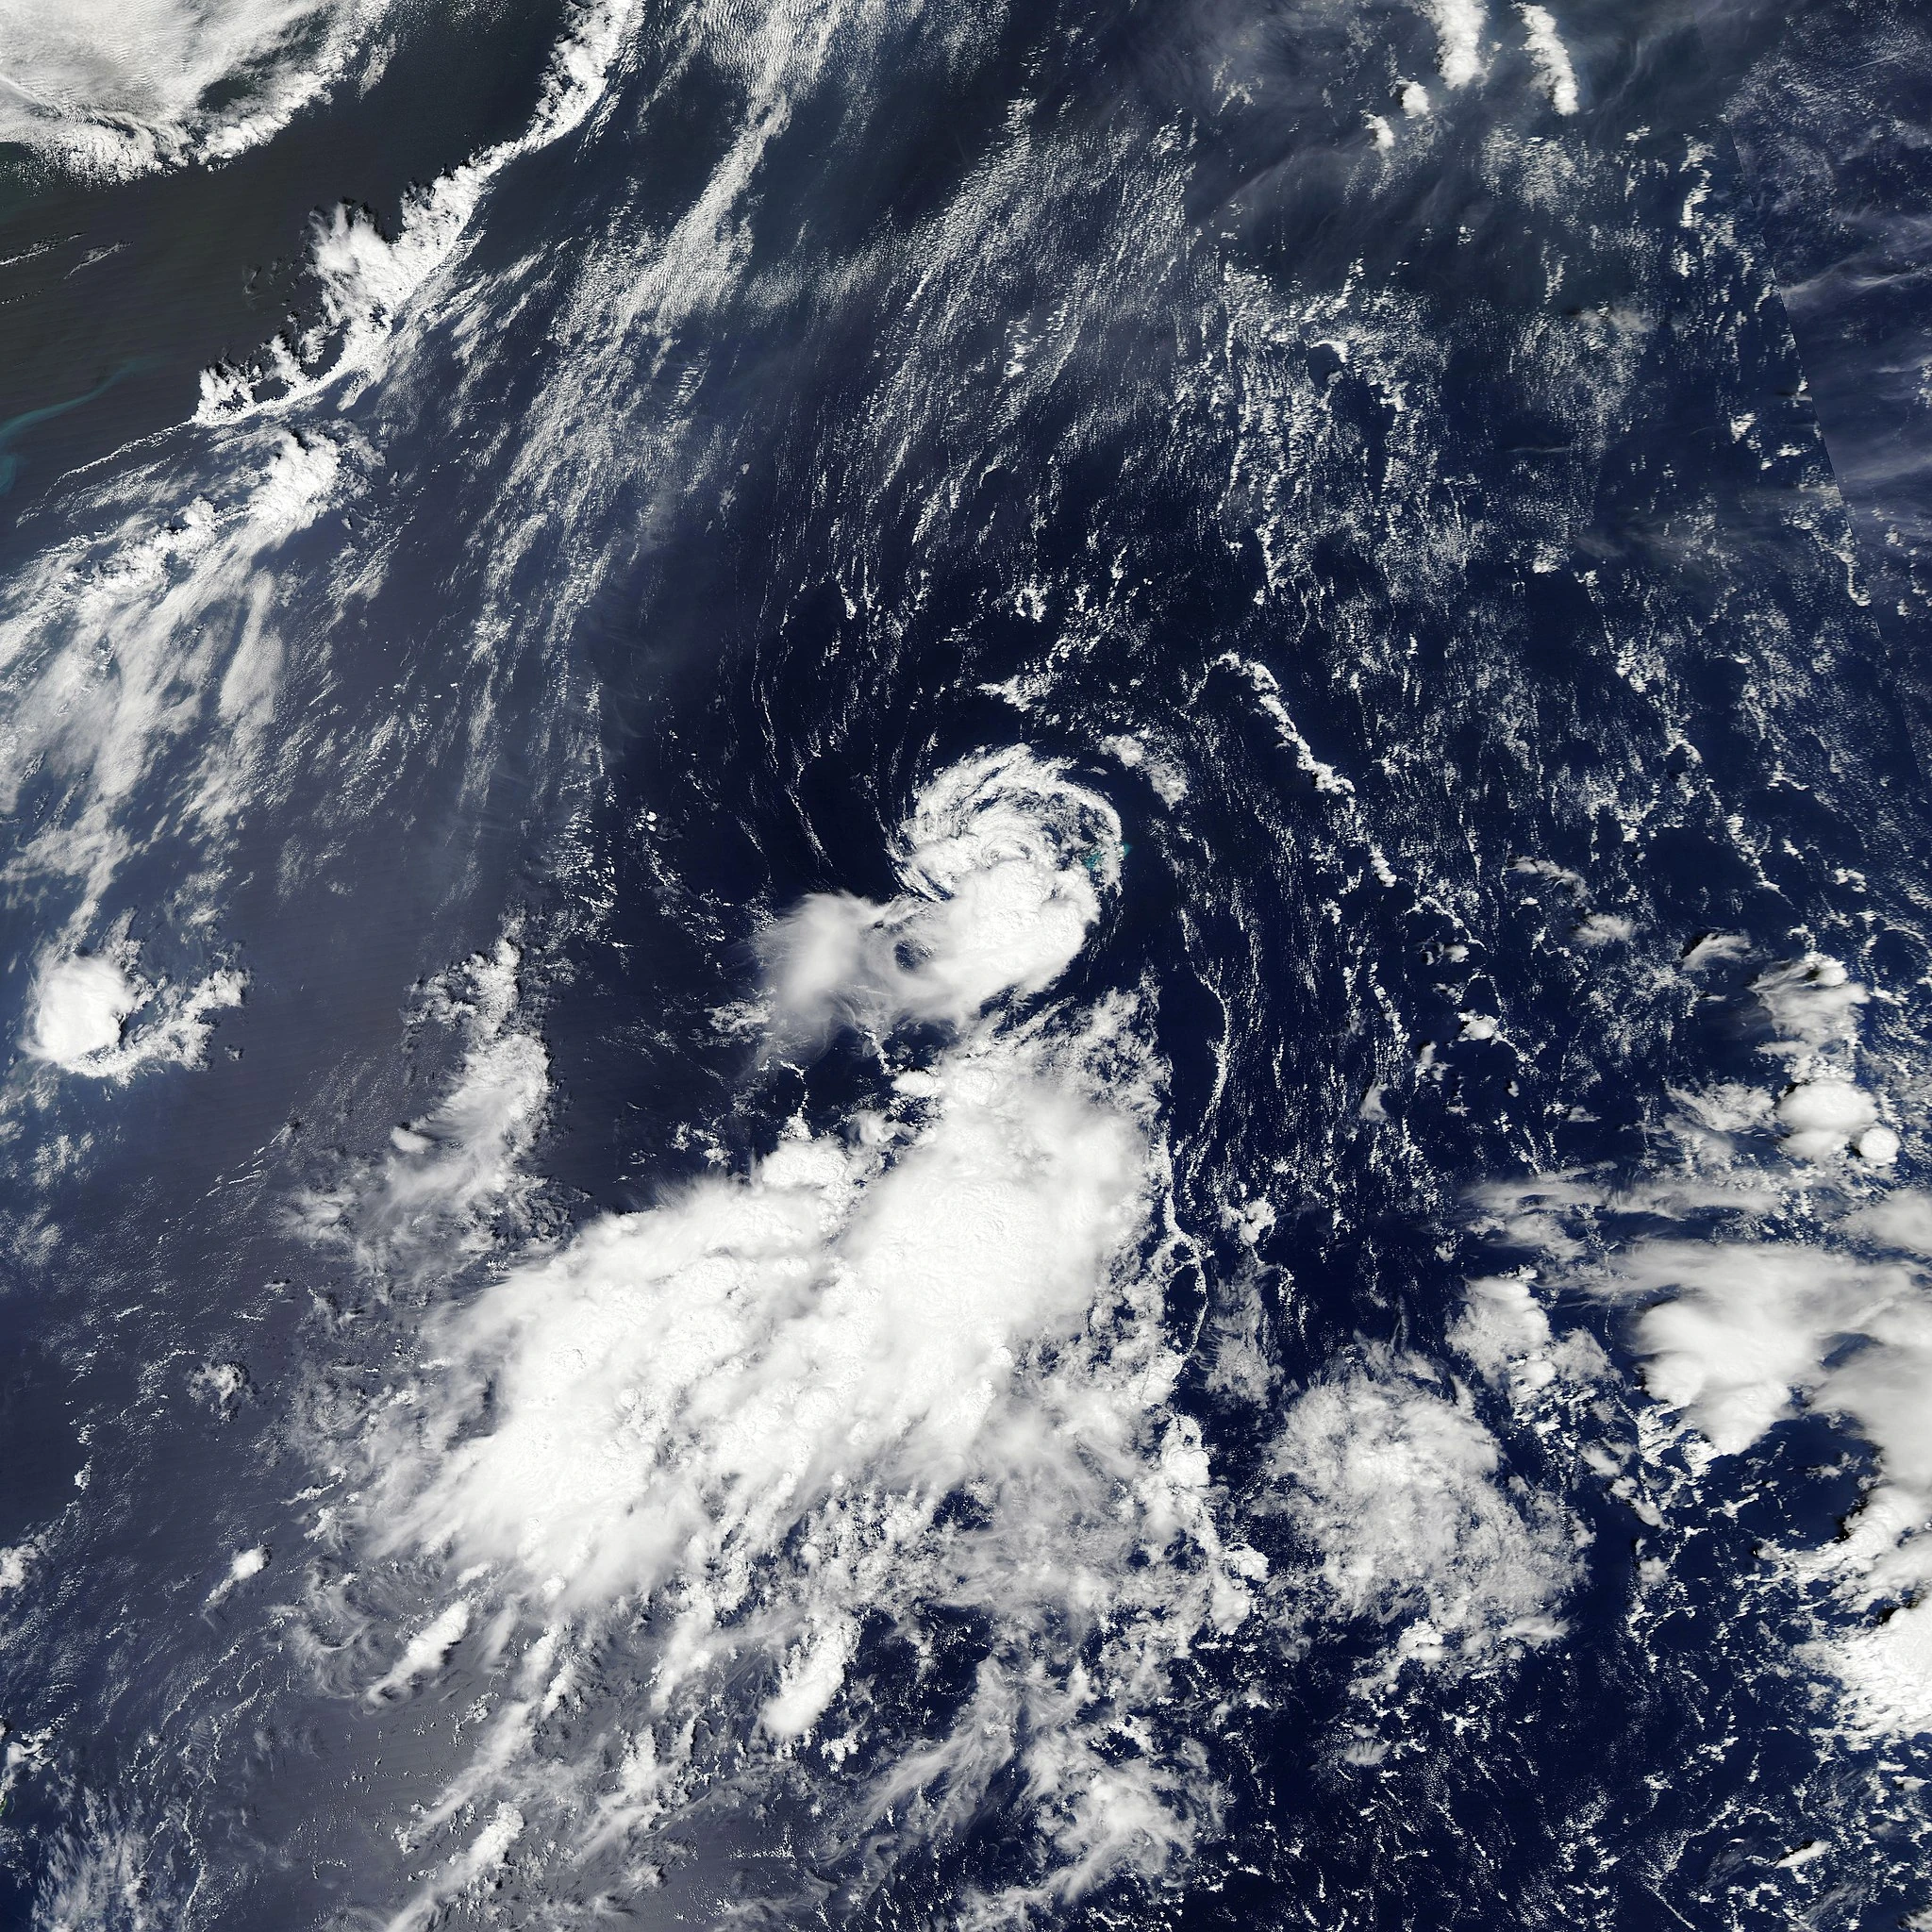
Arlene became the seasons first Hurricane on Late June 4, it weakened due to increased shear and drier air and dissipated on June 6.
Don became the first Major Hurricane to make landfall in the Carolinas since Bonnie of 1998, making landfall in North Carolina as a 115 mph (185 km/h) Category-3 just before Midnight on August 14.
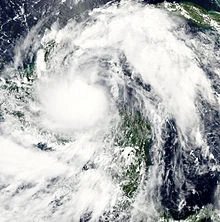
Emily had some considerable effects in Mexico, having made 2 landfalls, the first time as a TS and the 2nd at it's Peak intensity.
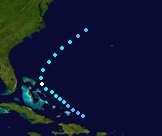
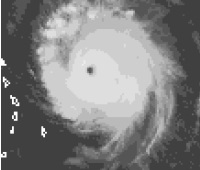
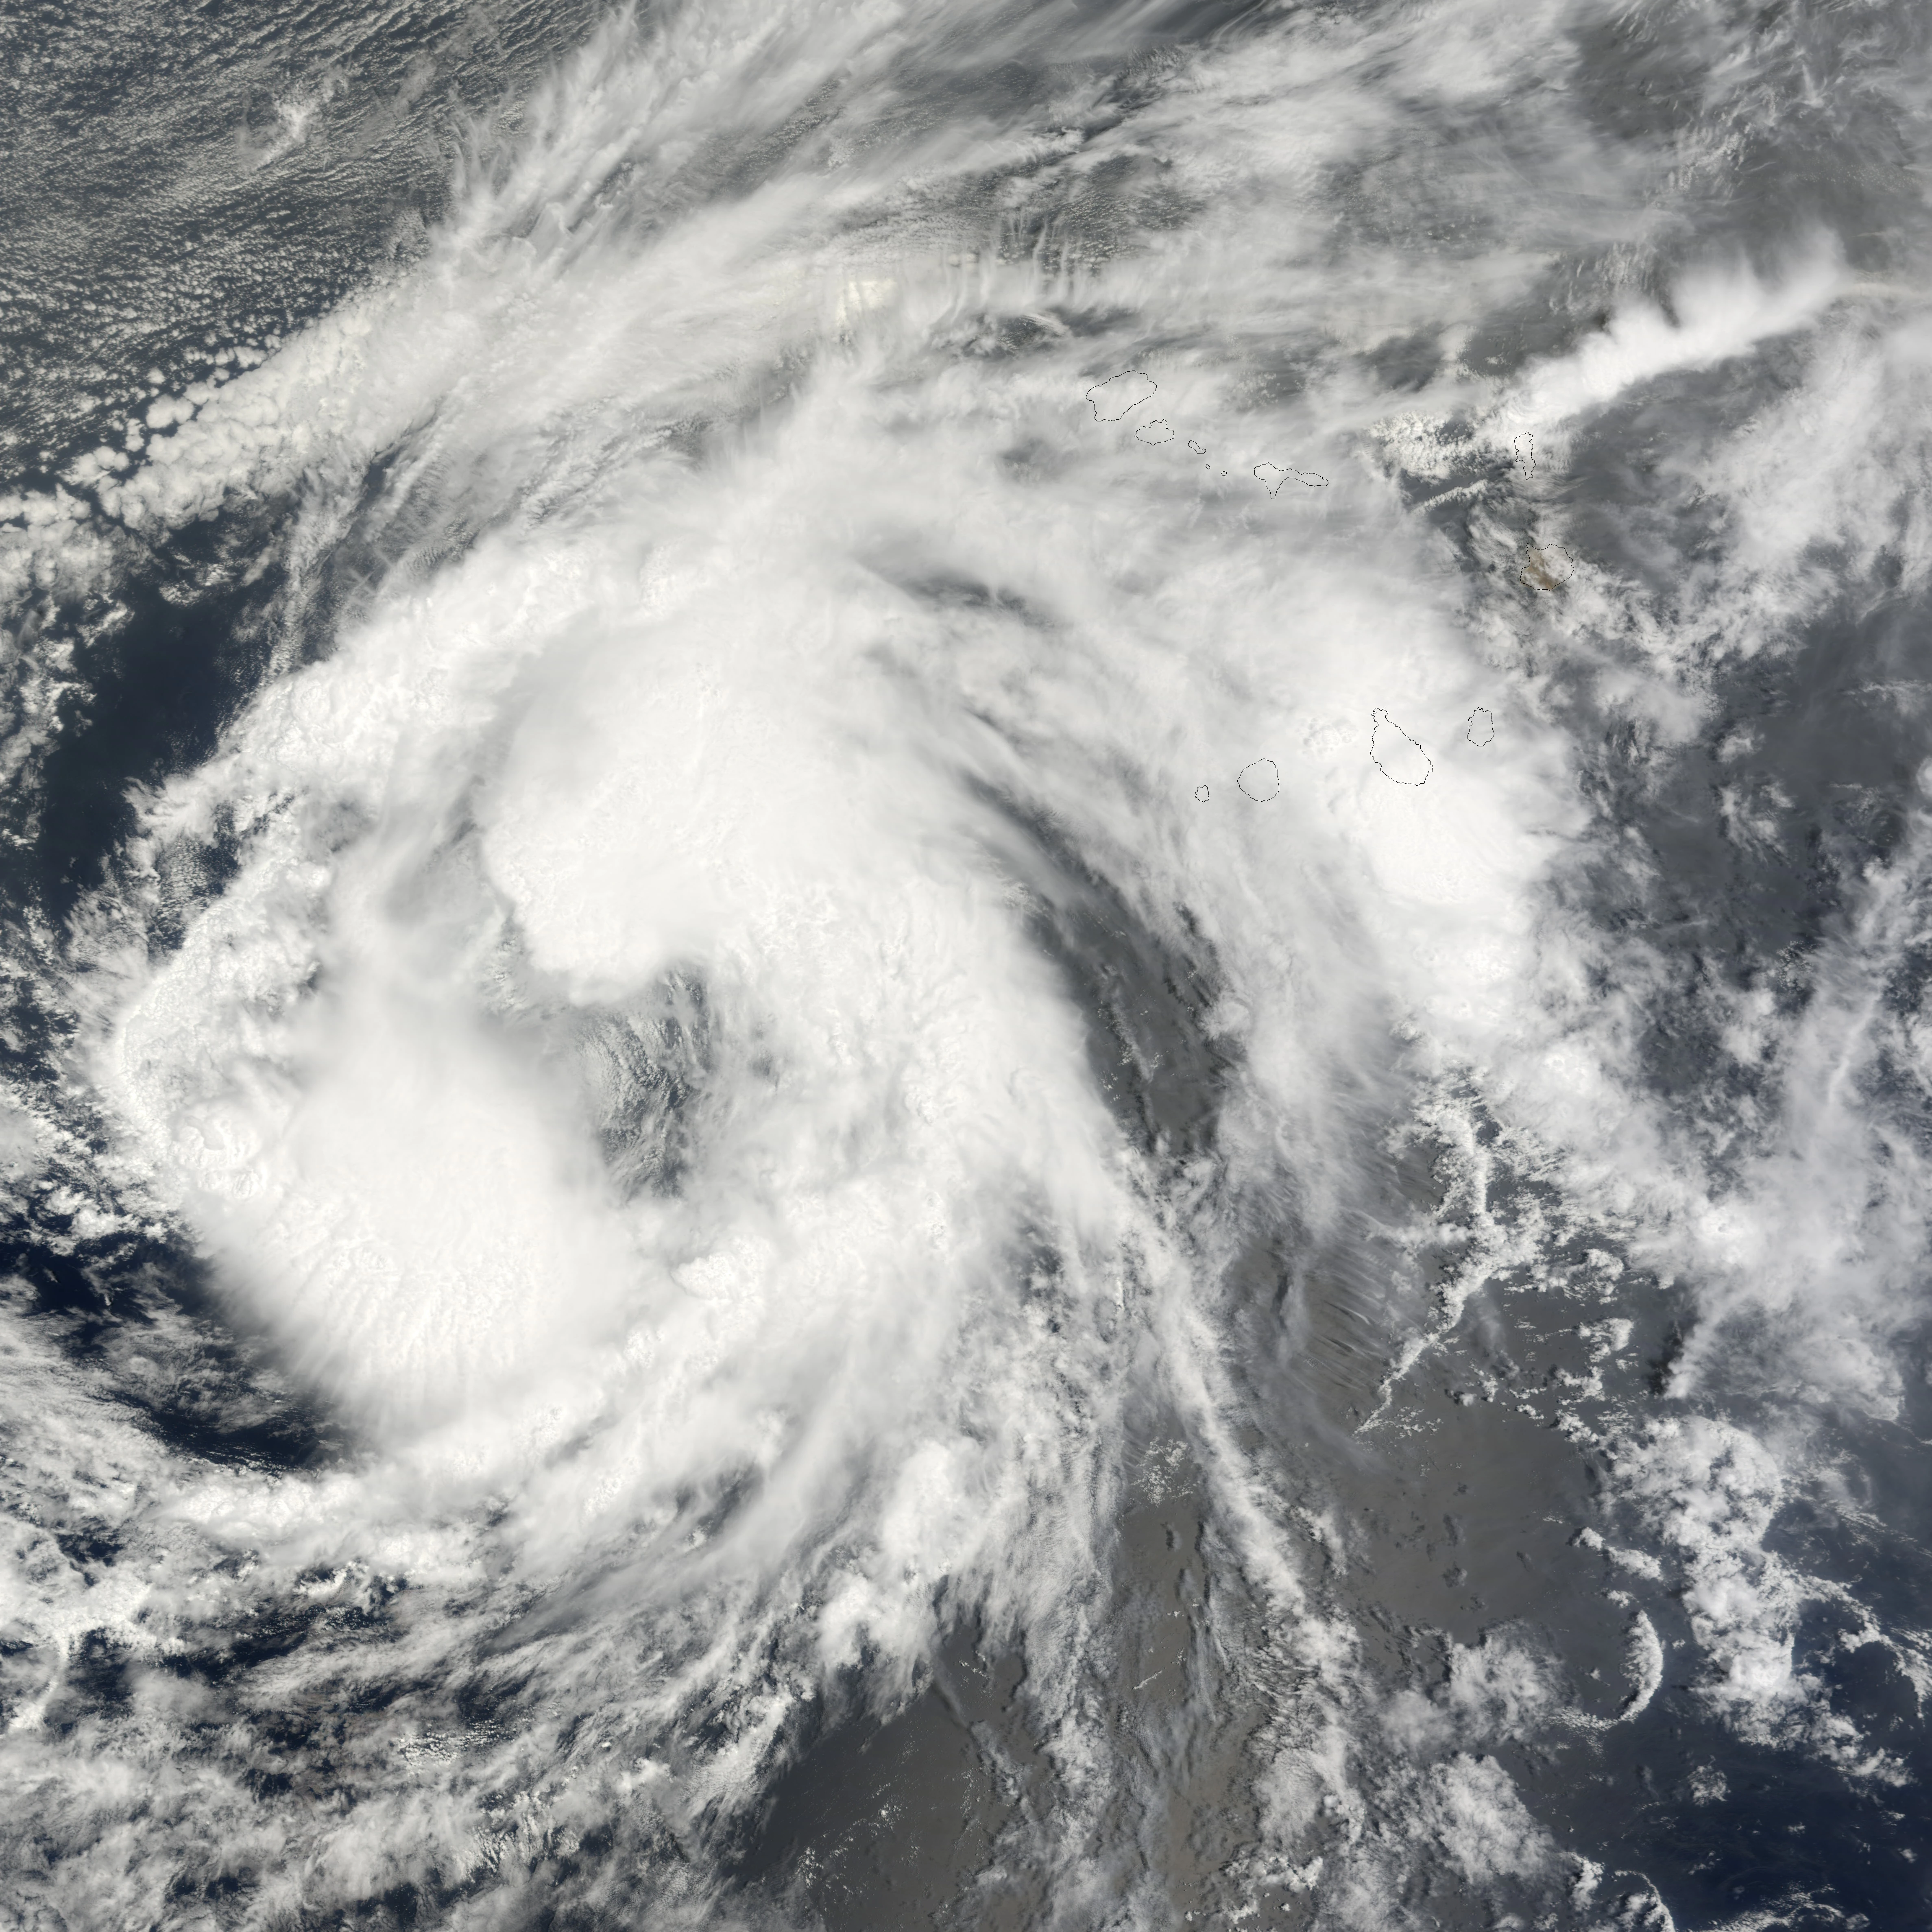
Franklin became the first Category-5 of the season in Late-August, peaking at 160 mph (260 km/h) whilst staying out in the Atlantic.
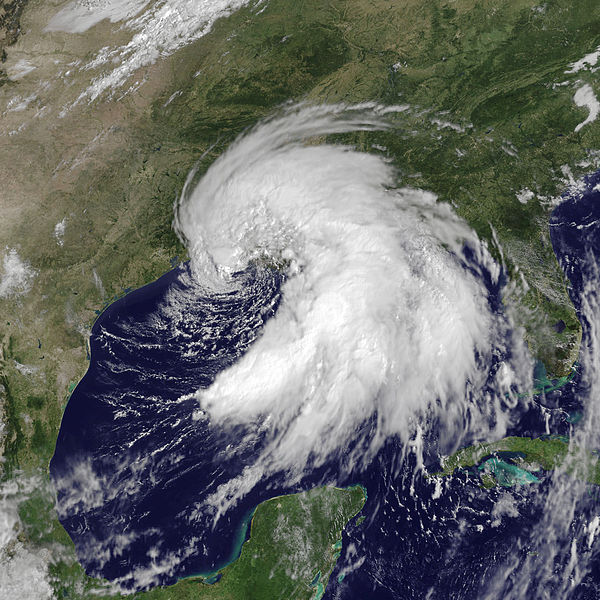
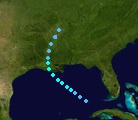
Harvey was one of the most destructive hurricanes to hit the US Gulf Coast, peaking at 175 mph (280 km/h) in Early-September, it later made landfall in Texas as a 135 mph (215 km/h) Category-4 early on September 10, the peak of the Season.
Irma became an intense Category-4 in Early/Mid-September, peaking at 145 mph (230 km/h) whilst staying out in the Atlantic.
Lee had considerable effects in Nicaragua in Late-September, making landfall as a Category-2
Maria was another intense Category-4 in Early-October, striking Bermuda as a Category-2.
Lastly, Philippe caused problems in the Caribbean in Early-November, it peaked as a Category-2 before dissipating November 7.
The season collectively caused $56.5 billion (2015 USD) in damage and claimed 1,180 lives
Storms[]
|
Hurricane Arlene[]
| Category 1 hurricane (SSHWS) | |
  | |
| Duration | June 2 – June 6 |
|---|---|
| Peak intensity | 75 mph (120 km/h) (1-min) 987 mbar (hPa) |
Tropical Depression Two[]
| Tropical depression (SSHWS) | |
  | |
| Duration | June 30 – July 2 |
|---|---|
| Peak intensity | 35 mph (55 km/h) (1-min) 1004 mbar (hPa) |
Tropical Storm Bret[]
| Tropical storm (SSHWS) | |
  | |
| Duration | July 17 – July 22 |
|---|---|
| Peak intensity | 65 mph (100 km/h) (1-min) 993 mbar (hPa) |
Tropical Storm Cindy[]
| Tropical storm (SSHWS) | |
  | |
| Duration | August 1 – August 4 |
|---|---|
| Peak intensity | 60 mph (95 km/h) (1-min) 995 mbar (hPa) |
Hurricane Don[]
| Category 3 hurricane (SSHWS) | |
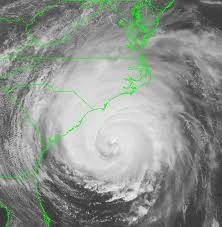  | |
| Duration | August 6 – August 18 |
|---|---|
| Peak intensity | 125 mph (205 km/h) (1-min) 943 mbar (hPa) |
Hurricane Emily[]
| Category 1 hurricane (SSHWS) | |
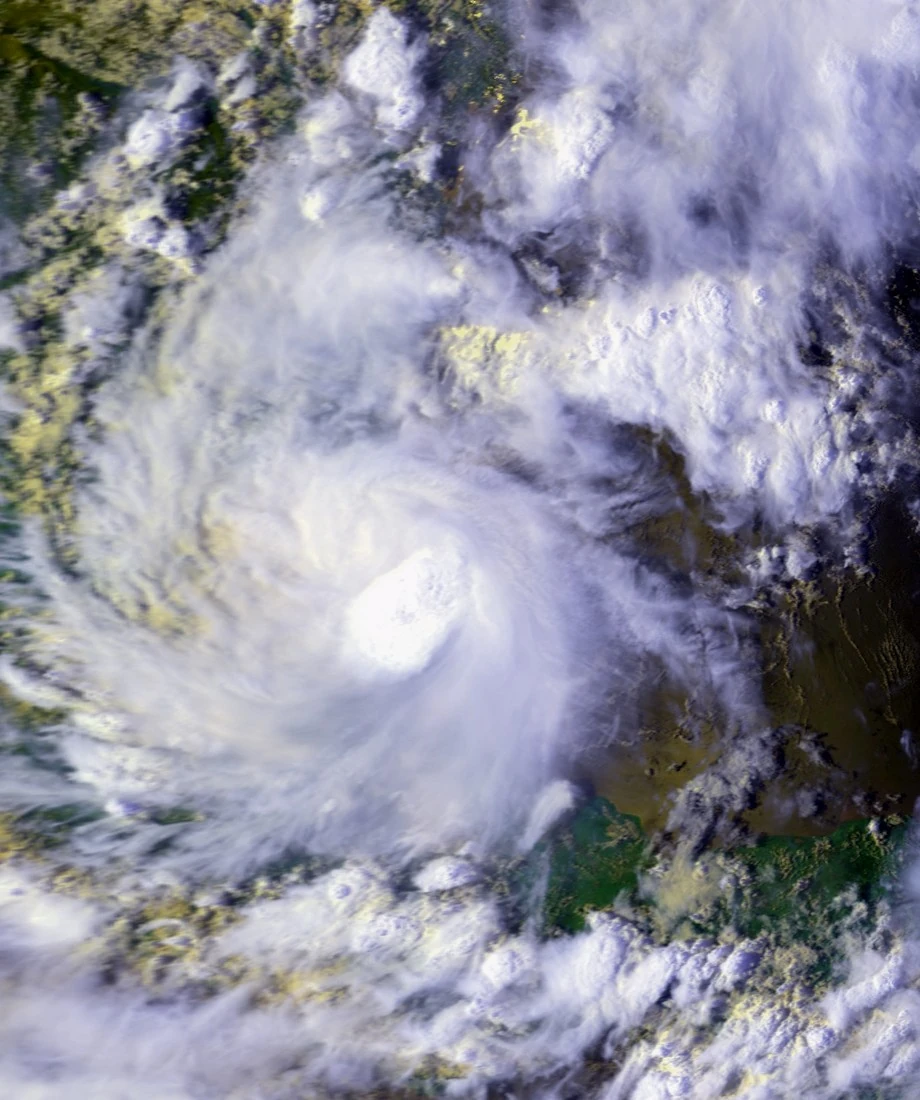 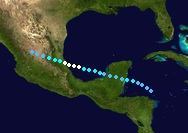 | |
| Duration | August 11 – August 16 |
|---|---|
| Peak intensity | 85 mph (140 km/h) (1-min) 979 mbar (hPa) |
Hurricane Franklin[]
| Category 5 hurricane (SSHWS) | |
  | |
| Duration | August 17 – August 31 |
|---|---|
| Peak intensity | 160 mph (260 km/h) (1-min) 920 mbar (hPa) |
Tropical Storm Gert[]
| Tropical storm (SSHWS) | |
  | |
| Duration | August 21 – August 24 |
|---|---|
| Peak intensity | 70 mph (110 km/h) (1-min) 985 mbar (hPa) |
Hurricane Harvey[]
| Category 5 hurricane (SSHWS) | |
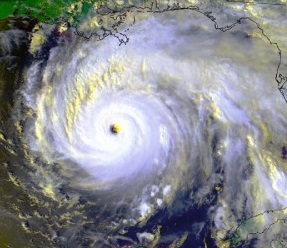 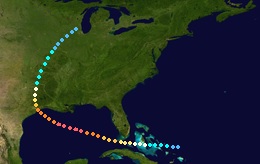 | |
| Duration | August 31 – September 14 |
|---|---|
| Peak intensity | 175 mph (280 km/h) (1-min) 900 mbar (hPa) |
Hurricane Irma[]
| Category 4 hurricane (SSHWS) | |
  | |
| Duration | September 2 – September 18 |
|---|---|
| Peak intensity | 150 mph (240 km/h) (1-min) 930 mbar (hPa) |
Tropical Depression Eleven[]
| Tropical depression (SSHWS) | |
  | |
| Duration | September 6 – September 8 |
|---|---|
| Peak intensity | 35 mph (55 km/h) (1-min) 1002 mbar (hPa) |
Hurricane Jose[]
| Category 1 hurricane (SSHWS) | |
  | |
| Duration | September 10 – September 16 |
|---|---|
| Peak intensity | 75 mph (120 km/h) (1-min) 987 mbar (hPa) |
Tropical Storm Katia[]
| Tropical storm (SSHWS) | |
  | |
| Duration | September 14 – September 17 |
|---|---|
| Peak intensity | 50 mph (85 km/h) (1-min) 996 mbar (hPa) |
Hurricane Lee[]
| Category 2 hurricane (SSHWS) | |
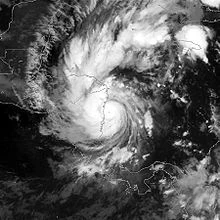  | |
| Duration | September 24 – September 30 |
|---|---|
| Peak intensity | 105 mph (165 km/h) (1-min) 961 mbar (hPa) |
Hurricane Maria[]
| Category 4 hurricane (SSHWS) | |
  | |
| Duration | September 29 – October 12 |
|---|---|
| Peak intensity | 145 mph (230 km/h) (1-min) 934 mbar (hPa) |
Tropical Storm Nate[]
| Tropical storm (SSHWS) | |
  | |
| Duration | October 9 – October 12 |
|---|---|
| Peak intensity | 45 mph (75 km/h) (1-min) 999 mbar (hPa) |
Tropical Storm Ophelia[]
| Tropical storm (SSHWS) | |
  | |
| Duration | October 18 – October 22 |
|---|---|
| Peak intensity | 45 mph (75 km/h) (1-min) 999 mbar (hPa) |
Hurricane Philippe[]
| Category 2 hurricane (SSHWS) | |
  | |
| Duration | October 31 – November 7 |
|---|---|
| Peak intensity | 100 mph (155 km/h) (1-min) 968 mbar (hPa) |
Tropical Depression Nineteen[]
| Tropical depression (SSHWS) | |
  | |
| Duration | November 10 – November 12 |
|---|---|
| Peak intensity | 35 mph (55 km/h) (1-min) 1003 mbar (hPa) |
Timeline[]

Storm names[]
The following names will be used to name tropical and subtropical cyclones in the 2017 season.
|
|
|
Retirement[]
During the WMO meeting on April 9, 2018, the names Don, Harvey and Maria were officially retired Due to extensive damage and deaths. They were replaced by Dylan, Harold and Minerva for the 2023 season.
-The List for 2023-
|
|
|
Accumulated Cyclone Energy (ACE) Rating[]
| ACE (104 kt2) – Storm: Source | |||||
|---|---|---|---|---|---|
| 1 | 39.9 | Harvey | 12 | 3.18 | Bret |
| 2 | 32.6 | Franklin | 13 | 2.90 | Cindy |
| 3 | 28.0 | Irma | 14 | 2.42 | Katia |
| 4 | 24.5 | Maria | 15 | 2.00 | Ophelia |
| 5 | 17.6 | Don | 16 | 1.49 | Nate |
| 6 | 12.8 | Lee | 17 | 0.00 | Storm |
| 7 | 10.5 | Philippe | 18 | 0.00 | Storm |
| 8 | 7.23 | Emily | 19 | 0.00 | Storm |
| 9 | 5.01 | Arlene | 20 | 0.00 | Storm |
| 10 | 4.22 | Jose | 21 | 0.00 | Storm |
| 11 | 3.65 | Gert | 22 | 0.00 | Storm |
| Total=201 | |||||
ACE is the result of a storm's winds multiplied by how long it lasted for, so storms or subtropical storms (Originally not included up until 2012) that at lasted a long time , as well as particularly strong hurricanes , have higher ACE totals. Tropical Depressions are not included in season total.
Season effects[]
This is a table of the storms and their effects in the 2017 Atlantic hurricane season. This table includes the storm's names, duration, peak intensity, Areas affected (bold indicates made landfall in that region at least once), damages, and death totals. Deaths in parentheses are additional and indirect (an example of an indirect death would be a traffic accident), but are still storm-related. Damage and deaths include totals while the storm was extratropical, a wave or a low. All of the damage figures are in 2015 USD (the listed damage figure is in millions).
| Storm name |
Dates active | Storm category at peak intensity |
Max 1-min wind mph (km/h) |
Min. press. (mbar) |
Areas affected | Damage (USD) |
Deaths |
|---|---|---|---|---|---|---|---|
| Arlene | June 2 – June 6 | Category 1 hurricane | 75 (120) | 987 | The Bahamas | Minor | 0 |
| Two | June 30 – July 2 | Tropical depression | 35 (55) | 1004 | None | 0 | 0 |
| Bret | July 17 – July 22 | Tropical storm | 65 (100) | 993 | None | 0 | 0 |
| Cindy | August 1 – August 4 | Tropical storm | 60 (95) | 995 | None | 0 | 0 |
| Don | August 6 – August 18 | Category 3 hurricane | 125 (205) | 943 | US East Coast (North Carolina) | 10,500 | 120 |
| Emily | August 11 – August 16 | Category 1 hurricane | 85 (140) | 979 | Mexico | 100 | 10 |
| Franklin | August 17 – August 31 | Category 5 hurricane | 160 (260) | 920 | None | 0 | 0 |
| Gert | August 21 – August 24 | Tropical storm | 70 (110) | 985 | Mexico | 30 | 9 |
| Harvey | August 31 – September 14 | Category 5 hurricane | 175 (280) | 900 | US Gulf Coast (Texas), The Bahamas | 45,000 | 1,000 |
| Irma | September 2 – September 18 | Category 4 hurricane | 150 (240) | 930 | None | 0 | 0 |
| Eleven | September 6 – September 8 | Tropical depression | 35 (55) | 1004 | None | 0 | 0 |
| Jose | September 10 – September 16 | Category 1 hurricane | 75 (120) | 987 | None | 0 | 0 |
| Katia | September 14 – September 17 | Tropical storm | 50 (85) | 996 | US Gulf Coast (Louisiana) | 10 | 5 |
| Lee | September 24 – September 30 | Category 2 hurricane | 105 (165) | 961 | Nicaragua | 270 | 12 |
| Maria | September 29 – October 12 | Category 4 hurricane | 145 (230) | 934 | Bermuda | 500 | 17 |
| Nate | October 9 – October 12 | Tropical storm | 45 (75) | 999 | None | 0 | 0 |
| Ophelia | October 18 – October 22 | Tropical storm | 45 (75) | 999 | None | 0 | 0 |
| Philippe | October 31 – November 7 | Category 2 hurricane | 100 (155) | 968 | The Bahamas, Cuba, Hispaniola | 100 | 11 |
| Nineteen | November 10 – November 12 | Tropical depression | 35 (55) | 1003 | Azores | Minor | 1 |