The 2008 Atlantic hurricane season began on June 1st, 2008 and will end November 30th, 2008.
The season Started with the formation of Tropical Storm Arthur on June 9th, a week after the official started.
Seasonal forecasts[]
| Source | Date | Named
storms |
Hurricanes | Major
hurricanes | |
| NOAA | May 3, 2008 | 14 | 7 | 2 | |
| ––––––––––––––––––––––––––––––––––––––––––––––––––––––– | |||||
| Actual activity | 4 | 2 | 1 | ||
Season Summary[]
Storms[]
|
Tropical Storm Arthur[]
| Tropical storm (SSHWS) | |
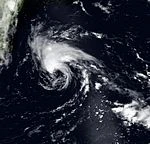  | |
| Duration | June 9 – June 13 |
|---|---|
| Peak intensity | 60 mph (95 km/h) (1-min) 992 mbar (hPa) |
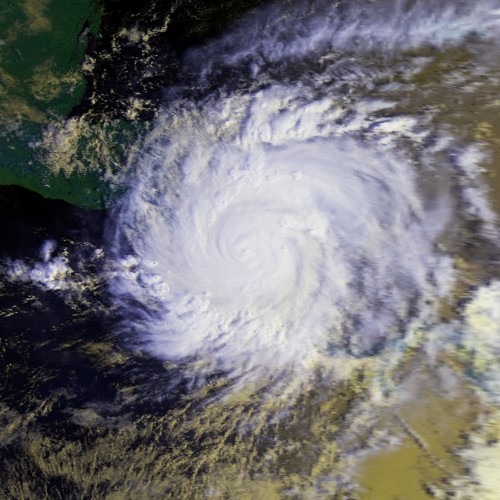
Hurricane Bertha[]
| Category 4 hurricane (SSHWS) | |
  | |
| Duration | June 30 – July 10 |
|---|---|
| Peak intensity | 135 mph (215 km/h) (1-min) 941 mbar (hPa) |
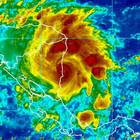
Hurricane Cristobal[]
| Category 2 hurricane (SSHWS) | |
 | |
| Duration | July 4 – July 11 <sub\> (Crossed into EPac) <sub\> |
|---|---|
| Peak intensity | 105 mph (165 km/h) (1-min) 965 mbar (hPa) |
Tropical Storm Dolly[]
| Tropical storm (SSHWS) | |
  | |
| Duration | July 17 – July 21 <sub\> (Crossed into EPac) <sub\> |
|---|---|
| Peak intensity | 65 mph (100 km/h) (1-min) 989 mbar (hPa) |
Tropical Depression Five[]
| Tropical depression (SSHWS) | |
  | |
| Duration | July 29 – July 31 |
|---|---|
| Peak intensity | 35 mph (55 km/h) (1-min) 1004 mbar (hPa) |
Timeline[]

Storm names[]
The following names will be used to name tropical and subtropical cyclones in the 2008 season.
|
|
|
Accumulated Cyclone Energy (ACE) Rating[]
| ACE (104 kt2) – Storm: Source | |||||
|---|---|---|---|---|---|
| 1 | 0.00 | Storm | 12 | 0.00 | Storm |
| 2 | 0.00 | Storm | 13 | 0.00 | Storm |
| 3 | 0.00 | Storm | 14 | 0.00 | Storm |
| 4 | 0.00 | Storm | 15 | 0.00 | Storm |
| 5 | 0.00 | Storm | 16 | 0.00 | Storm |
| 6 | 0.00 | Storm | 17 | 0.00 | Storm |
| 7 | 0.00 | Storm | 18 | 0.00 | Storm |
| 8 | 0.00 | Storm | 19 | 0.00 | Storm |
| 9 | 0.00 | Storm | 20 | 0.00 | Storm |
| 10 | 0.00 | Storm | 21 | 0.00 | Storm |
| 11 | 0.00 | Storm | 22 | 0.00 | Storm |
| Total=0.0 | |||||
ACE is the result of a storm's winds multiplied by how long it lasted for, so storms or subtropical storms (Originally not included up until 2012) that at lasted a long time , as well as particularly strong hurricanes , have higher ACE totals. Tropical Depressions are not included in season total.
Season effects[]
This is a table of the storms and their effects in the 2008 Atlantic hurricane season. This table includes the storm's names, duration, peak intensity, Areas affected (bold indicates made landfall in that region at least once), damages, and death totals. Deaths in parentheses are additional and indirect (an example of an indirect death would be a traffic accident), but are still storm-related. Damage and deaths include totals while the storm was extratropical, a wave or a low. All of the damage figures are in 2008 USD (the listed damage figure is in millions).
| Storm name |
Dates active | Storm category at peak intensity |
Max 1-min wind mph (km/h) |
Min. press. (mbar) |
Areas affected | Damage (USD) |
Deaths |
|---|---|---|---|---|---|---|---|
| Arthur | June 9 – June 13 | Tropical storm | 60 (95) | 992 | Bermuda | Minor | 0 |
| Bertha | June 30 – July 10 | Category 4 hurricane | 135 (215) | 941 | US East Coast (Florida), The Bahamas, Puerto Rico | 10,500 | 111 |
| Cristobal | July 4 – July 11 | Category 2 hurricane | 105 (165) | 965 | Venezuela, Nicaragua, Mexico | 390 | 21 |
| Dolly | July 17 – July 21 | Tropical storm | 65 (100) | 989 | Venezuela, Nicaragua, Mexico | 30 | 9 |
| Five | July 29 – July 31 | Tropical depression | 35 (55) | 1004 | US East Coast (Florida), The Bahamas | 5 | 4 |