The 2025 Atlantic hurricane season was a season which saw above average activity.
Storms[]
Hurricane Andrea[]
| Category 1 hurricane (SSHWS) | |
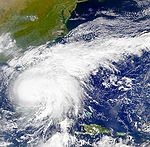 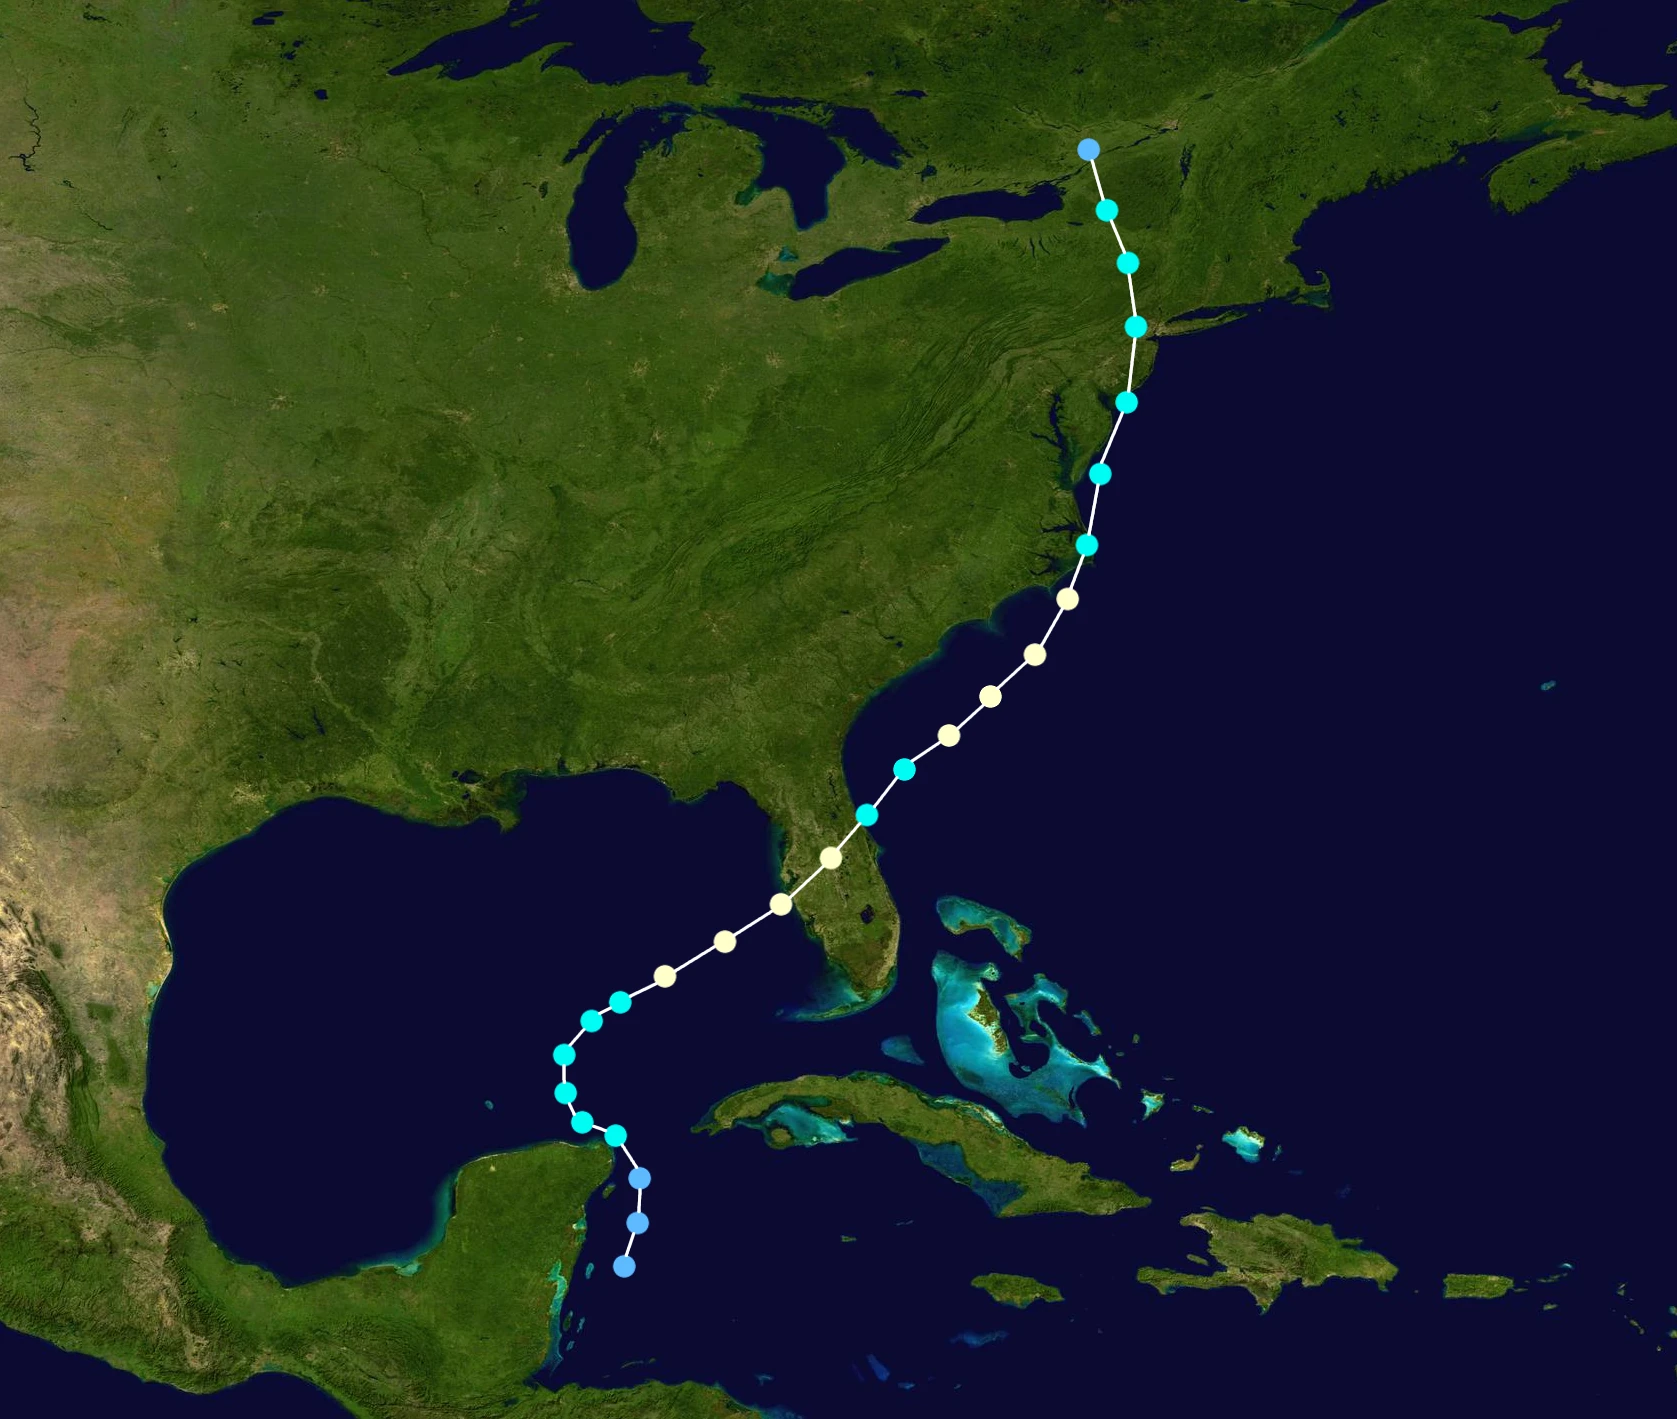 | |
| Duration | June 1 – June 7 |
|---|---|
| Peak intensity | 85 mph (140 km/h) (1-min) 980 mbar (hPa) |
Tropical Storm Barry[]
| Tropical storm (SSHWS) | |
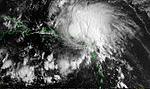 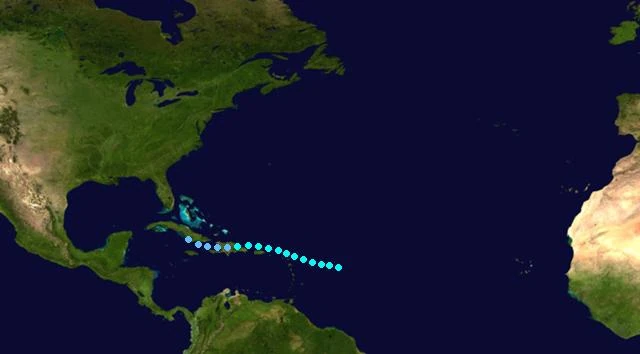 | |
| Duration | June 15 – June 21 |
|---|---|
| Peak intensity | 70 mph (110 km/h) (1-min) 986 mbar (hPa) |
Hurricane Chantal[]
| Category 3 hurricane (SSHWS) | |
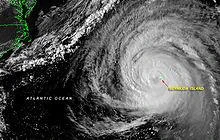  | |
| Duration | July 8 – July 17 |
|---|---|
| Peak intensity | 125 mph (205 km/h) (1-min) 946 mbar (hPa) |
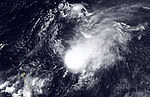
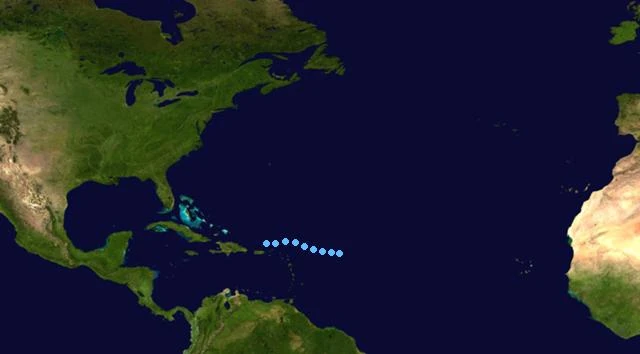
Tropical Storm Dorian[]
| Tropical storm (SSHWS) | |
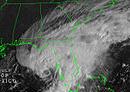 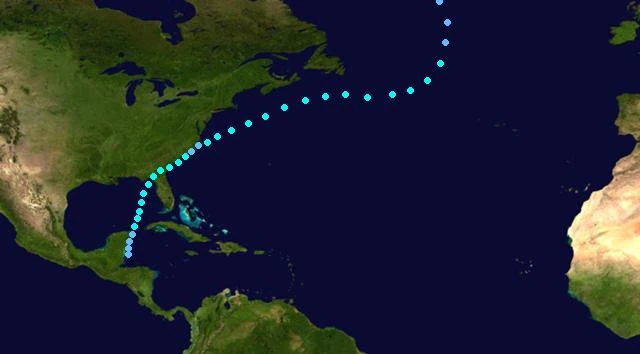 | |
| Duration | July 14 – July 20 |
|---|---|
| Peak intensity | 70 mph (110 km/h) (1-min) 985 mbar (hPa) |
Tropical Depression Five[]
| Tropical depression (SSHWS) | |
  | |
| Duration | July 16 – July 18 |
|---|---|
| Peak intensity | 35 mph (55 km/h) (1-min) 1002 mbar (hPa) |
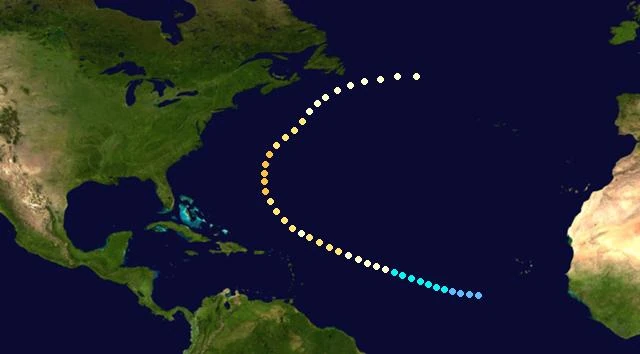
Hurricane Erin[]
| Category 4 hurricane (SSHWS) | |
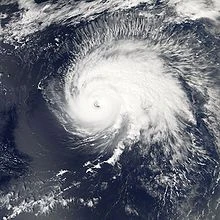 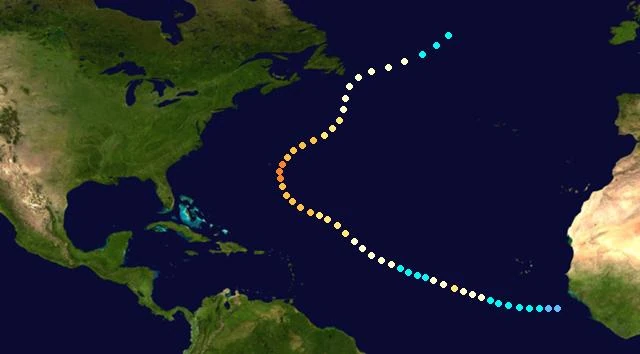 | |
| Duration | July 27 – August 6 |
|---|---|
| Peak intensity | 135 mph (215 km/h) (1-min) 940 mbar (hPa) |
Timeline[]

Accumulated Cyclone Energy (ACE) Rating[]
| ACE (104 kt2) – Storm: Source | |||||
|---|---|---|---|---|---|
| 1 | 0.00 | Storm | 12 | 0.00 | Storm |
| 2 | 0.00 | Storm | 13 | 0.00 | Storm |
| 3 | 0.00 | Storm | 14 | 0.00 | Storm |
| 4 | 0.00 | Storm | 15 | 0.00 | Storm |
| 5 | 0.00 | Storm | 16 | 0.00 | Storm |
| 6 | 0.00 | Storm | 17 | 0.00 | Storm |
| 7 | 0.00 | Storm | 18 | 0.00 | Storm |
| 8 | 0.00 | Storm | 19 | 0.00 | Storm |
| 9 | 0.00 | Storm | 20 | 0.00 | Storm |
| 10 | 0.00 | Storm | 21 | 0.00 | Storm |
| 11 | 0.00 | Storm | 22 | 0.00 | Storm |
| Total=0.00 | |||||
ACE is the result of a storm's winds multiplied by how long it lasted for, so storms or subtropical storms (Originally not included up until 2012) that at lasted a long time , as well as particularly strong hurricanes , have higher ACE totals. Tropical Depressions are not included in season totals.
Season effects[]
This is a table of the storms and their effects in the 2025 Atlantic hurricane season. This table includes the storm's names, duration, peak intensity, Areas affected (bold indicates made landfall in that region at least once), damages, and death totals. Deaths in parentheses are additional and indirect (an example of an indirect death would be a traffic accident), but are still storm-related. Damage and deaths include totals while the storm was extratropical, a wave or a low. All of the damage figures are in 2025 USD (the listed damage figure is in millions).
|
Tropical cyclones of the 2025 Atlantic hurricane season | ||||||||||||||||||||||
|
|
| |||||||||||||||||||||
|
| ||||||||||||||||||||||
| Storm name |
Dates active | Storm category at peak intensity |
Max 1-min wind mph (km/h) |
Min. press. (mbar) |
Areas affected | Damage (USD) |
Deaths |
|---|---|---|---|---|---|---|---|
| Andrea | June 1 – June 7 | Category 1 hurricane | 85 (140) | 980 | US East Coast (New Jersey) (North Carolina), US Gulf Coast (Florida), Mexico | 210 | 16 |
| Barry | June 15 – June 21 | Tropical storm | 70 (110) | 986 | Cuba, Hispaniola, Puerto Rico | 10 | 5 |
| Chantal | July 8 – July 17 | Category 3 hurricane | 125 (205) | 946 | Bermuda | 500 | 31 |
| Dorian | July 14 – July 20 | Tropical storm | 70 (110) | 985 | US East Coast (North Carolina), US Gulf Coast (Florida), Mexico | 145 | 13 |
| Five | July 16 – July 18 | Tropical depression | 35 (55) | 1002 | None | 0 | 0 |
| Erin | July 27 – August 6 | Category 4 hurricane | 135 (215) | 940 | None | 0 | 0 |