The 1983 Atlantic hurricane season began on June 1st, 1983 and ended November 30th, 1983.
Seasonal forecasts[]
| Source | Date | Named
storms |
Hurricanes | Major
hurricanes | |
| NOAA | May 2, 1983 | 10 | 5 | 2 | |
| ––––––––––––––––––––––––––––––––––––––––––––––––––––––– | |||||
| Actual activity | 8 | 4 | 2 | ||
Season Summary[]
Storms[]
|
Tropical Depression One[]
| Tropical depression (SSHWS) | |
 | |
| Duration | June 28 – June 30 |
|---|---|
| Peak intensity | 35 mph (55 km/h) (1-min) 1004 mbar (hPa) |
Hurricane Alicia[]
| Category 5 hurricane (SSHWS) | |
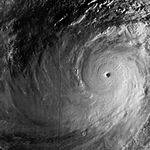 | |
| Duration | August 1 – August 16 |
|---|---|
| Peak intensity | 175 mph (280 km/h) (1-min) 903 mbar (hPa) |
Tropical Storm Barry[]
| Tropical storm (SSHWS) | |
 | |
| Duration | August 9 – August 13 |
|---|---|
| Peak intensity | 50 mph (85 km/h) (1-min) 996 mbar (hPa) |
Tropical Storm Chantal[]
| Tropical storm (SSHWS) | |
 | |
| Duration | August 12 – August 18 |
|---|---|
| Peak intensity | 70 mph (110 km/h) (1-min) 983 mbar (hPa) |
Hurricane Dean[]
| Category 3 hurricane (SSHWS) | |
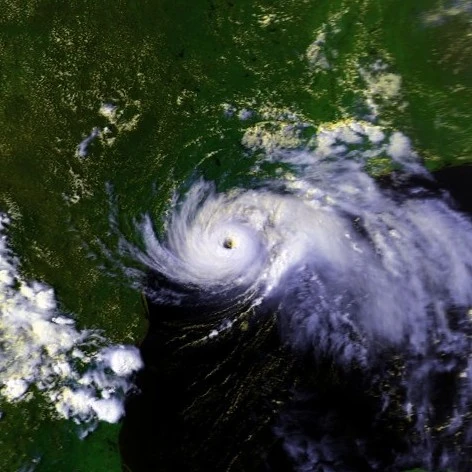 | |
| Duration | August 31 – September 6 |
|---|---|
| Peak intensity | 120 mph (195 km/h) (1-min) 954 mbar (hPa) |
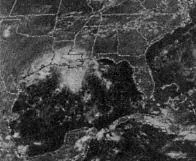
Tropical Depression Six[]
| Tropical depression (SSHWS) | |
 | |
| Duration | September 2 – September 4 |
|---|---|
| Peak intensity | 35 mph (55 km/h) (1-min) 1003 mbar (hPa) |
Hurricane Erin[]
| Category 1 hurricane (SSHWS) | |
 | |
| Duration | September 3 – September 7 |
|---|---|
| Peak intensity | 85 mph (140 km/h) (1-min) 980 mbar (hPa) |
Hurricane Felix[]
| Category 2 hurricane (SSHWS) | |
 | |
| Duration | September 10 – September 18 |
|---|---|
| Peak intensity | 110 mph (175 km/h) (1-min) 962 mbar (hPa) |
Tropical Storm Gabrielle[]
| Tropical storm (SSHWS) | |
 | |
| Duration | October 19 – October 21 |
|---|---|
| Peak intensity | 40 mph (65 km/h) (1-min) 1000 mbar (hPa) |
Tropical Storm Hugo[]
| Tropical storm (SSHWS) | |
 | |
| Duration | October 31 – November 4 |
|---|---|
| Peak intensity | 65 mph (100 km/h) (1-min) 989 mbar (hPa) |
Timeline[]

Storm names[]
The following names will be used to name tropical and subtropical cyclones in the 1983 season.
|
|
|
Accumulated Cyclone Energy (ACE) Rating[]
| ACE (104 kt2) – Storm: Source | |||||
|---|---|---|---|---|---|
| 1 | 0.00 | Storm | 12 | 0.00 | Storm |
| 2 | 0.00 | Storm | 13 | 0.00 | Storm |
| 3 | 0.00 | Storm | 14 | 0.00 | Storm |
| 4 | 0.00 | Storm | 15 | 0.00 | Storm |
| 5 | 0.00 | Storm | 16 | 0.00 | Storm |
| 6 | 0.00 | Storm | 17 | 0.00 | Storm |
| 7 | 0.00 | Storm | 18 | 0.00 | Storm |
| 8 | 0.00 | Storm | 19 | 0.00 | Storm |
| 9 | 0.00 | Storm | 20 | 0.00 | Storm |
| 10 | 0.00 | Storm | 21 | 0.00 | Storm |
| 11 | 0.00 | Storm | 22 | 0.00 | Storm |
| Total=0.0 | |||||
ACE is the result of a storm's winds multiplied by how long it lasted for, so storms or subtropical storms (Originally not included up until 2012) that at lasted a long time , as well as particularly strong hurricanes , have higher ACE totals. Tropical Depressions are not included in season total.
Season effects[]
This is a table of the storms and their effects in the 1983 Atlantic hurricane season. This table includes the storm's names, duration, peak intensity, Areas affected (bold indicates made landfall in that region at least once), damages, and death totals. Deaths in parentheses are additional and indirect (an example of an indirect death would be a traffic accident), but are still storm-related. Damage and deaths include totals while the storm was extratropical, a wave or a low. All of the damage figures are in 2014 USD (the listed damage figure is in millions).
| Storm name |
Dates active | Storm category at peak intensity |
Max 1-min wind mph (km/h) |
Min. press. (mbar) |
Areas affected | Damage (USD) |
Deaths |
|---|---|---|---|---|---|---|---|
| Storm | June 0 – June 0 | Tropical depression | 0 (0) | 0 | None | 0 | 0 |