The 2093 Atlantic hurricane season was an active season.
Storms[]
Tropical Storm Azure[]
| Tropical storm (SSHWS) | |
 | |
| Duration | June 2 – June 6 |
|---|---|
| Peak intensity | 45 mph (75 km/h) (1-min) 998 mbar (hPa) |
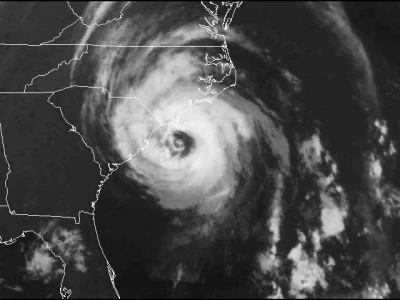
Hurricane Barry[]
| Category 4 hurricane (SSHWS) | |
 | |
| Duration | June 27 – July 10 |
|---|---|
| Peak intensity | 150 mph (240 km/h) (1-min) 930 mbar (hPa) |
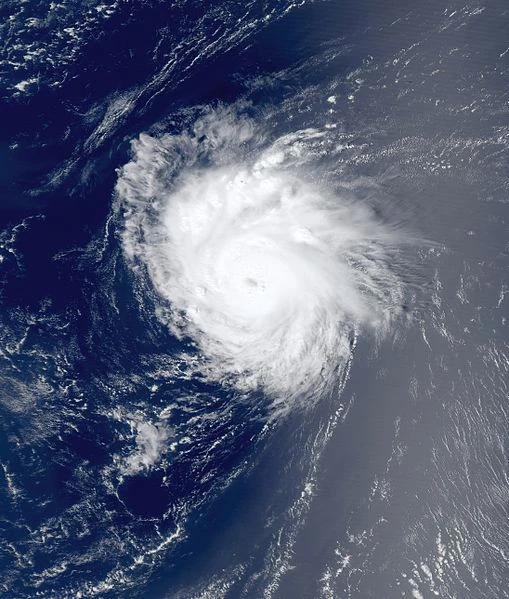
Hurricane Carrie[]
| Category 1 hurricane (SSHWS) | |
 | |
| Duration | June 30 – July 6 |
|---|---|
| Peak intensity | 85 mph (140 km/h) (1-min) 979 mbar (hPa) |
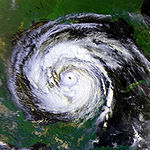
Hurricane Diego[]
| Category 5 hurricane (SSHWS) | |
 | |
| Duration | July 7 – July 21 |
|---|---|
| Peak intensity | 185 mph (295 km/h) (1-min) 889 mbar (hPa) |
Tropical Storm Elizabeth[]
| Tropical storm (SSHWS) | |
 | |
| Duration | July 9 – July 13 |
|---|---|
| Peak intensity | 40 mph (65 km/h) (1-min) 1000 mbar (hPa) |
Hurricane Francis[]
| Category 4 hurricane (SSHWS) | |
 | |
| Duration | July 12 – July 26 |
|---|---|
| Peak intensity | 155 mph (250 km/h) (1-min) 925 mbar (hPa) |
Hurricane Gert[]
| Category 1 hurricane (SSHWS) | |
 | |
| Duration | July 16 – July 22 |
|---|---|
| Peak intensity | 85 mph (140 km/h) (1-min) 979 mbar (hPa) |
Hurricane Harold[]
| Category 2 hurricane (SSHWS) | |
 | |
| Duration | July 18 – July 30 |
|---|---|
| Peak intensity | 100 mph (155 km/h) (1-min) 967 mbar (hPa) |
Hurricane Ilsa[]
| Category 4 hurricane (SSHWS) | |
 | |
| Duration | July 20 – August 1 |
|---|---|
| Peak intensity | 145 mph (230 km/h) (1-min) 929 mbar (hPa) |
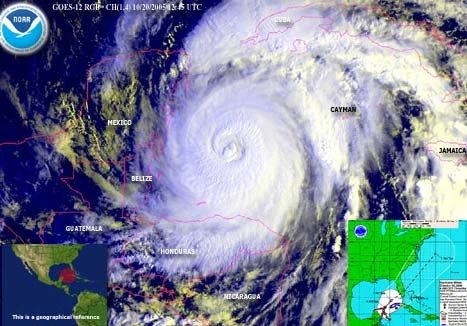
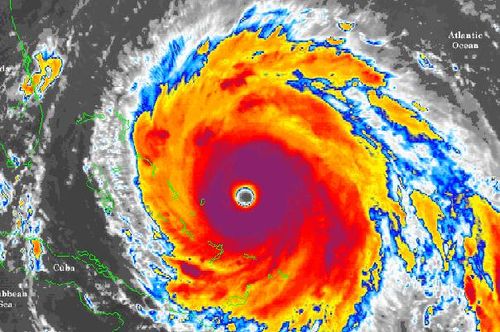
Hurricane Joey[]
| Category 6 hurricane | |
 | |
| Duration | July 24 – August 10 |
|---|---|
| Peak intensity | 200 mph (325 km/h) (1-min) 870 mbar (hPa) |
Hurricane Kassie[]
| Category 3 hurricane (SSHWS) | |
 | |
| Duration | July 27 – August 6 |
|---|---|
| Peak intensity | 115 mph (185 km/h) (1-min) 959 mbar (hPa) |
Tropical Storm Lee[]
| Tropical storm (SSHWS) | |
 | |
| Duration | July 31 – August 3 |
|---|---|
| Peak intensity | 45 mph (75 km/h) (1-min) 998 mbar (hPa) |
Hurricane Maggie[]
| Category 1 hurricane (SSHWS) | |
 | |
| Duration | August 5 – August 11 |
|---|---|
| Peak intensity | 80 mph (130 km/h) (1-min) 982 mbar (hPa) |
Hurricane Norman[]
| Category 4 hurricane (SSHWS) | |
 | |
| Duration | August 9 – August 22 |
|---|---|
| Peak intensity | 145 mph (230 km/h) (1-min) 926 mbar (hPa) |
Tropical Storm Olga[]
| Tropical storm (SSHWS) | |
 | |
| Duration | August 13 – August 16 |
|---|---|
| Peak intensity | 45 mph (75 km/h) (1-min) 998 mbar (hPa) |
Tropical Storm Phil[]
| Tropical storm (SSHWS) | |
 | |
| Duration | August 17 – August 21 |
|---|---|
| Peak intensity | 50 mph (85 km/h) (1-min) 996 mbar (hPa) |
Hurricane Rose[]
| Category 5 hurricane (SSHWS) | |
 | |
| Duration | August 20 – September 2 |
|---|---|
| Peak intensity | 160 mph (260 km/h) (1-min) 913 mbar (hPa) |
Tropical Storm Sergio[]
| Tropical storm (SSHWS) | |
 | |
| Duration | August 23 – August 25 |
|---|---|
| Peak intensity | 40 mph (65 km/h) (1-min) 1000 mbar (hPa) |
Timeline[]

Accumulated Cyclone Energy (ACE) Rating[]
| ACE (104 kt2) – Storm: Source | |||||
|---|---|---|---|---|---|
| 1 | 0.00 | Storm | 12 | 0.00 | Storm |
| 2 | 0.00 | Storm | 13 | 0.00 | Storm |
| 3 | 0.00 | Storm | 14 | 0.00 | Storm |
| 4 | 0.00 | Storm | 15 | 0.00 | Storm |
| 5 | 0.00 | Storm | 16 | 0.00 | Storm |
| 6 | 0.00 | Storm | 17 | 0.00 | Storm |
| 7 | 0.00 | Storm | 18 | 0.00 | Storm |
| 8 | 0.00 | Storm | 19 | 0.00 | Storm |
| 9 | 0.00 | Storm | 20 | 0.00 | Storm |
| 10 | 0.00 | Storm | 21 | 0.00 | Storm |
| 11 | 0.00 | Storm | 22 | 0.00 | Storm |
| Total=0.0 | |||||
ACE is the result of a storm's winds multiplied by how long it lasted for, so storms or subtropical storms (Originally not included up until 2012) that at lasted a long time , as well as particularly strong hurricanes , have higher ACE totals. Tropical Depressions are not included in season total.