The 2066 Atlantic hurricane season was an active season.
Storms
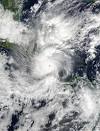
Tropical Storm Alexander
| Tropical storm (SSHWS) | |
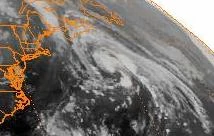 | |
| Duration | May 31 – June 5 |
|---|---|
| Peak intensity | 70 mph (110 km/h) (1-min) 988 mbar (hPa) |
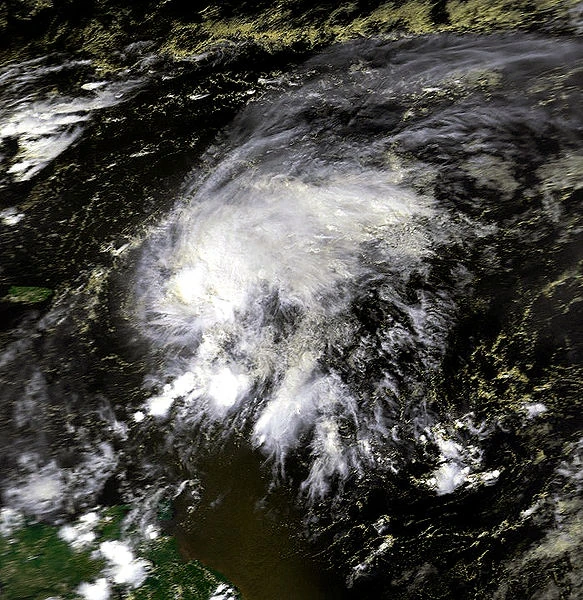
Tropical Storm Betsy
| Tropical storm (SSHWS) | |
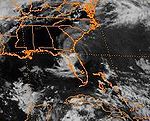 | |
| Duration | June 16 – June 19 |
|---|---|
| Peak intensity | 45 mph (75 km/h) (1-min) 999 mbar (hPa) |
Tropical Storm Carlos
| Tropical storm (SSHWS) | |
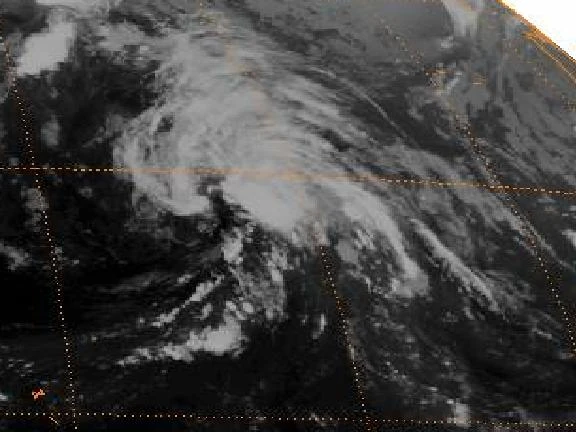 | |
| Duration | June 18 – June 23 |
|---|---|
| Peak intensity | 65 mph (100 km/h) (1-min) 989 mbar (hPa) |
Hurricane Deanna
| Category 3 hurricane (SSHWS) | |
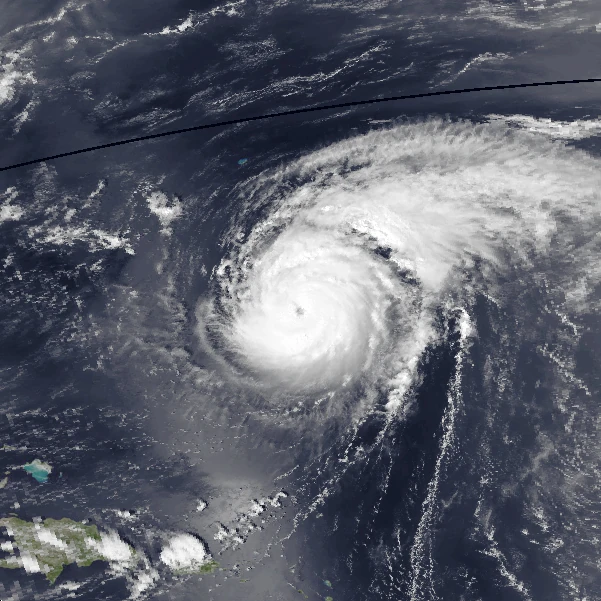 | |
| Duration | June 30 – July 10 |
|---|---|
| Peak intensity | 125 mph (205 km/h) (1-min) 947 mbar (hPa) |
Hurricane Edward
| Category 2 hurricane (SSHWS) | |
 | |
| Duration | July 4 – July 11 |
|---|---|
| Peak intensity | 105 mph (165 km/h) (1-min) 968 mbar (hPa) |
Tropical Storm Francine
| Tropical storm (SSHWS) | |
 | |
| Duration | July 13 – July 19 |
|---|---|
| Peak intensity | 70 mph (110 km/h) (1-min) 988 mbar (hPa) |
Hurricane Guillermo
| Category 3 hurricane (SSHWS) | |
 | |
| Duration | July 15 – July 22 |
|---|---|
| Peak intensity | 125 mph (205 km/h) (1-min) 948 mbar (hPa) |
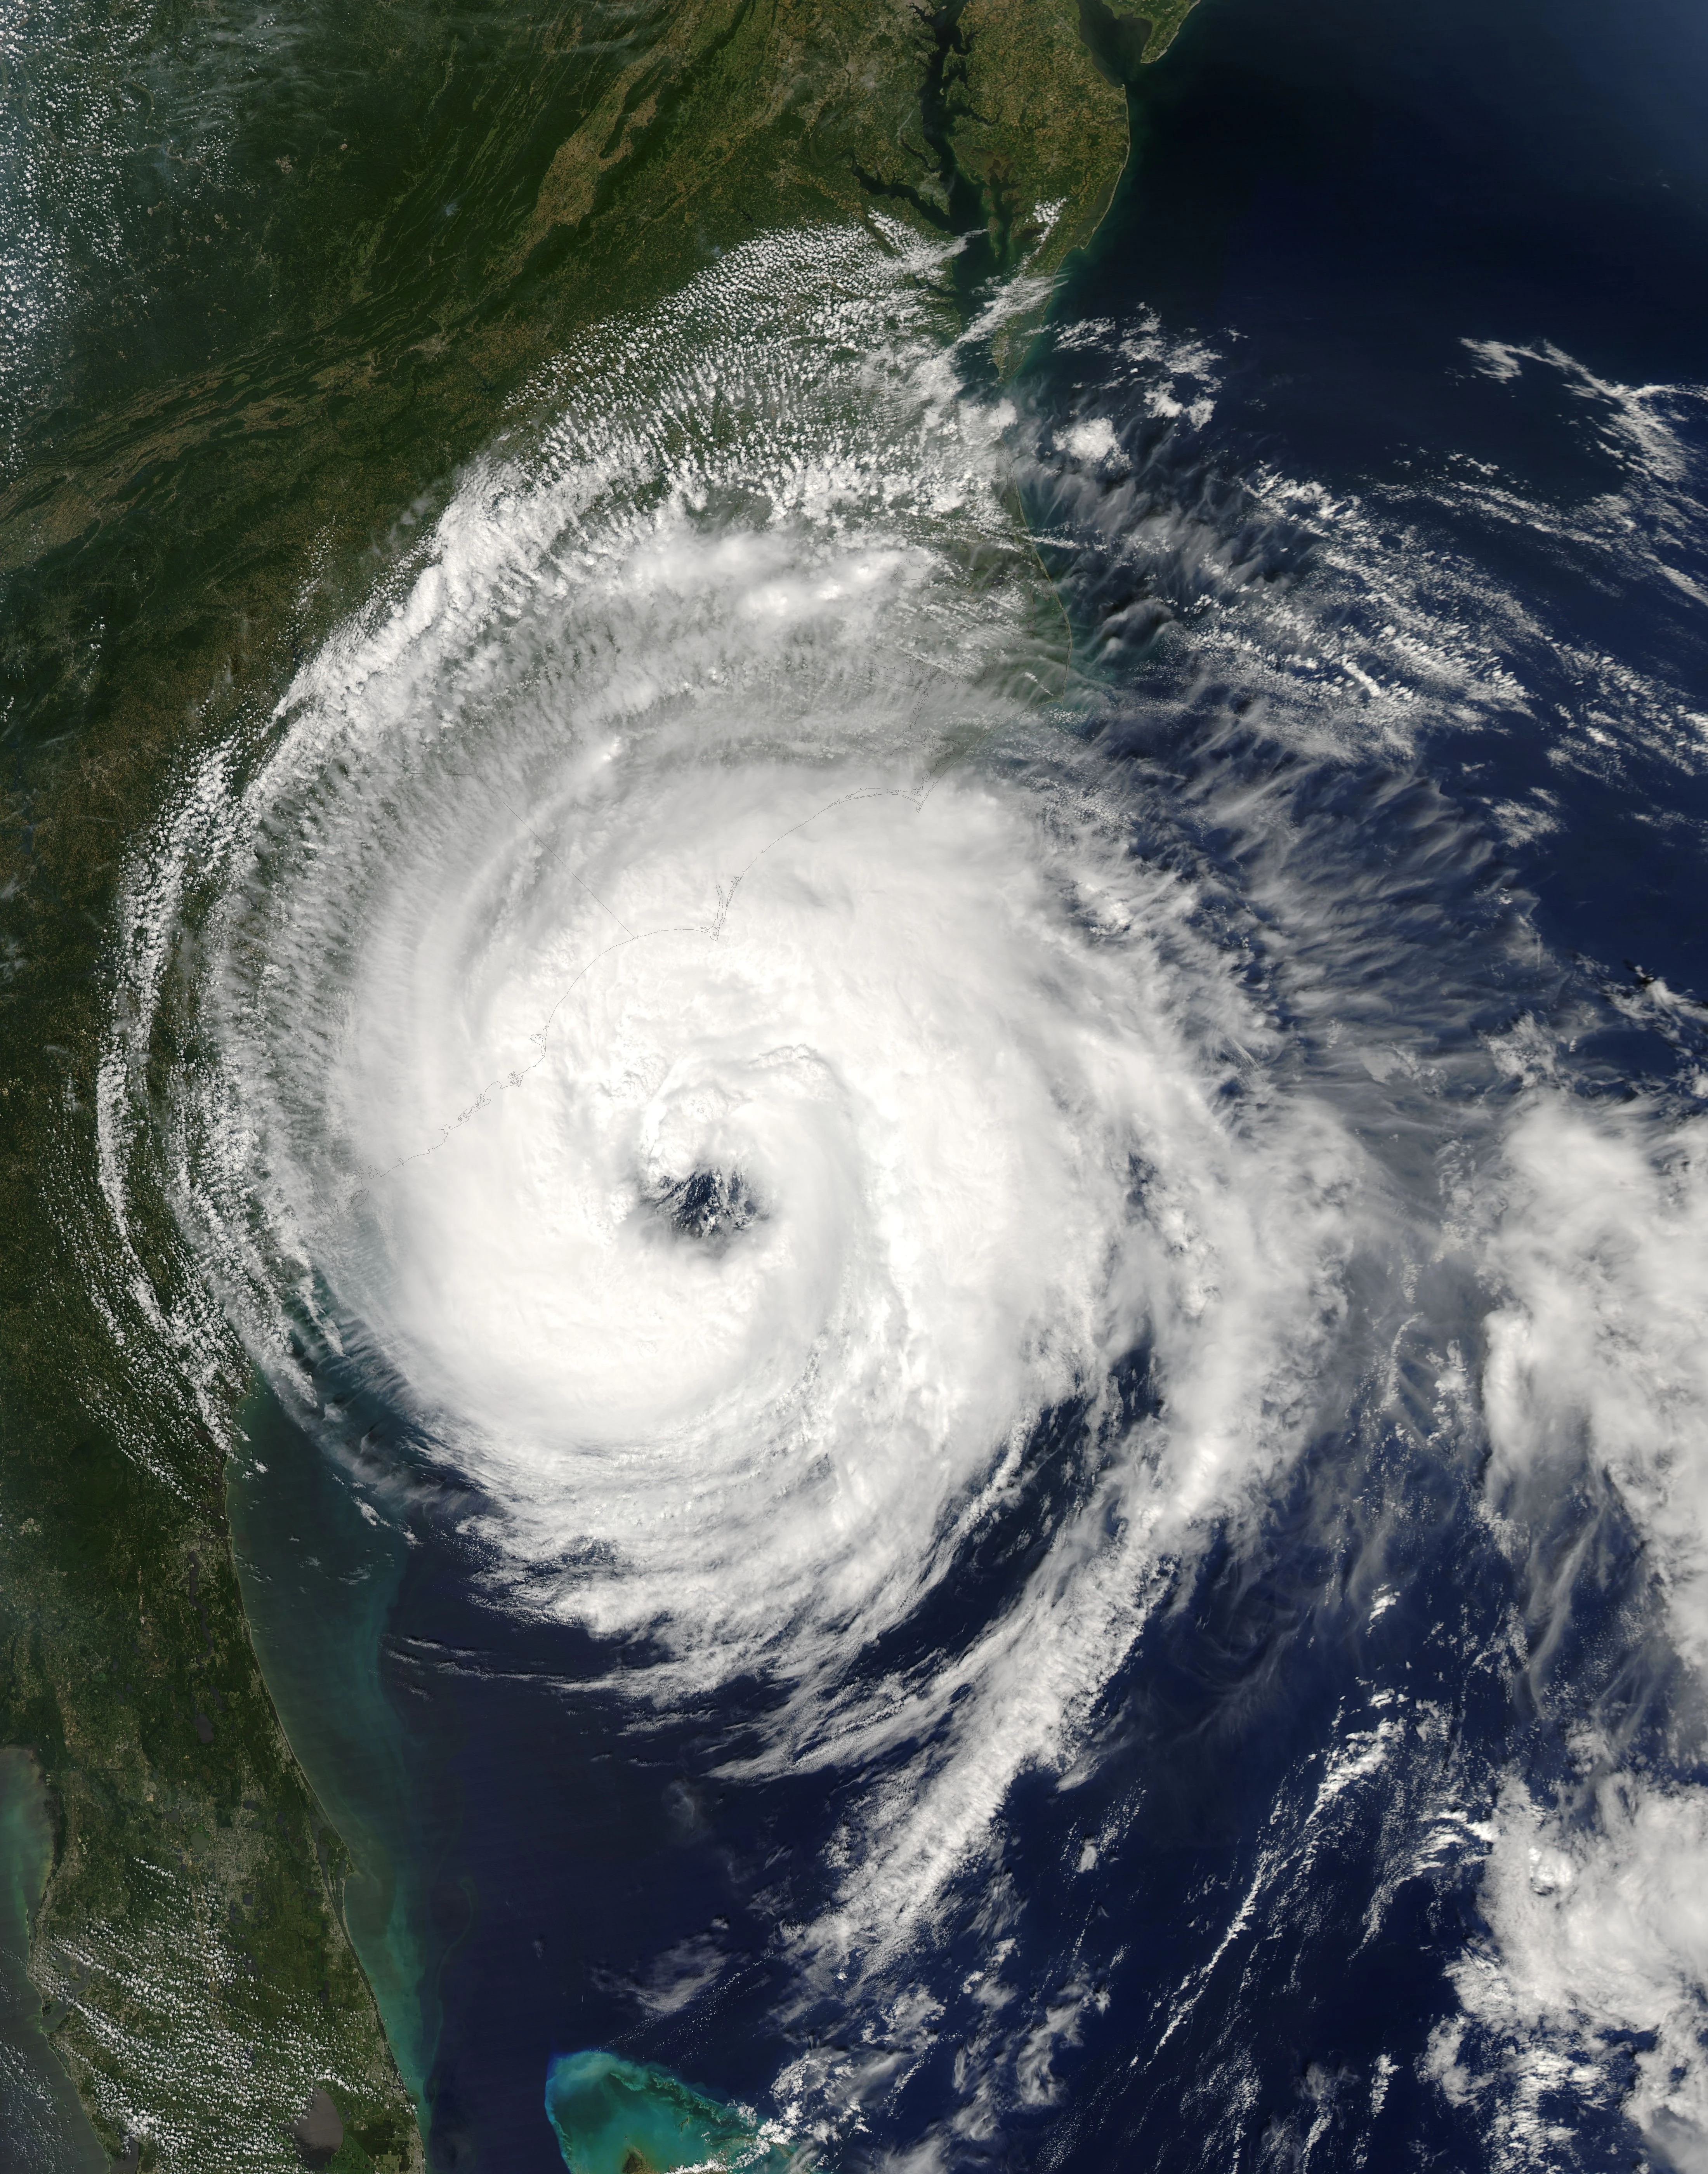
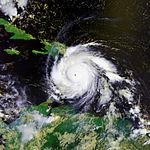
Hurricane Helena
| Category 4 hurricane (SSHWS) | |
 | |
| Duration | July 20 – August 2 |
|---|---|
| Peak intensity | 145 mph (230 km/h) (1-min) 931 mbar (hPa) |
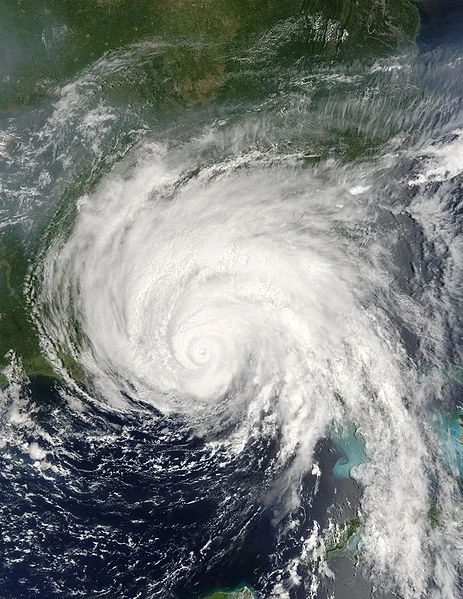
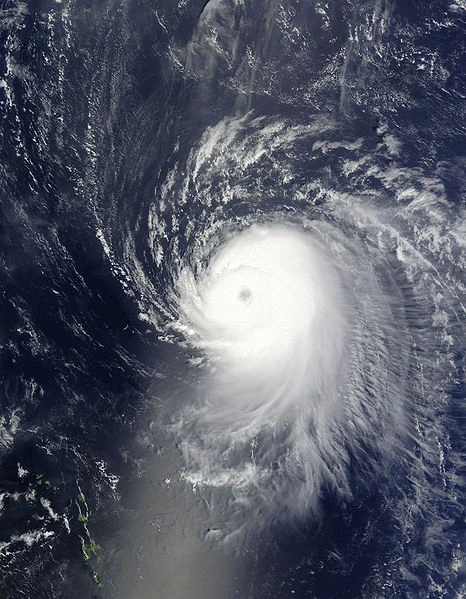
Hurricane Irving
| Category 5 hurricane (SSHWS) | |
 | |
| Duration | July 24 – August 7 |
|---|---|
| Peak intensity | 180 mph (285 km/h) (1-min) 900 mbar (hPa) |
Tropical Storm Julie
| Tropical storm (SSHWS) | |
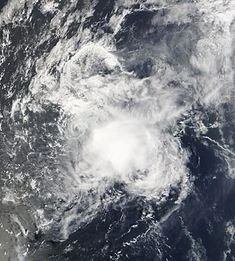 | |
| Duration | July 31 – August 4 |
|---|---|
| Peak intensity | 60 mph (95 km/h) (1-min) 991 mbar (hPa) |
Hurricane Kirk
| Category 1 hurricane (SSHWS) | |
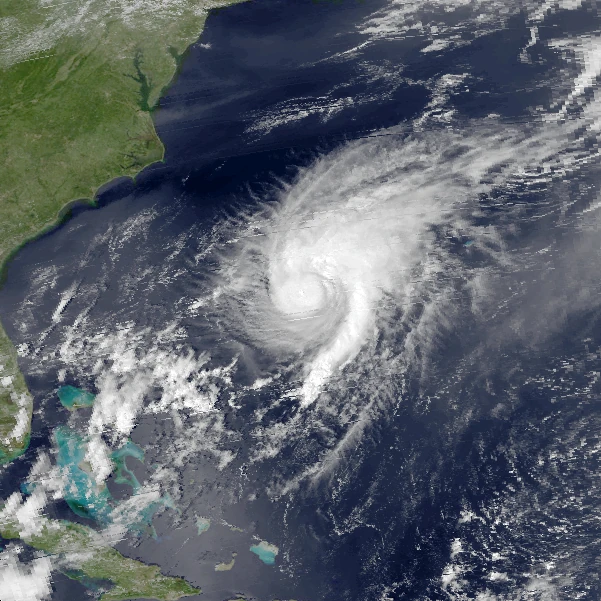 | |
| Duration | August 3 – August 10 |
|---|---|
| Peak intensity | 90 mph (150 km/h) (1-min) 974 mbar (hPa) |
Tropical Storm Lana
| Tropical storm (SSHWS) | |
 | |
| Duration | August 9 – August 12 |
|---|---|
| Peak intensity | 45 mph (75 km/h) (1-min) 1000 mbar (hPa) |
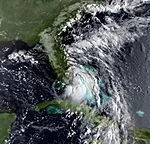
Hurricane Melvin
| Category 4 hurricane (SSHWS) | |
 | |
| Duration | August 15 – August 31 |
|---|---|
| Peak intensity | 155 mph (250 km/h) (1-min) 923 mbar (hPa) |
Hurricane Nikita
| Category 5 hurricane (SSHWS) | |
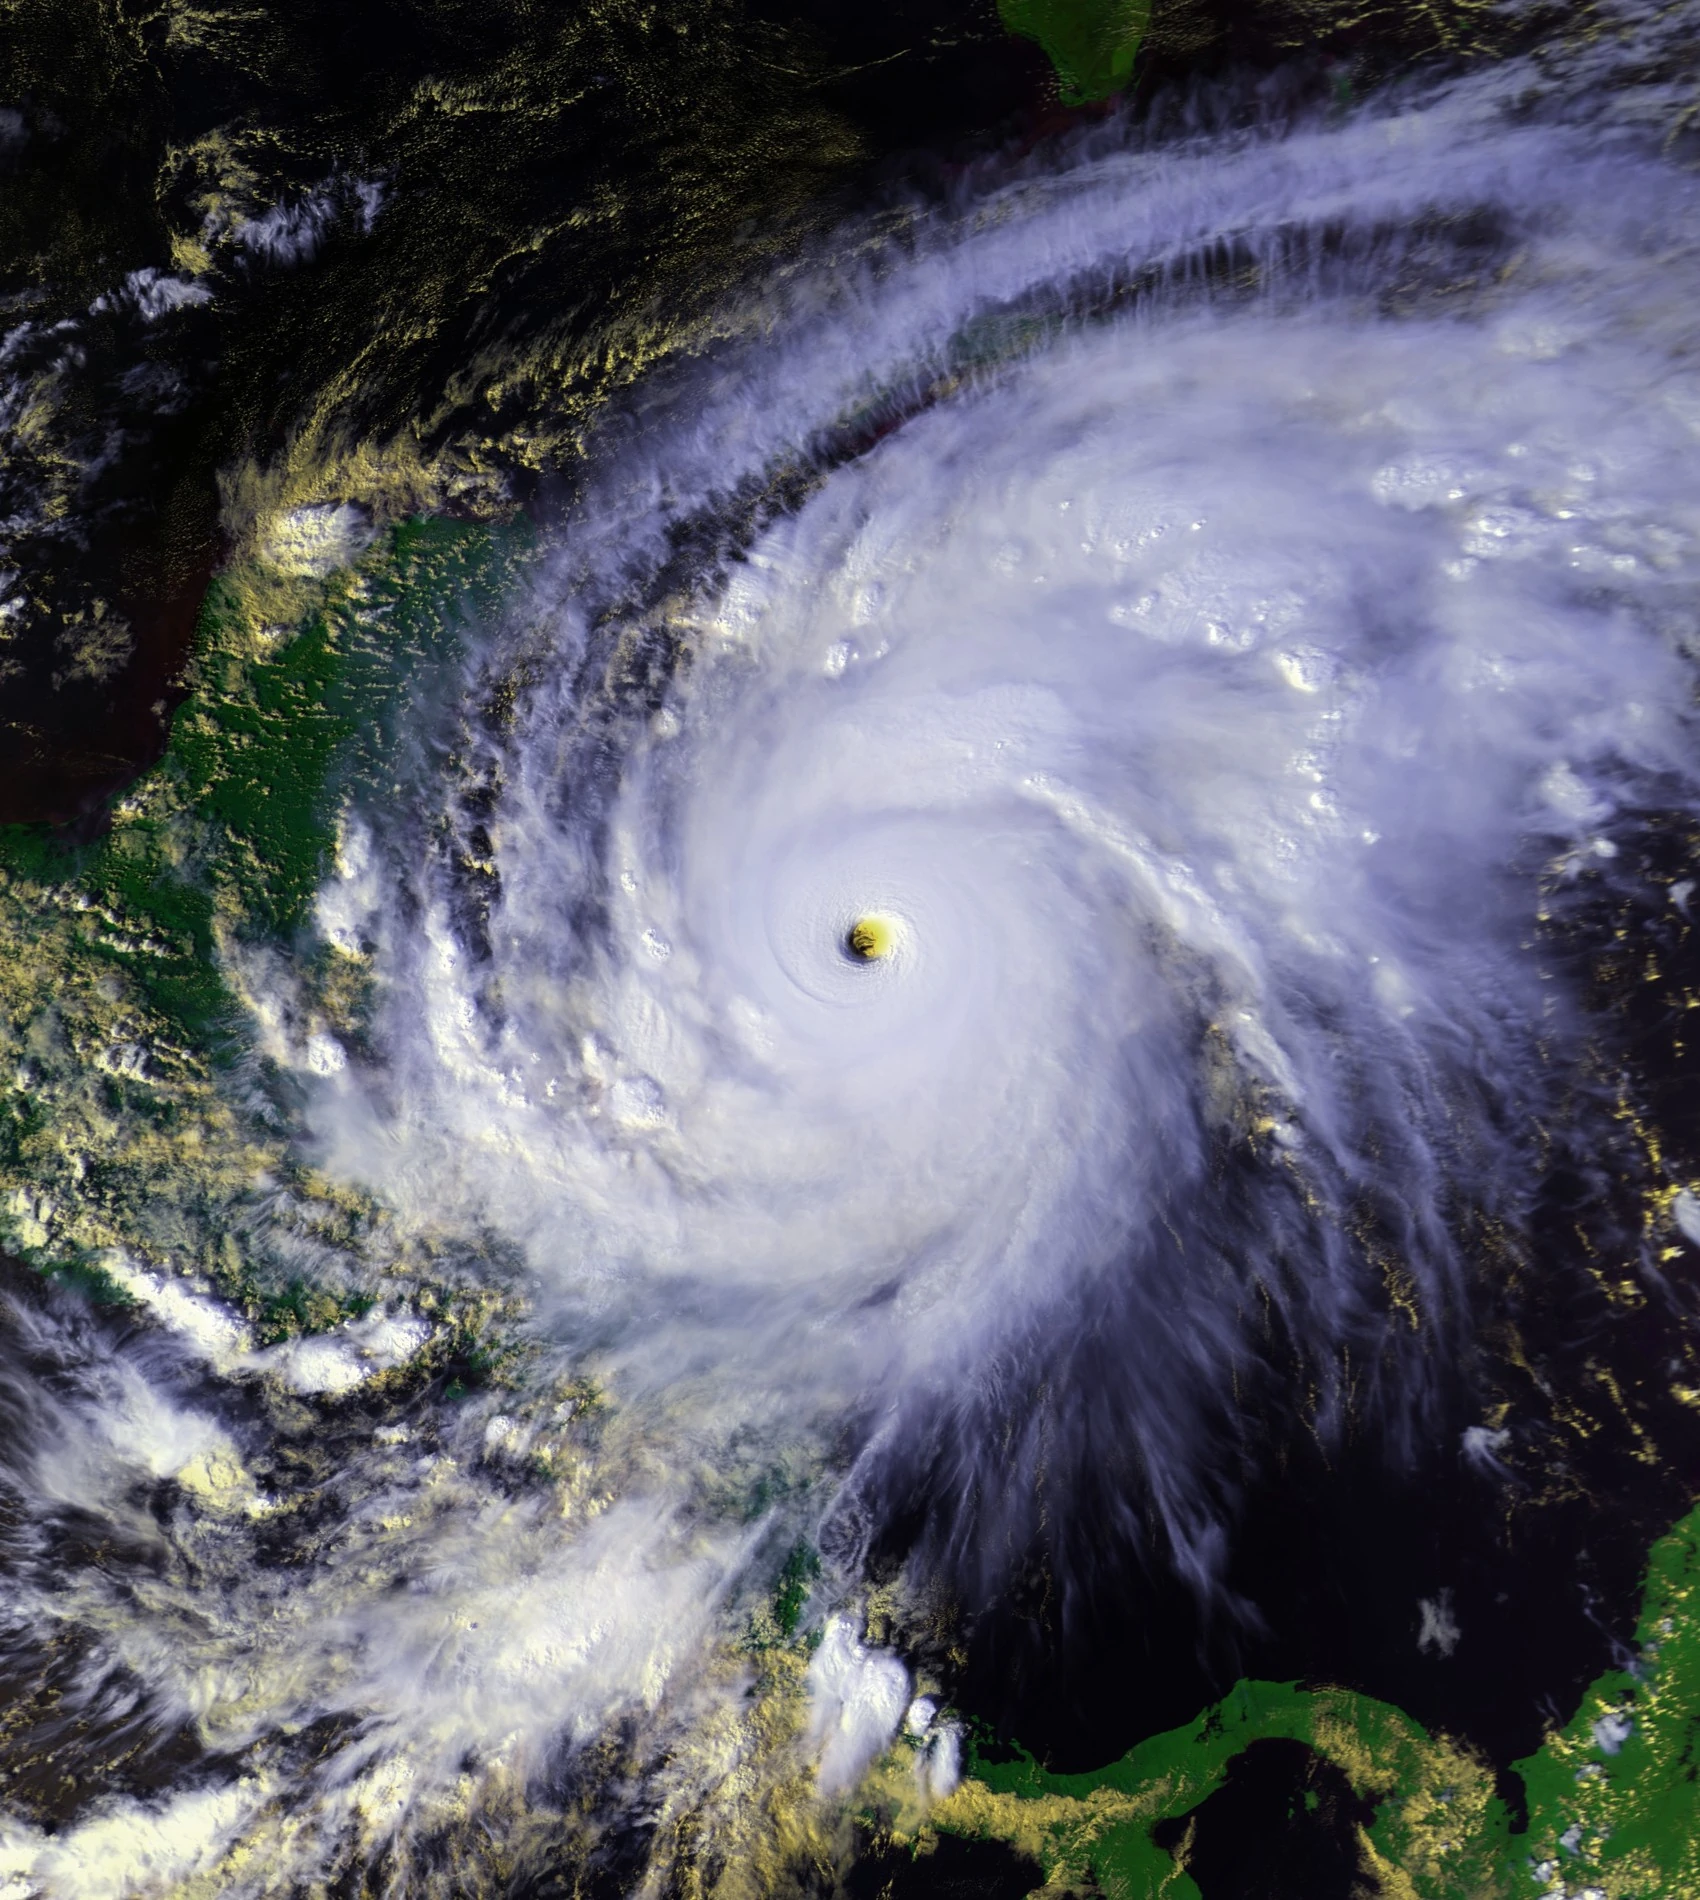 | |
| Duration | August 21 – September 9 |
|---|---|
| Peak intensity | 190 mph (305 km/h) (1-min) 885 mbar (hPa) |
Timeline

Accumulated Cyclone Energy (ACE) Rating
| ACE (104 kt2) – Storm: Source | |||||
|---|---|---|---|---|---|
| 1 | 43.18 | Nikita | 12 | 1.13 | Julie |
| 2 | 22.17 | Irving | 13 | 0.792 | Betsy |
| 3 | 19.45 | Melvin | 14 | 0.685 | Lana |
| 4 | 15.48 | Helena | 15 | 0.00 | Storm |
| 5 | 10.55 | Deanna | 16 | 0.00 | Storm |
| 6 | 9.43 | Guillermo | 17 | 0.00 | Storm |
| 7 | 7.19 | Edward | 18 | 0.00 | Storm |
| 8 | 4.01 | Kirk | 19 | 0.00 | Storm |
| 9 | 3.07 | Alexander | 20 | 0.00 | Storm |
| 10 | 2.77 | Francine | 21 | 0.00 | Storm |
| 11 | 1.45 | Carlos | |||
| Total=141.459 (141) | |||||
ACE is the result of a storm's winds multiplied by how long it lasted for, so storms that lasted a long time , as well as particularly strong hurricanes , have higher ACE totals. 2066 was active in these terms; with an ACE total of 235. Tropical Depressions and Subtropical storms are not included in season totals.
Season effects
This is a table of the storms and their effects in the 2066 Atlantic hurricane season. This table includes the storm's names, duration, peak intensity, Areas affected (bold indicates made landfall in that region at least once), damages, and death totals. Deaths in parentheses are additional and indirect (an example of an indirect death would be a traffic accident), but are still storm-related. Damage and deaths include totals while the storm was extratropical, a wave or a low. All of the damage figures are in 2066 USD (the listed damage figure is in millions).
| Storm name |
Dates active | Storm category at peak intensity |
Max 1-min wind mph (km/h) |
Min. press. (mbar) |
Areas affected | Damage (USD) |
Deaths |
|---|---|---|---|---|---|---|---|
| Alexander | May 31 – June 5 | Tropical storm | 70 (110) | 988 | Bermuda, Nova Scotia | 15 | 5 |
| Betsy | June 16 – June 19 | Tropical storm | 45 (75) | 1000 | Northern Florida, Southern Georgia | 21 | 9 |
| Carlos | June 18 – June 23 | Tropical storm | 65 (100) | 989 | None | 0 | 0 |
| Deanna | June 30 – July 10 | Category 3 hurricane | 125 (205) | 947 | None | 0 | 0 |
| Edward | July 4 – July 11 | Category 2 hurricane | 105 (165) | 968 | Bermuda | 15 | 8 |
| Francine | July 13 – July 19 | Tropical storm | 70 (110) | 988 | Puerto Rico, Haiti, Bahamas, Northern Florida | 65 | 11 |
| Guillermo | July 15 – July 22 | Category 3 hurricane | 125 (205) | 948 | Puerto Rico, Haiti, Bahamas, Northern Florida, Georgia, the Carolinas, New York, Nova Scotia | 1,400 | 105 |
| Helena | July 20 – August 2 | Category 4 hurricane | 145 (230) | 931 | Puerto Rico, Haiti, Bahamas, Cuba, Western Florida, Alabama, Mississippi, Western Louisiana, Nova Scotia | 18,500 | 1,175 |
| Irving | July 24 – August 7 | Category 5 hurricane | 180 (285) | 900 | Cape Verde Islands, Lesser Antilles, Puerto Rico, Dominican Republic, Jamaica, Cuba, Mexico, Louisiana | 25,400 | 1,615 |
| Julie | July 31 – August 4 | Tropical storm | 60 (95) | 991 | Cape Verde Islands | Minor | 0 |
| Kirk | August 3 – August 10 | Category 1 hurricane | 90 (150) | 974 | Bahamas, Bermuda | 10 | 5 |
| Lana | August 9 – August 12 | Tropical storm | 45 (75) | 1000 | Bahamas, Florida | 10 | 4 |
| Melvin | August 15 – August 31 | Category 4 hurricane | 155 (250) | 923 | Azores, Bermuda | 60 | 15 |
| Nikita | August 21 – September 8 | Category 5 hurricane | 190 (305) | 885 | Cape Verde Islands, lesser Antilles, Puerto Rico, Dominican Republic, Jamaica, Cuba, Mexico, Alabama, Florida, the Carolinas, New York, Nova Scotia | 52,000 | 10,125 |