The 2024 Pacific hurricane season was an active season.
Storms[]
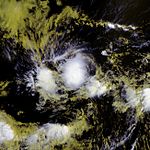
Hurricane Aletta[]
| Category 4 hurricane (SSHWS) | |
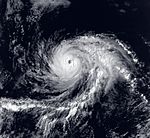 | |
| Duration | May 17 – May 24 |
|---|---|
| Peak intensity | 135 mph (215 km/h) (1-min) 950 mbar (hPa) |
Tropical Storm Bud[]
| Tropical storm (SSHWS) | |
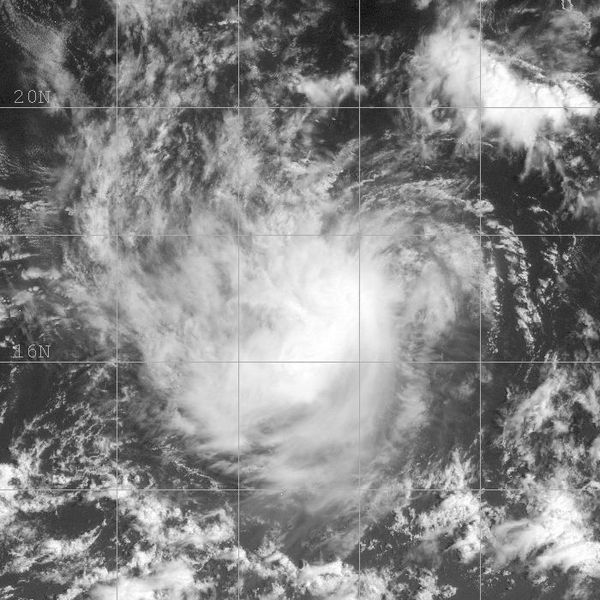 | |
| Duration | May 22 – May 27 |
|---|---|
| Peak intensity | 65 mph (100 km/h) (1-min) 990 mbar (hPa) |
Hurricane Carlotta[]
| Category 3 hurricane (SSHWS) | |
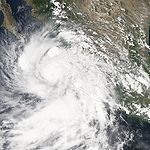 | |
| Duration | May 31 – June 7 |
|---|---|
| Peak intensity | 125 mph (205 km/h) (1-min) 948 mbar (hPa) |
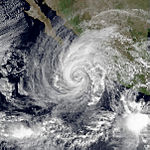
Hurricane Daniel[]
| Category 5 hurricane (SSHWS) | |
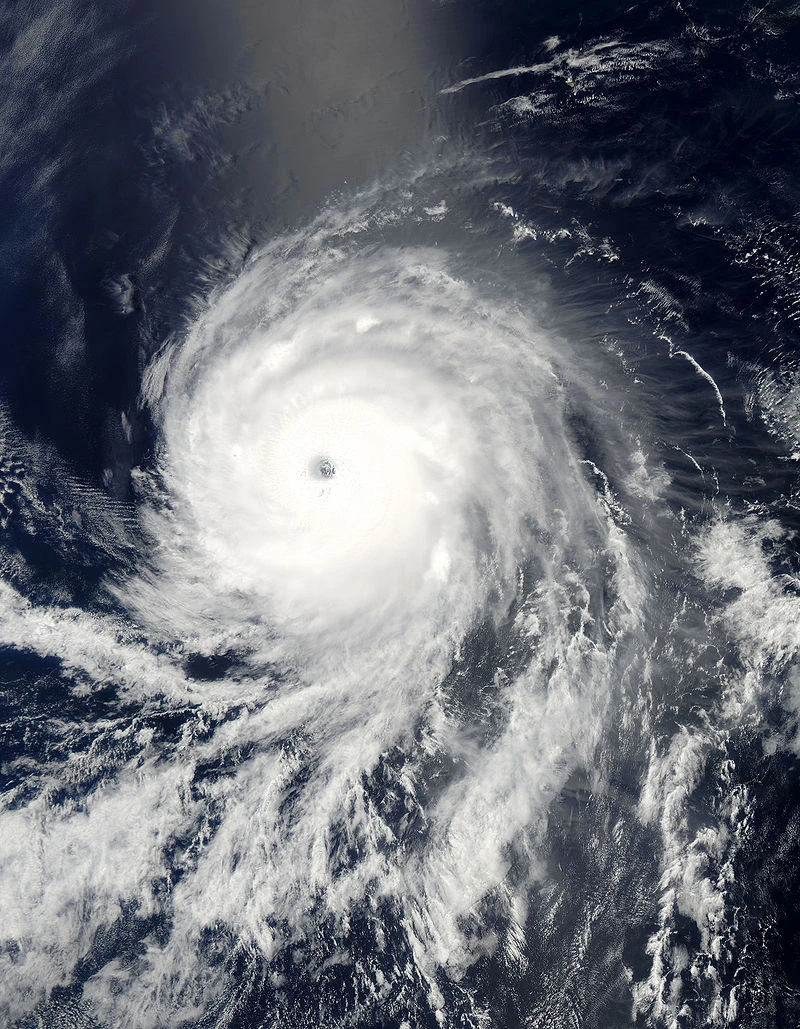 | |
| Duration | June 15 – June 30 |
|---|---|
| Peak intensity | 160 mph (260 km/h) (1-min) 924 mbar (hPa) |
Tropical Depression Five-E[]
| Tropical depression (SSHWS) | |
 | |
| Duration | June 19 – June 21 |
|---|---|
| Peak intensity | 35 mph (55 km/h) (1-min) 1002 mbar (hPa) |
Tropical Storm Emilia[]
| Tropical storm (SSHWS) | |
 | |
| Duration | June 29 – July 3 |
|---|---|
| Peak intensity | 45 mph (75 km/h) (1-min) 1000 mbar (hPa) |
Hurricane Fabio[]
| Category 2 hurricane (SSHWS) | |
 | |
| Duration | July 4 – July 12 |
|---|---|
| Peak intensity | 105 mph (165 km/h) (1-min) 963 mbar (hPa) |
Timeline[]

Accumulated Cyclone Energy (ACE) Rating[]
| ACE (104 kt2) – Storm: Source | |||||
|---|---|---|---|---|---|
| 1 | 0.00 | Storm | 12 | 0.00 | Storm |
| 2 | 0.00 | Storm | 13 | 0.00 | Storm |
| 3 | 0.00 | Storm | 14 | 0.00 | Storm |
| 4 | 0.00 | Storm | 15 | 0.00 | Storm |
| 5 | 0.00 | Storm | 16 | 0.00 | Storm |
| 6 | 0.00 | Storm | 17 | 0.00 | Storm |
| 7 | 0.00 | Storm | 18 | 0.00 | Storm |
| 8 | 0.00 | Storm | 19 | 0.00 | Storm |
| 9 | 0.00 | Storm | 20 | 0.00 | Storm |
| 10 | 0.00 | Storm | 21 | 0.00 | Storm |
| 11 | 0.00 | Storm | 22 | 0.00 | Storm |
| Total=0.0 | |||||
ACE is the result of a storm's winds multiplied by how long it lasted for, so storms or subtropical storms (Originally not included up until 2012) that at lasted a long time , as well as particularly strong hurricanes , have higher ACE totals. Tropical Depressions are not included in season total.