The 2016 Atlantic hurricane season was an active season due to a weak La-Nina.
This season was the second most active Atlantic season on record, behind 2005.
Seasonal forecasts[]
| Source | Date | Named
storms |
Hurricanes | Major
hurricanes | |
| TSR | December 25, 2015 | 18 | 10 | 5 | |
| WSI | January 1, 2016 | 21 | 10 | 5 | |
| CSU | March 17, 2016 | 21 | 12 | 6 | |
| TSR | April 19, 2016 | 20 | 11 | 6 | |
| TWC | April 30, 2016 | 19 | 10 | 4 | |
| UKMO | May 18, 2016 | 23 | 13 | 5 | |
| NOAA | May 25, 2016 | 17-24 | 8-14 | 3-8 | |
| FSU COAPS | June 2, 2016 | 21 | 13 | 6 | |
| CSU | June 17, 2016 | 22 | 14 | 6 | |
| TSR | July 4, 2016 | 25 | 13 | 7 | |
| NOAA | August 6, 2016 | 23-30 | 9-16 | 4-10 | |
| WSI | August 21, 2016 | 24 | 14 | 7 | |
| TSR | September 14, 2016 | 29 | 16 | 9 | |
| ––––––––––––––––––––––––––––––––––––––––––––––––––––––– | |||||
| Actual activity | 22 | 14 | 7 | ||
Storms[]
Hurricane Alex[]
| Category 1 hurricane (SSHWS) | |
 | |
| Duration | June 13 – June 20 |
|---|---|
| Peak intensity | 90 mph (150 km/h) (1-min) 974 mbar (hPa) |
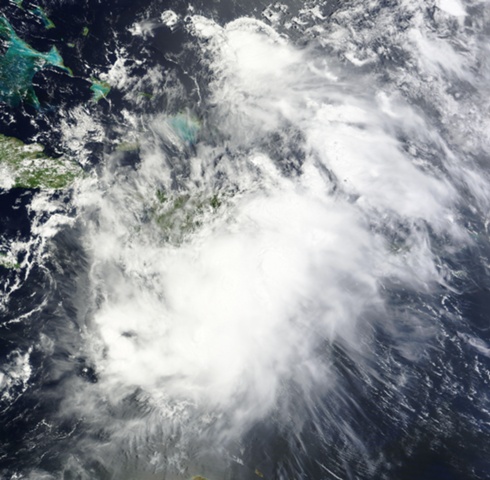
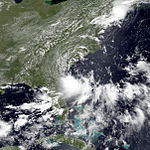
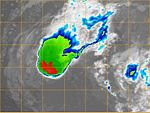
Tropical Storm Bonnie[]
| Tropical storm (SSHWS) | |
 | |
| Duration | June 29 – July 3 |
|---|---|
| Peak intensity | 50 mph (85 km/h) (1-min) 1000 mbar (hPa) |
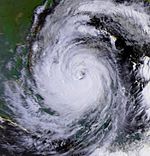
Hurricane Colin[]
| Category 1 hurricane (SSHWS) | |
 | |
| Duration | July 10 – July 16 |
|---|---|
| Peak intensity | 75 mph (120 km/h) (1-min) 987 mbar (hPa) |
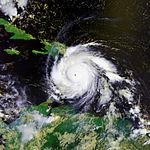
Hurricane Danielle[]
| Category 3 hurricane (SSHWS) | |
 | |
| Duration | July 14 – July 23 |
|---|---|
| Peak intensity | 125 mph (205 km/h) (1-min) 946 mbar (hPa) |
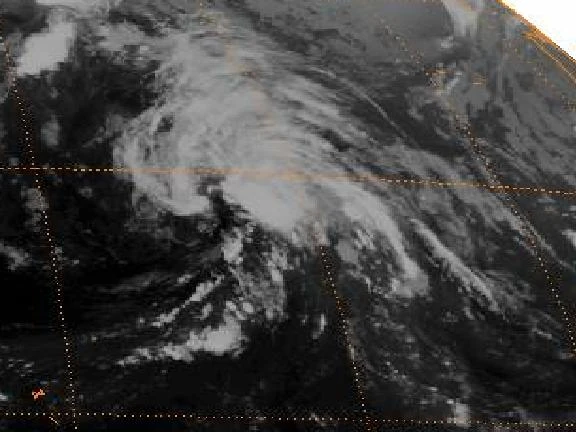
Tropical Storm Earl[]
| Tropical storm (SSHWS) | |
 | |
| Duration | July 21 – June 25 |
|---|---|
| Peak intensity | 65 mph (100 km/h) (1-min) 989 mbar (hPa) |
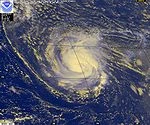
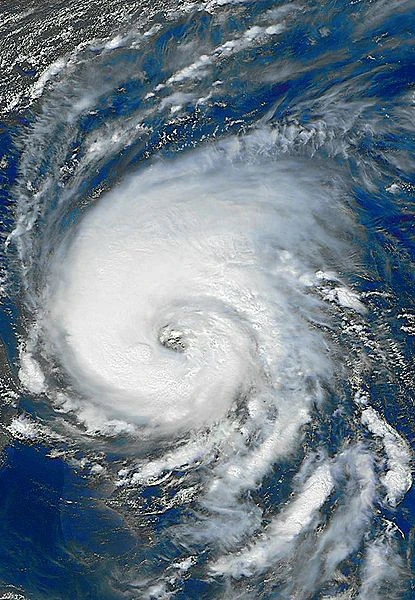
Hurricane Fiona[]
| Category 1 hurricane (SSHWS) | |
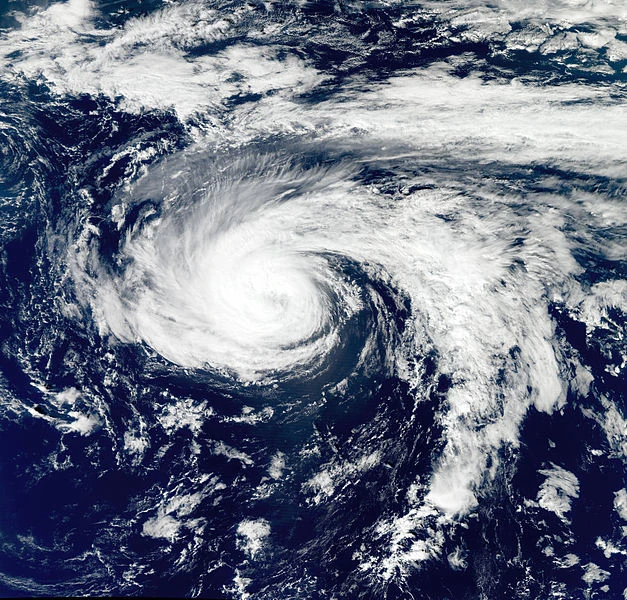 | |
| Duration | July 31 – August 6 |
|---|---|
| Peak intensity | 85 mph (140 km/h) (1-min) 979 mbar (hPa) |
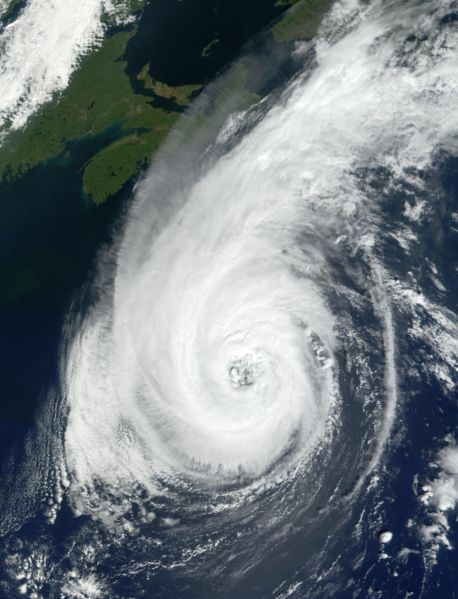
Hurricane Gaston[]
| Category 4 hurricane (SSHWS) | |
 | |
| Duration | August 5 – August 17 |
|---|---|
| Peak intensity | 145 mph (230 km/h) (1-min) 936 mbar (hPa) |
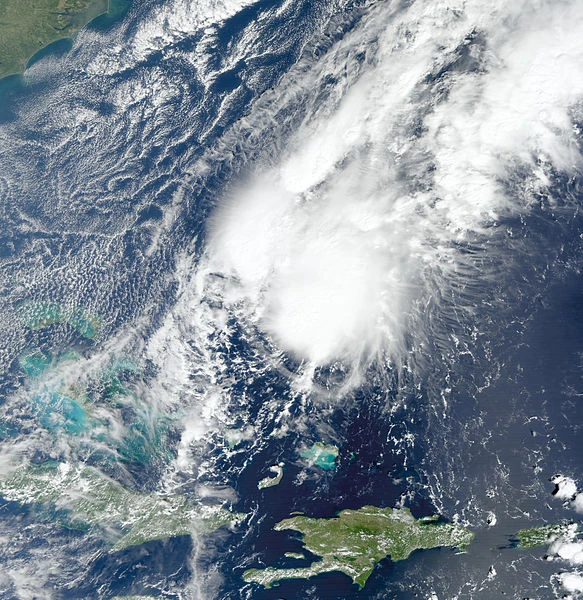
Hurricane Hermine[]
| Category 1 hurricane (SSHWS) | |
 | |
| Duration | August 9 – August 15 |
|---|---|
| Peak intensity | 85 mph (140 km/h) (1-min) 980 mbar (hPa) |
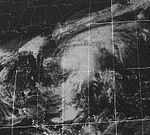
Tropical Storm Ian[]
| Tropical storm (SSHWS) | |
 | |
| Duration | August 12 – August 17 |
|---|---|
| Peak intensity | 65 mph (100 km/h) (1-min) 993 mbar (hPa) |
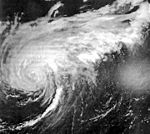
Tropical Storm Julia[]
| Tropical storm (SSHWS) | |
 | |
| Duration | August 16 – August 21 |
|---|---|
| Peak intensity | 60 mph (95 km/h) (1-min) 994 mbar (hPa) |
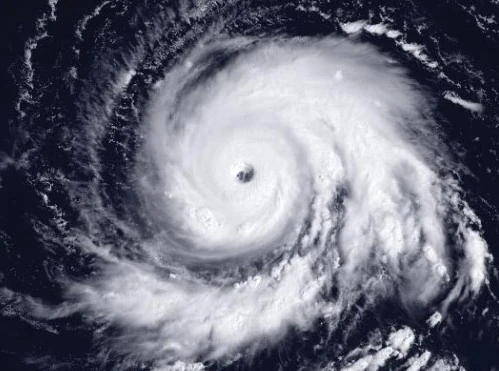
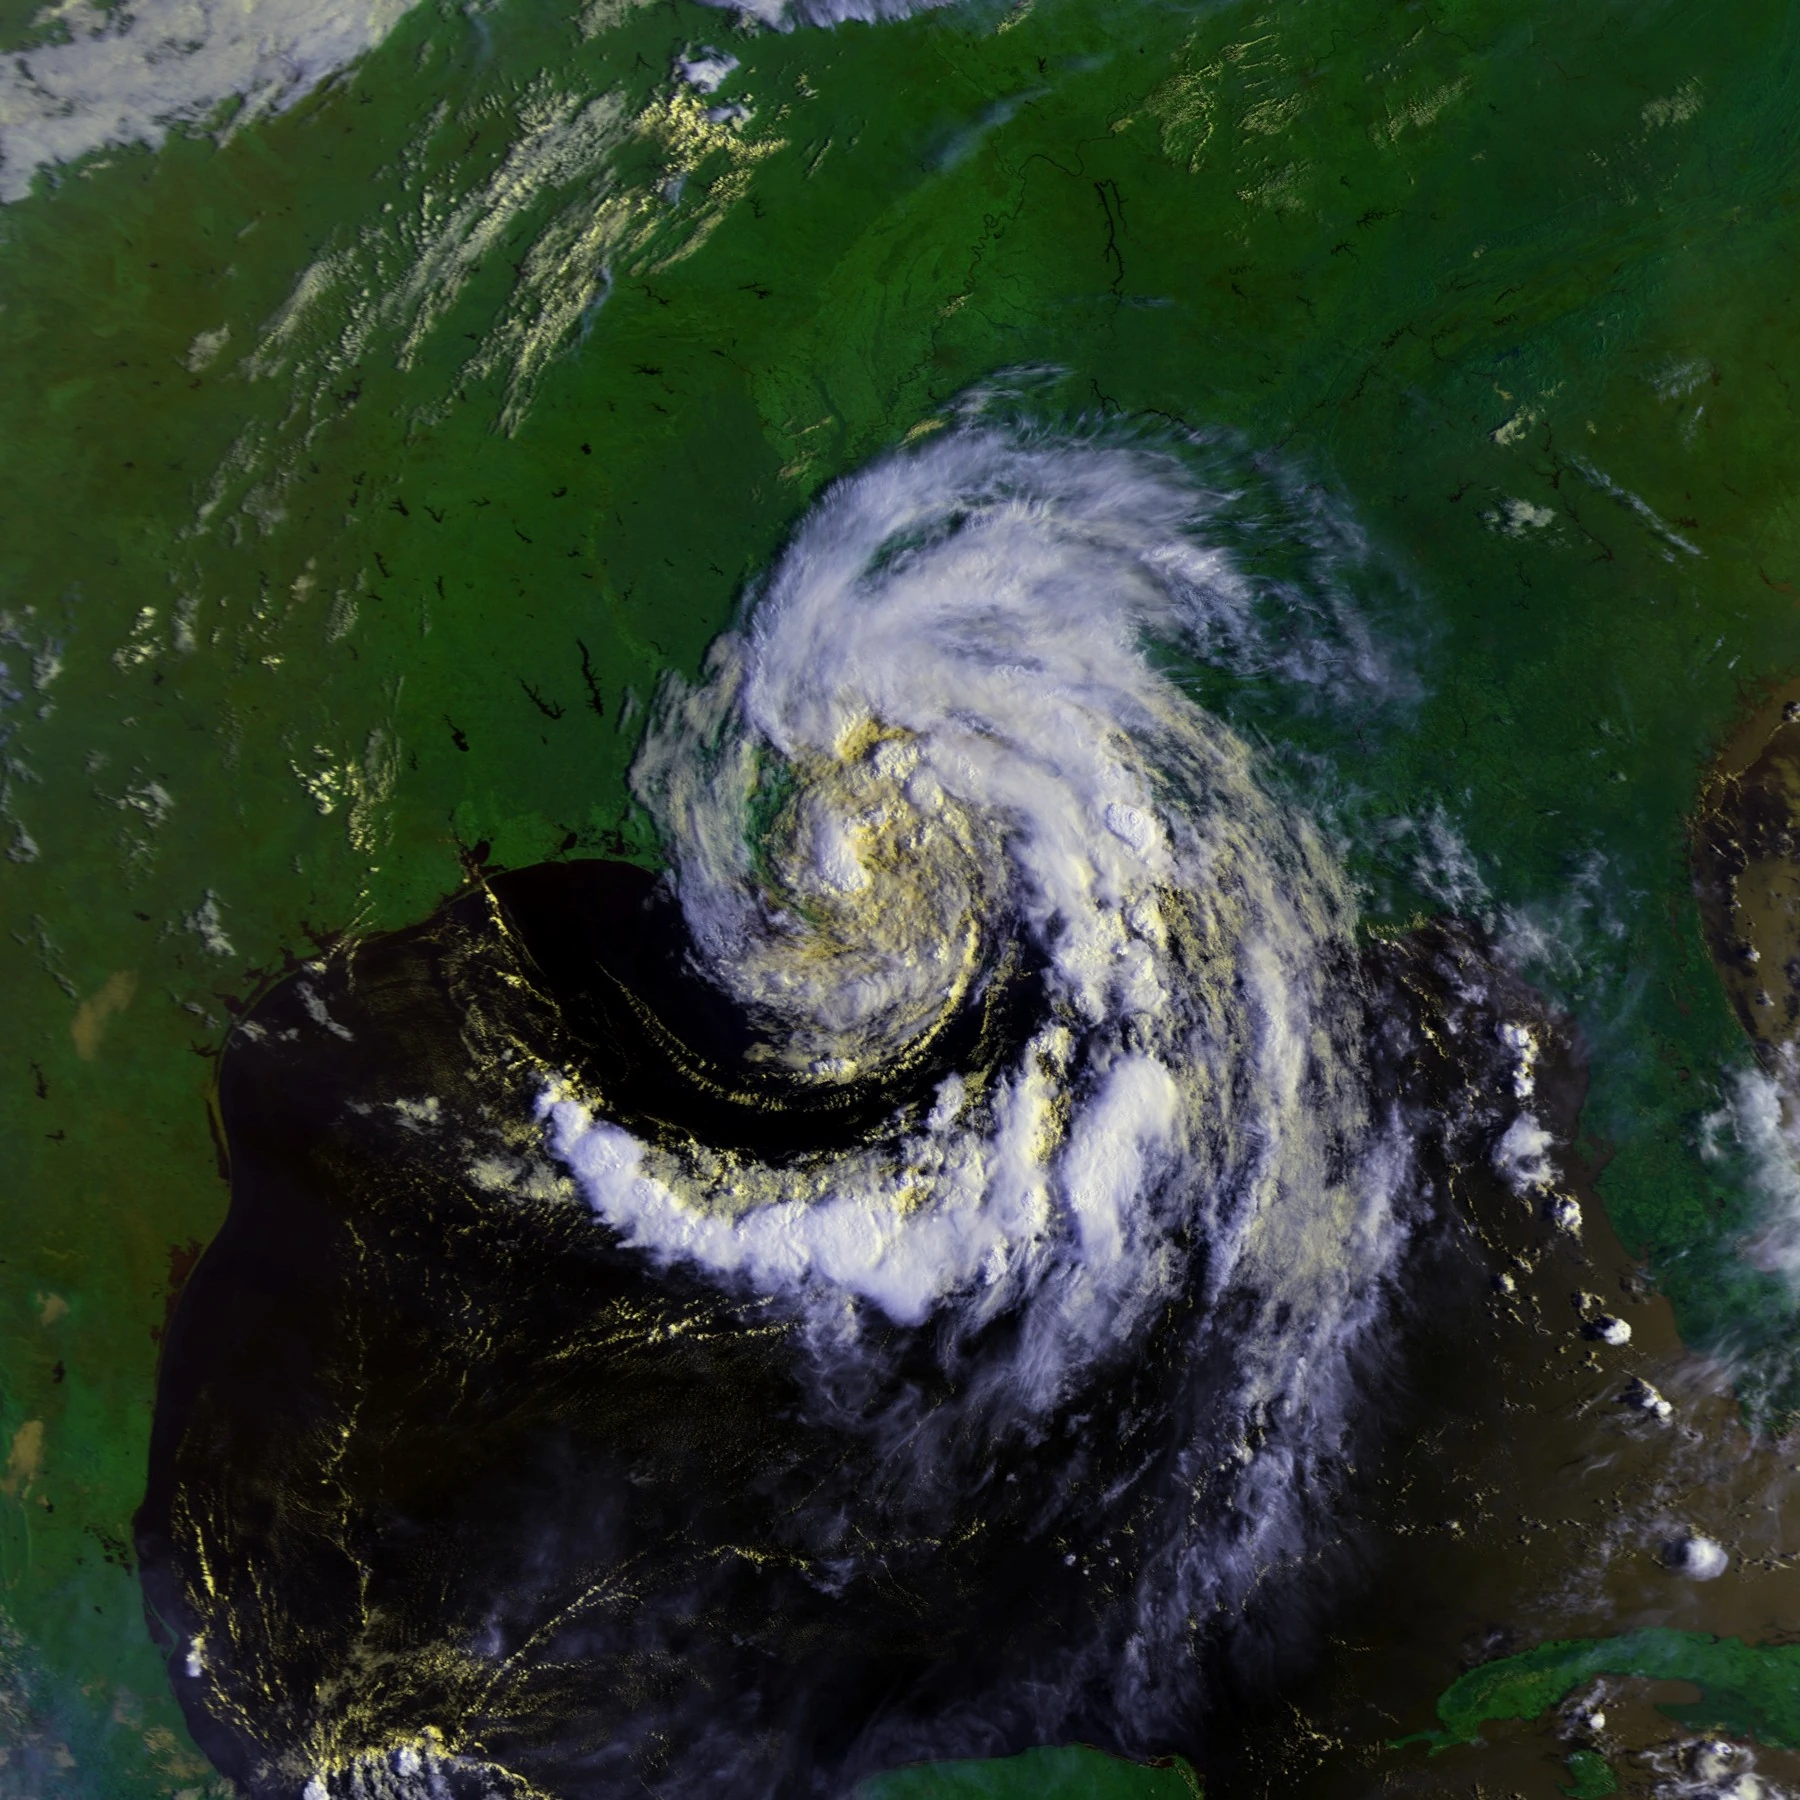
Hurricane Karl[]
| Category 5 hurricane (SSHWS) | |
 | |
| Duration | August 20 – September 2 |
|---|---|
| Peak intensity | 190 mph (305 km/h) (1-min) 879 mbar (hPa) |
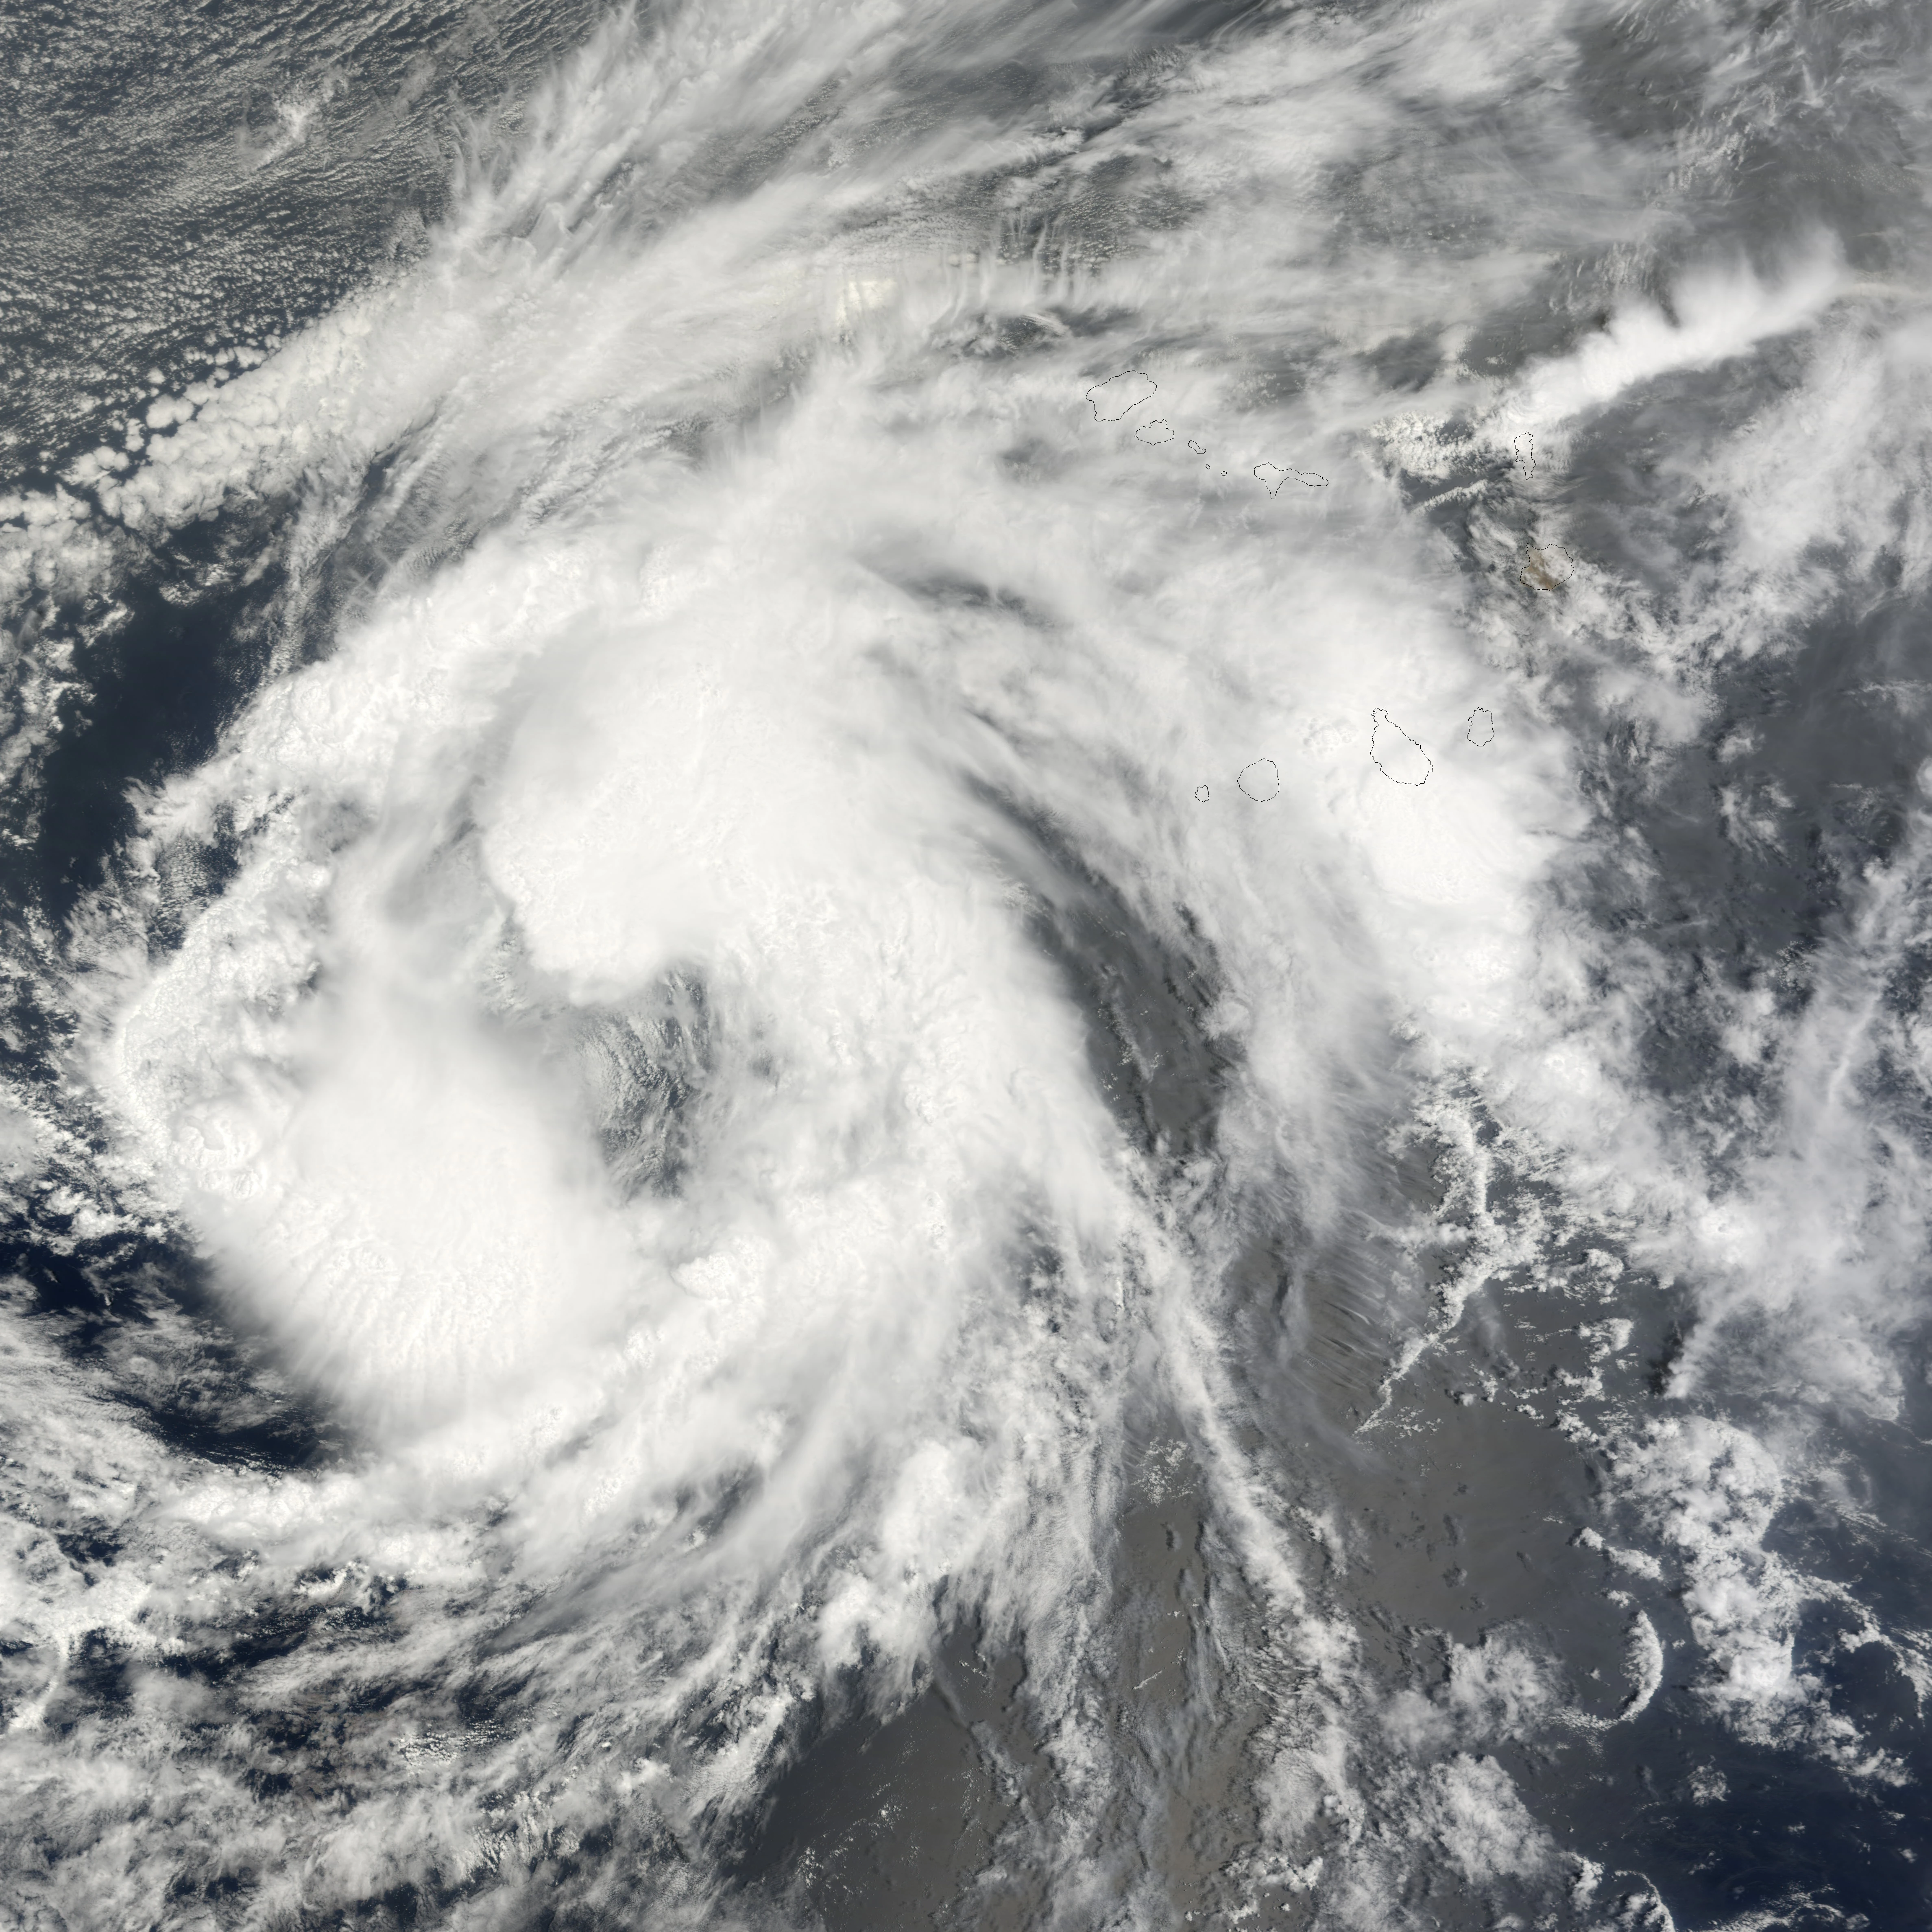
Tropical Storm Lisa[]
| Tropical storm (SSHWS) | |
 | |
| Duration | August 23 – August 25 |
|---|---|
| Peak intensity | 45 mph (75 km/h) (1-min) 1000 mbar (hPa) |
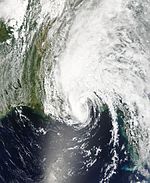
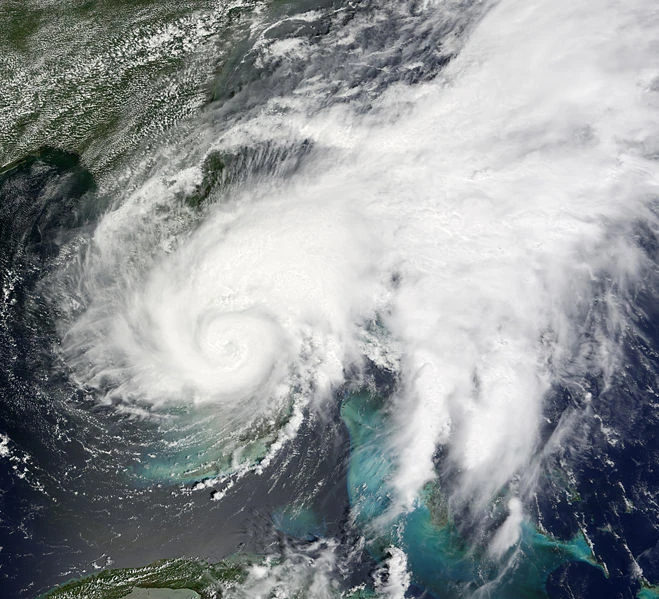
Hurricane Matthew[]
| Category 2 hurricane (SSHWS) | |
 | |
| Duration | August 31 – September 6 |
|---|---|
| Peak intensity | 110 mph (175 km/h) (1-min) 962 mbar (hPa) |
Hurricane Nicole[]
| Category 5 hurricane (SSHWS) | |
 | |
| Duration | September 5 – September 16 |
|---|---|
| Peak intensity | 160 mph (260 km/h) (1-min) 923 mbar (hPa) |
Hurricane Otto[]
| Category 1 hurricane (SSHWS) | |
 | |
| Duration | September 10 – September 15 |
|---|---|
| Peak intensity | 80 mph (130 km/h) (1-min) 982 mbar (hPa) |
Tropical Storm Paula[]
| Tropical storm (SSHWS) | |
 | |
| Duration | September 17 – September 22 |
|---|---|
| Peak intensity | 70 mph (110 km/h) (1-min) 986 mbar (hPa) |
Tropical Depression Seventeen[]
| Tropical depression (SSHWS) | |
 | |
| Duration | September 21 – September 23 |
|---|---|
| Peak intensity | 35 mph (55 km/h) (1-min) 1004 mbar (hPa) |
Hurricane Richard[]
| Category 3 hurricane (SSHWS) | |
 | |
| Duration | September 30 – October 7 |
|---|---|
| Peak intensity | 120 mph (195 km/h) (1-min) 949 mbar (hPa) |
Subtropical Storm Shary[]
| Subtropical storm (SSHWS) | |
 | |
| Duration | October 6 – October 9 |
|---|---|
| Peak intensity | 40 mph (65 km/h) (1-min) 1000 mbar (hPa) |
Tropical Storm Tobias[]
| Tropical storm (SSHWS) | |
 | |
| Duration | October 18 – October 22 |
|---|---|
| Peak intensity | 60 mph (95 km/h) (1-min) 995 mbar (hPa) |
Hurricane Virginie[]
| Category 4 hurricane (SSHWS) | |
 | |
| Duration | October 25 – November 4 |
|---|---|
| Peak intensity | 135 mph (215 km/h) (1-min) 940 mbar (hPa) |
Hurricane Walter[]
| Category 1 hurricane (SSHWS) | |
 | |
| Duration | November 1 – November 6 |
|---|---|
| Peak intensity | 75 mph (120 km/h) (1-min) 987 mbar (hPa) |
Hurricane Alpha[]
| Category 3 hurricane (SSHWS) | |
 | |
| Duration | November 19 – November 26 |
|---|---|
| Peak intensity | 115 mph (185 km/h) (1-min) 957 mbar (hPa) |
Timeline[]

Accumulated Cyclone Energy (ACE) Rating[]
| ACE (104 kt2) – Storm: Source | |||||
|---|---|---|---|---|---|
| 1 | 46.1 | Karl | 12 | 7.25 | Otto |
| 2 | 30.0 | Nicole | 13 | 6.24 | Colin |
| 3 | 24.7 | Gaston | 14 | 6.09 | Walter |
| 4 | 21.3 | Virginie | 15 | 5.18 | Paula |
| 5 | 17.7 | Danielle | 16 | 4.74 | Earl |
| 6 | 16.0 | Richard | 17 | 4.31 | Ian |
| 7 | 14.8 | Alpha | 18 | 4.00 | Julia |
| 8 | 13.9 | Matthew | 19 | 3.62 | Tobias |
| 9 | 10.5 | Alex | 20 | 3.18 | Bonnie |
| 10 | 8.27 | Fiona | 21 | 2.64 | Lisa |
| 11 | 8.04 | Hermine | 22 | 2.07 | Shary |
| Total=260.25 | |||||
ACE is the result of a storm's winds multiplied by how long it lasted for, so storms or subtropical storms that lasted a long time , as well as particularly strong hurricanes , have higher ACE totals. 2016 was active in these terms; with an ACE total of 260. Tropical Depressions are not included in season totals.
Season effects[]
This is a table of the storms and their effects in the 2016 Atlantic hurricane season. This table includes the storm's names, duration, peak intensity, Areas affected (bold indicates made landfall in that region at least once), damages, and death totals. Deaths in parentheses are additional and indirect (an example of an indirect death would be a traffic accident), but are still storm-related. Damage and deaths include totals while the storm was extratropical, a wave or a low. All of the damage figures are in 2016 USD (the listed damage figure is in millions).
| Storm name |
Dates active | Storm category at peak intensity |
Max 1-min wind mph (km/h) |
Min. press. (mbar) |
Areas affected | Damage (USD) |
Deaths |
|---|---|---|---|---|---|---|---|
| Alex | June 13 – June 20 | Category 1 hurricane | 90 (150) | 974 | None | 0 | 0 |
| Bonnie | June 29 – July 2 | Tropical storm | 50 (85) | 1000 | None | 0 | 0 |
| Colin | July 10 – July 16 | Category 1 hurricane | 75 (120) | 987 | Bermuda, The Bahamas, Cuba, Jamaica | 17 | 6 |
| Danielle | July 14 – July 23 | Category 3 hurricane | 125 (205) | 946 | Bermuda | 35 | 9 |
| Earl | July 21 – July 25 | Tropical storm | 65 (100) | 989 | Hispanolia | 48 | 10 |
| Fiona | July 31 – August 6 | Category 1 hurricane | 85 (140) | 979 | None | 0 | 0 |
| Gaston | August 5 – August 17 | Category 4 hurricane | 145 (230) | 936 | Bermuda | 40 | 5 |
| Hermine | August 9 – August 15 | Category 1 hurricane | 85 (140) | 980 | None | 0 | 0 |
| Ian | August 12 – August 17 | Tropical storm | 65 (100) | 993 | US Gulf Coast (Mississippi), Cuba, Jamaica | 105 | 8 |
| Julia | August 16 – August 21 | Tropical storm | 60 (95) | 994 | US East Coast (Florida), The Bahamas | 65 | 5 |
| Karl | August 20 – September 2 | Category 5 hurricane | 190 (305) | 879 | US Gulf Coast (Texas), Mexico, Cuba, Jamaica, Hispaniola, Puerto Rico | 18,490 | 495 |
| Lisa | August 23 – August 25 | Tropical storm | 45 (75) | 1000 | Azores | None | 0 |
| Matthew | August 31 – September 6 | Category 2 hurricane | 110 (175) | 962 | US East Coast (South Carolina), The Bahamas, Cuba | 300 | 10 |
| Nicole | September 5 – September 16 | Category 5 hurricane | 160 (260) | 923 | Puerto Rico, Hispaniola, Nicaragua | 900 | 30 |
| Otto | September 10 – September 15 | Category 1 hurricane | 80 (130) | 982 | Florida, Cuba, Jamaica, Hispaniola | 400 | 15 |
| Paula | September 17 – September 22 | Tropical storm | 70 (110) | 986 | None | 0 | 0 |
| Seventeen | September 21 – September 23 | Tropical depression | 35 (55) | 1004 | None | 0 | 0 |
| Richard | September 30 – October 7 | Category 3 hurricane | 120 (195) | 949 | Mexico, Cuba, Jamaica, Hispaniola | 450 | 14 |
| Shary | October 6 – October 9 | Subtropical storm | 40 (65) | 1000 | US Gulf Coast (Louisiana) | 20 | 4 |
| Tobias | October 18 – October 22 | Tropical storm | 60 (95) | 995 | None | 0 | 0 |
| Virginie | October 25 – Novemberber 4 | Category 4 hurricane | 135 (215) | 940 | Nova Scotia, Bermuda | 60 | 7 |
| Walter | November 1 – November 6 | Category 1 hurricane | 75 (120) | 987 | US Gulf Coast (Texas), Mexico, Cuba, Jamaica | 230 | 13 |
| Alpha | November 19 – November 26 | Category 3 hurricane | 115 (185) | 957 | US East Coast (Florida), The Bahamas, Hispaniola, Puerto Rico | 4,300 | 39 |