The 2013 Atlantic hurricane season was a relatively active season.
Storms
Hurricane Andrea
| Category 1 hurricane (SSHWS) | |
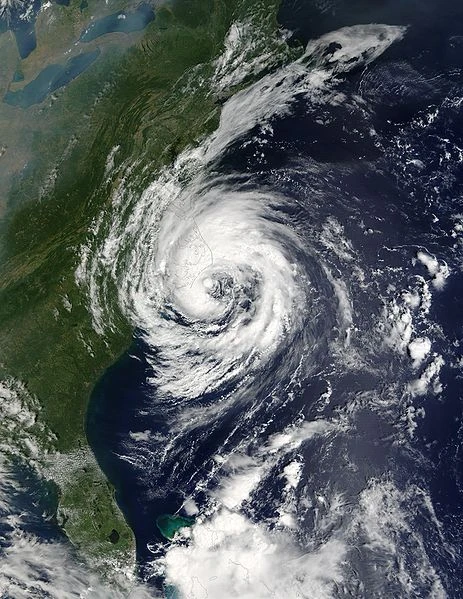 | |
| Duration | June 17 – June 23 |
|---|---|
| Peak intensity | 85 mph (140 km/h) (1-min) 980 mbar (hPa) |
Tropical Storm Barry
| Tropical storm (SSHWS) | |
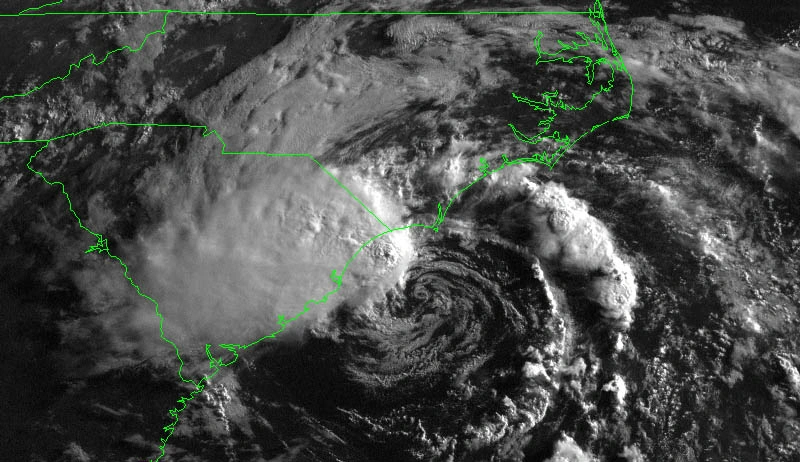 | |
| Duration | June 26 – June 30 |
|---|---|
| Peak intensity | 50 mph (85 km/h) (1-min) 996 mbar (hPa) |
Tropical Storm Chantal
| Tropical storm (SSHWS) | |
 | |
| Duration | July 5 – July 10 |
|---|---|
| Peak intensity | 60 mph (95 km/h) (1-min) 996 mbar (hPa) |
Hurricane Dorian
| Category 3 hurricane (SSHWS) | |
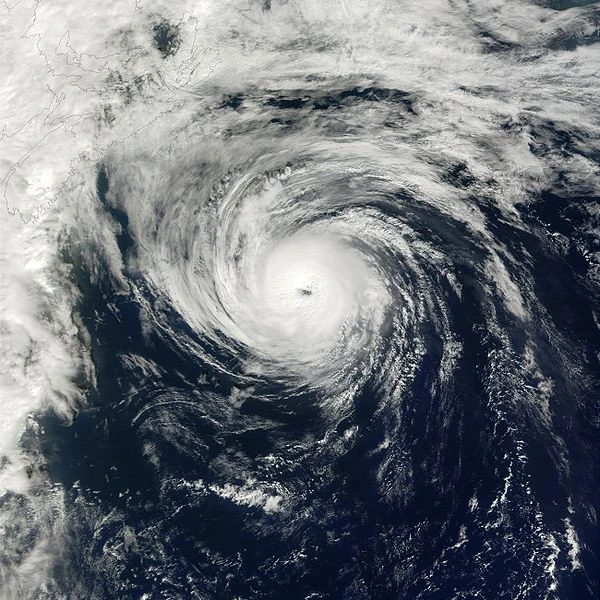 | |
| Duration | July 14 – July 23 |
|---|---|
| Peak intensity | 125 mph (205 km/h) (1-min) 946 mbar (hPa) |
Hurricane Erin
| Category 3 hurricane (SSHWS) | |
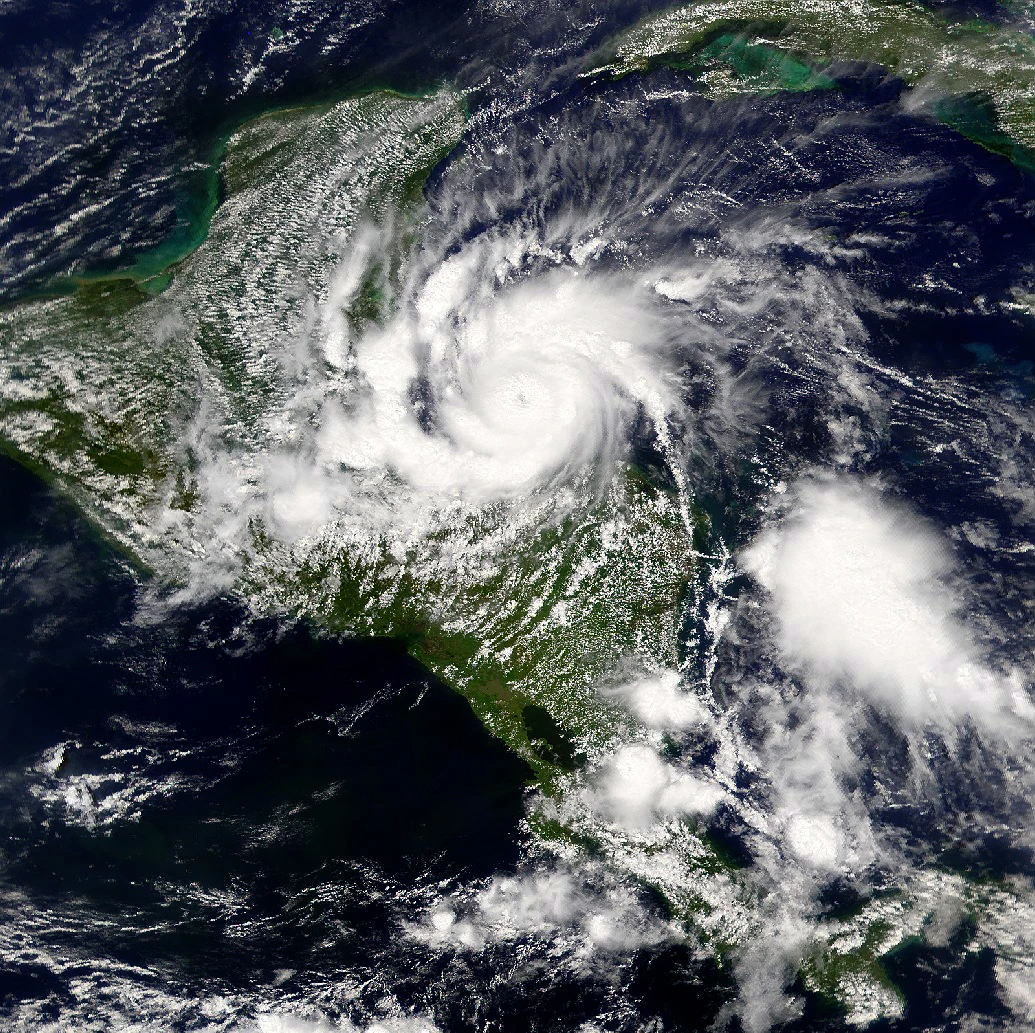 | |
| Duration | July 18 – July 25 |
|---|---|
| Peak intensity | 125 mph (205 km/h) (1-min) 944 mbar (hPa) |
Subtropical Storm Fernand
| Subtropical storm (SSHWS) | |
 | |
| Duration | July 24 – July 30 |
|---|---|
| Peak intensity | 65 mph (100 km/h) (1-min) 994 mbar (hPa) |
Tropical Depression Seven
| Tropical depression (SSHWS) | |
 | |
| Duration | July 31 – August 2 |
|---|---|
| Peak intensity | 35 mph (55 km/h) (1-min) 1000 mbar (hPa) |
Timeline

Accumulated Cyclone Energy (ACE) Rating
| ACE (104 kt2) – Storm: Source | |||||
|---|---|---|---|---|---|
| 1 | 14.27 | Erin | 12 | 0.00 | Storm |
| 2 | 13.96 | Dorian | 13 | 0.00 | Storm |
| 3 | 5.54 | Andrea | 14 | 0.00 | Storm |
| 4 | 2.18 | Chantal | 15 | 0.00 | Storm |
| 5 | 1.75 | Barry | 16 | 0.00 | Storm |
| 6 | 0.00 | Storm | 17 | 0.00 | Storm |
| 7 | 0.00 | Storm | 18 | 0.00 | Storm |
| 8 | 0.00 | Storm | 19 | 0.00 | Storm |
| 9 | 0.00 | Storm | 20 | 0.00 | Storm |
| 10 | 0.00 | Storm | 21 | 0.00 | Storm |
| 11 | 0.00 | Storm | |||
| Total=37.7 (38) | |||||
ACE is the result of a storm's winds multiplied by how long it lasted for, so storms that lasted a long time , as well as particularly strong hurricanes , have higher ACE totals. 2013 was active in these terms; with an ACE total of 225. Tropical Depressions and Subtropical storms are not included in season totals, Namely Subtropical Storm Fernand.
Season effects
This is a table of the storms and their effects in the 2013 Atlantic hurricane season. This table includes the storm's names, duration, peak intensity, Areas affected (bold indicates made landfall in that region at least once), damages, and death totals. Deaths in parentheses are additional and indirect (an example of an indirect death would be a traffic accident), but are still storm-related. Damage and deaths include totals while the storm was extratropical, a wave or a low. All of the damage figures are in 2013 USD (the listed damage figure is in millions).
| Storm name |
Dates active | Storm category at peak intensity |
Max 1-min wind mph (km/h) |
Min. press. (mbar) |
Areas affected | Damage (USD) |
Deaths |
|---|---|---|---|---|---|---|---|
| Andrea | June 17 – June 23 | Category 1 hurricane | 85 (140) | 980 | Bahamas, Florida, The Carolinas, Nova Scotia | 115 | 12 |
| Barry | June 26 – June 30 | Tropical storm | 50 (85) | 996 | Georgia, The Carolinas, Nova Scotia | 7 | 5 |
| Chantal | July 5 – July 9 | Tropical storm | 60 (95) | 996 | Puerto Rico, Dominican Republic | 5 | 4 |
| Dorian | July 14 – July 23 | Category 3 hurricane | 125 (205) | 946 | Azores, Bermuda | 11 | 5 |
| Erin | July 18 – July 25 | Category 3 hurricane | 125 (205) | 944 | Mexico, Honduras, Jamaicas | 500 | 65 |
| Fernand | July 24 – July 30 | Subtropical storm | 65 (100) | 994 | Iceland, Greenland | 15 | 5 |
| Seven | July 31 – August 2 | Tropical depression | 35 (55) | 1000 | Cape Verde islands | 0 | 0 |