The 1970 Atlantic hurricane season began on June 1st, 1970 and ended November 30th, 1970.
Seasonal forecasts[]
| Source | Date | Named
storms |
Hurricanes | Major
hurricanes | |
| NOAA | May 23, 1970 | 12 | 6 | 2 | |
| ––––––––––––––––––––––––––––––––––––––––––––––––––––––– | |||||
| Actual activity | 10 | 5 | 3 | ||
Season Summary[]
Storms[]
|
Tropical Storm Alma[]
| Tropical storm (SSHWS) | |
 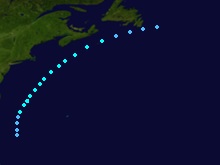 | |
| Duration | June 4 – June 8 |
|---|---|
| Peak intensity | 65 mph (100 km/h) (1-min) 990 mbar (hPa) |
Hurricane Becky[]
| Category 2 hurricane (SSHWS) | |
 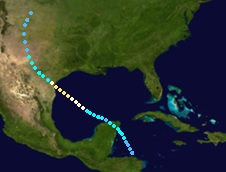 | |
| Duration | July 31 – August 6 |
|---|---|
| Peak intensity | 110 mph (175 km/h) (1-min) 958 mbar (hPa) |
Hurricane Celia[]
| Category 4 hurricane (SSHWS) | |
 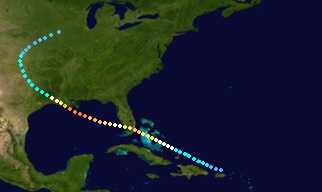 | |
| Duration | August 2 – August 15 |
|---|---|
| Peak intensity | 145 mph (230 km/h) (1-min) 934 mbar (hPa) |
Hurricane Dorothy[]
| Category 1 hurricane (SSHWS) | |
 | |
| Duration | August 16 – August 21 |
|---|---|
| Peak intensity | 75 mph (120 km/h) (1-min) 987 mbar (hPa) |
Tropical Storm Ella[]
| Tropical storm (SSHWS) | |
 | |
| Duration | August 31 – September 5 |
|---|---|
| Peak intensity | 70 mph (110 km/h) (1-min) 982 mbar (hPa) |
Hurricane Felice[]
| Category 4 hurricane (SSHWS) | |
 | |
| Duration | September 1 – September 12 |
|---|---|
| Peak intensity | 150 mph (240 km/h) (1-min) 930 mbar (hPa) |
Tropical Storm Greta[]
| Tropical storm (SSHWS) | |
 | |
| Duration | September 10 – September 14 |
|---|---|
| Peak intensity | 60 mph (95 km/h) (1-min) 995 mbar (hPa) |
Tropical Storm Hallie[]
| Tropical storm (SSHWS) | |
 | |
| Duration | September 29 – October 3 |
|---|---|
| Peak intensity | 65 mph (100 km/h) (1-min) 990 mbar (hPa) |
Hurricane Isabel[]
| Category 3 hurricane (SSHWS) | |
 | |
| Duration | October 19 – October 31 |
|---|---|
| Peak intensity | 120 mph (195 km/h) (1-min) 950 mbar (hPa) |
Tropical Storm Judith[]
| Tropical storm (SSHWS) | |
 | |
| Duration | November 10 – November 14 |
|---|---|
| Peak intensity | 50 mph (85 km/h) (1-min) 996 mbar (hPa) |
Timeline[]

Storm names[]
The following names have been used to name tropical and subtropical cyclones in the 1970 season.
|
|
|
Accumulated Cyclone Energy (ACE) Rating[]
| ACE (104 kt2) – Storm: Source | |||||
|---|---|---|---|---|---|
| 1 | 0.00 | Storm | 12 | 0.00 | Storm |
| 2 | 0.00 | Storm | 13 | 0.00 | Storm |
| 3 | 0.00 | Storm | 14 | 0.00 | Storm |
| 4 | 0.00 | Storm | 15 | 0.00 | Storm |
| 5 | 0.00 | Storm | 16 | 0.00 | Storm |
| 6 | 0.00 | Storm | 17 | 0.00 | Storm |
| 7 | 0.00 | Storm | 18 | 0.00 | Storm |
| 8 | 0.00 | Storm | 19 | 0.00 | Storm |
| 9 | 0.00 | Storm | 20 | 0.00 | Storm |
| 10 | 0.00 | Storm | 21 | 0.00 | Storm |
| 11 | 0.00 | Storm | 22 | 0.00 | Storm |
| Total=0.0 | |||||
ACE is the result of a storm's winds multiplied by how long it lasted for, so storms or subtropical storms (Originally not included up until 2012) that at lasted a long time , as well as particularly strong hurricanes , have higher ACE totals. Tropical Depressions are not included in season total.
Season effects[]
This is a table of the storms and their effects in the 1970 Atlantic hurricane season. This table includes the storm's names, duration, peak intensity, Areas affected (bold indicates made landfall in that region at least once), damages, and death totals. Deaths in parentheses are additional and indirect (an example of an indirect death would be a traffic accident), but are still storm-related. Damage and deaths include totals while the storm was extratropical, a wave or a low. All of the damage figures are in 2014 USD (the listed damage figure is in millions).
| Storm name |
Dates active | Storm category at peak intensity |
Max 1-min wind mph (km/h) |
Min. press. (mbar) |
Areas affected | Damage (USD) |
Deaths |
|---|---|---|---|---|---|---|---|
| Alma | June 4 – June 8 | Tropical storm | 65 (100) | 990 | None | 0 | 0 |
| Becky | July 31 – August 6 | Category 2 hurricane | 110 (175) | 958 | US Gulf Coast (Texas), Mexico | 65 | 14 |
| Celia | August 2 – August 15 | Category 4 hurricane | 145 (230) | 934 | US Gulf Coast (Louisiana), US East Coast (Florida), The Bahamas, Hispaniola, Puerto Rico | 1,935 | 110 |